 Open Access Article
Creative Commons Attribution 3.0 Unported Licence
Particle and DBP removal efficiency and toxicity evaluation of polypropylene cotton filters in household drinking water purification systems†
Linlin
Pan
ab,
Yuan
Zhuang
*b,
Ruya
Chen
bd,
Yitian
He
bc and
Baoyou
Shi
 *bc
*bc
aSchool of Municipal and Environmental Engineering, Shandong Jianzhu University, Jinan 250101, P R China
bKey Laboratory of Drinking Water Science and Technology, Research Center for Eco-Environmental Sciences, Chinese Academy of Sciences, Beijing 100085, China. E-mail: yuanzhuang@rcees.ac.cn; byshi@rcees.ac.cn
cUniversity of Chinese Academy of Sciences, Beijing 100049, China
dSchool of Environmental Science and Engineering, Zhejiang Gongshang University, Hangzhou, 310012, Zhejiang, China
First published on 4th November 2023
Abstract
Polypropylene cotton filters (PCFs) are traditionally considered an essential pretreatment unit for coarse-particle removal in household water purification systems. However, the actual roles of PCFs in controlling drinking water quality risks, especially in discolored water, have not been well understood, and the particulate matter collected on PCFs has not been well-studied. In this study, the detailed characterization of a used PCF found that many types of iron particles, which usually are dominant in drinking water distribution systems, including magnetite, hematite, maghemite, goethite, and lepidocrocite, were mainly captured by the outer-most layer (20% of the total thickness) of PCF. MTT tests using human hepatocytes showed that the iron particles captured by the PCF exhibited obvious cytotoxicity, and the particle toxicity decreased from the outer layer to the inner layer, indicating that PCFs can efficiently reduce iron-particle-associated toxicity risk. In addition, the PCF had a significant ability for the enrichment of trace organic pollutants (e.g. perfluorooctanoic acid), which would further reduce the water quality risks. Furthermore, some common opportunistic microbial pathogen species, including Acinetobacter, Mycobacteria, and Pseudomonas, could be intercepted effectively by the PCF. Filtration experiments using a new PCF showed that PCF was effective not only in particle removal (96.1–99.8%) but also in disinfection by-product (DBP) removal (7.9–65.9%). Above all, as a household water treatment unit, PCFs not only protect the purification units but can also have many previously unrecognized functions in water quality risk control.
Water impactPolypropylene cotton filters (PCFs) are traditionally considered an essential pretreatment unit for coarse particle removal in household water purification systems. However, the actual roles played by PCFs in controlling drinking water quality risks, especially in discolored water, have not been well understood, and the particulate matter enriched on PCFs has not been well-studied. In this study, the detailed characterization of a used PCF demonstrated that many kinds of iron particles, which usually are dominant in drinking water distribution systems, including magnetite, hematite, maghemite, goethite, and lepidocrocite, were mainly captured by the most outer layer (20% of the total thickness) of PCF. MTT tests performed using human hepatocytes showed that the iron particles captured by the PCF exhibited obvious cytotoxicity, and the particle toxicity decreased from the outer layer to the inner layer, indicating that the PCF can efficiently reduce iron-particle-associated toxicity risks. Metal oxides, especially iron oxides, found in the PCF can interact with the DNA and nuclear proteins, thereby triggering DNA damage and eventually leading to human hepatocyte apoptosis. Overall, the PCF is still a reliable tap water purification unit. |
1. Introduction
Drinking water distribution systems (DWDS) are receiving increasing attention in the process of drinking water purification and distribution process. The transportation process through DWDS often deteriorates water quality, even to the extent of quality violations to occur. Although it is often assumed that bacteria are more detrimental to the human body, iron-based particles from DWDS have been shown to be toxic to human hepatocytes.1 Under hydraulic disturbance, the loose iron deposits in DWDS generate discoloration, and the particles may be consumed by the users via drinking. The loose deposits in DWDS have been shown to pose health risks in several studies.1–4 Although many old pipes are replaced with new ones, both old and new pipelines are capable of accumulating loose deposits, with old metal pipes posing a relatively higher risk.5,6 Implementing water purifiers in taps at the consumer end is considered preferable to replacing aging pipes on a large scale.7With the development of household water treatment (HWT), the issue of deteriorating water quality during transportation via DWDS might be largely resolved. Surveys have estimated that 6.1 million to 10.2 million lead service lines8 are still likely in use in the United States, meanwhile, 31% of water mains comprise of old cast iron pipes or galvanized iron pipes.9 Household multistage filters employed by rural residents for directly treating raw water removed over 60% of turbidity and 1.5 log of E. coli.10 While the point-of-use (POU) filters almost always dramatically reduce consumer lead exposure levels, even iron release may clog the POU filters.11,12 The protective effect of the filter has also been suggested to reduce the number of reported diarrhea-related visits to community health workers or clinics.13 Field investigations show that deploying POU water purifiers constituting coconut shell activated carbon can achieve 21.1–99.2% removal of 14 polyfluoroalkyl substances (PFASs) and emerging PFASs in tap water based on the ratio of influent and effluent.7 The cartridge filter used for treating natural water develops a microbiological community on its surface, and chlorination effectively reduces total coliforms to nearly non-existent levels.14
Multi-stage treatment techniques are used in home water purifiers for various target contaminants. HWT can be accomplished by POU or point-of-entry (POE) treatment devices.15 As guided by some local governments in China (e.g. Shenzhen), most schools have installed POU facilities for daily use; however, most POUs are equipped with only a boiling process, some with activated carbon cartridges, and a few have an ultrafiltration membrane installed.16 In contrast to the HWT for treating rural raw water, the HWT units in water purifiers at the end of the municipal pipe network typically comprise a polypropylene fiber cotton filter (PCF), activated carbon filter, and ultrafiltration/nanofiltration/RO membrane filter, while some also include an ultraviolet disinfection process.15,17 Almost all HWT units have a PCF, and due to cost or other constraints, many households may only utilize a single-stage filter element, such as a PCF. In general, the PCF, as a pretreatment unit, is traditionally considered only effective for retaining coarse particles of size 1–5 μm. However, the roles that PCFs actually play have not been clearly understood yet.
In this study, the used PCFs was split into three parts according to the filtration efficiency and the different materials intercepted by a PCF filter, including particles, opportunistic pathogens, and organic matter, had been analyzed. To better understand the main components of the particles filtered by PCFs and their impact on human health, cytotoxicity evaluation using human hepatocytes was conducted. Meanwhile, the particle and disinfection by-products (DBPs) removal performance of PCF was also tested. This research is expected to provide some new insights into the functions of PCFs toward guaranteeing drinking water safety.
2. Material and methods
2.1 Collection and splitting of the used PCF sample
In this study, three PCFs (two used PCFs and one new PCF manufactured by Tianjin Nuohua Qingyuan Technology Co., Ltd) were taken from resident POU treatment units in Beijing, China. The photographs of all the PCFs employed in this study are shown in Fig. S1.† The external diameter of the PCF was 6.5 cm, and the whole PCF was about 25 cm in height. The two used PCFs had been in use for about one month and the total volumes of filtered water were about 20 m3 and 19.5 m3, respectively. One of the used PCFs was disassembled, and the particles found on it were analyzed. It was transversely split immediately into three parts under sterile conditions, namely the outer, intermediate, and inner layers. Each layer of the old PCF was further cut into three sections: ten centimeters for particle characterization, ten centimeters for toxicity evaluation, and five centimeters for microbiological correlation investigation. The other used PCF and the new PCF were installed in the laboratory to evaluate the efficiency in treating water discoloration. Considering the limitations of the experimental conditions and the acquisition of actual PCF samples, two old PCFs and a fresh filter were utilized in this investigation. A larger number of samples would be more conducive to the study of the characteristics of PCFs.2.2 Toxicity evaluation test
Under sterile conditions, the PCF was split from the 5 cm long bulk and disassembled into three layers. The debris of the three parts was put into a centrifuge tube with 50 mL ultra-pure water for ultrasonic treatment for 1 h to disperse the particles into the water. After ultrasonic treatment, the particle dispersions were used for the toxicity evaluation test.1 The healthy human liver cells used in the toxicity test were purchased from the Shanghai Cell Bank of the Chinese Academy of Sciences. The detailed steps of the toxicity test are provided in the ESI.†2.3 PFAS accumulation onto particles from the PCF
The outer layer of the PCF was split into about 0.5 cm thick and 10 cm long strips and subjected to ultrasonic vibration for 1 h in 600 mL ultrapure water, then filtered through 0.45 μm membrane filters and freeze-dried for 24 h to obtain the particles.The obtained particles were dispersed at a concentration of 0.1 mg mL−1 in perfluorooctanoic acid (PFOA) solutions at a series of initial PFOA concentrations (1, 10, 20, 50, and 100 μg L−1). After certain reaction times (0, 1, 2, 3, 6, 12, 24, 30, 36, 48, and 72 h), the samples were collected for solid–liquid separation and PFOA measurement. Glass bottles with Teflon caps were used during the experiment. The solutions were continuously shaken in a thermostatic shaker at 200 rpm. Three duplicate experiments were conducted for each sample.
2.4 Discolored water treatment by the new and used PCFs
To evaluate the efficiency of the PCFs in treating discolored water, three faucets (faucets 1#, 2# and 3#) were established at the same ends of the DWDS in our laboratory. A 50 cm galvanized steel pipe with serious corrosion, which had been used for more than 20 years, was placed in the front section of the three taps (Fig. S2†) to ensure that the water discoloration phenomenon would often occur. These faucets had a 50 mL min−1 flow rate limit and were accessible continuously throughout the day. Faucet 2# was connected to the used PCF and faucet 3# was connected to the new PCF. When tap water from faucet 1# became discolored, water from faucet 1# was used as the sample before PCF treatment, while the water samples from faucets 2# and 3# were designated as samples after treatment by the new and used PCFs, respectively. Disinfection by-products (DBPs) and metal ions in the collected water before and after treatment were analyzed.2.5 Characterization
The morphologies of particles in all PCF samples were characterized using transmission electron microscopy (TEM, FEI, Tecnai G2 F20), X-ray diffraction (XRD, X'Pert 3 Powder), and X-ray fluorescence (XRF, ARL Perform'X 4200). An Agilent 1200 HPLC system was used in conjunction with an Agilent 6460 Triple Quadrupole (QQQ) mass spectrometer (Agilent Technologies, USA) in the negative electrospray ionization (ESI−) mode to analyze PFOA concentration. Pretreatment of the water samples was done using established procedures within a few weeks.18 DBPs are generated through chemical reactions between disinfectants (such as chlorine, chloramine, or ozone) and organic or inorganic matter present in the water being treated. The common DBPs in drinking water are some organic compounds. The residual chlorine concentration in the sampling area ranged from 0.1 to 0.5 mg L−1. The following DBPs were analyzed: a trihalomethane (THMs), namely trichloromethane (TCM), a haloacetonitrile (HANs), namely dichloroacetonitrile (DCAN), and haloacetic acids (HAAs), including dichloroacetic acid (DCAA) and trichloroacetic acid (TCAA). The water samples were filtered through 0.45 μm membrane filters before being tested for DBPs. Based on the USEPA Standard Methods 551.1 and 552.3, the C-DBPs and N-DBPs analysis was done using an Agilent 7890 gas chromatograph with an electron capture detector (GC/ECD).19 The column used was an HP-5 fused silica capillary column (30 m, 0.25 mm I.D. with 0.25 μm film thickness).20The details of other analysis methods, including DNA extraction and quantitative polymerase chain reaction (qPCR), and statistical analysis are shown in ESI.†
2.6 Water quality analysis
Temperature, pH, free chlorine, dissolved oxygen (DO), and turbidity were measured at the moment of collection. A portable water quality testing device was used to measure temperature, DO, and pH. (HD40Q, Hach, USA). The USEPA DPD technique was used to quantify free chlorine (DR300, Hach, USA).For metal ion detection, we divided the two-centimeter-thick PCF into three layers from the inside to the outside and cut it into 2 mm thick blocks measuring one centimeter by one centimeter. They were then placed in a sterile centrifuge tube and pulsed with ultrapure water using ultrasound for 60 minutes to yield three water samples. These three samples and the water samples before and after filtration were tested for metal concentration. A 50 mL polypropylene centrifuge tube was used to collect water for total and soluble metal concentration analysis. One aliquot of each water sample was digested using 1% (w/w) HNO3 for 24 h to analyze the concentration of total metals.21 The other aliquot of water sample was filtered through a 0.22 μm polyethersulfone membrane to analyze the concentration of soluble metals. Inductively coupled plasma mass spectrometry (ICP-MS, NexION 300X 0–200 g L−1) was used to analyze the metal concentrations. Inductively coupled plasma optical emission spectroscopy (ICP-OES, OPTIMA 8300 0.2–200 mg L−1) was used to determine the amounts of individual metallic elements in the water samples. Fe, V, Zn, Al, Cr, Fe, Mn, Sr, Ba, and Cu were among the elements analyzed. The total quantity of particles was verified by a Desktop Laser Particle Analyzer GR-1500A produced by Hangzhou Grean Technology Co., Ltd. It could detect particles with a particle size of more than 1 μm. For quality control, standard samples with established concentrations were utilized. The ESI† section contains other details regarding analysis and testing.
2.7 Statistical analysis
For quality filtering, QIIME (version 1.17) was employed with the following criteria: (i) the 300 bp reads were trimmed at any site with an average quality score of 20 or above across a 50 bp sliding window, while truncated reads less than 50 bp were discarded. (ii) Reads with unclear characters, precise barcode matching, and two nucleotide mismatches in primer matching were all eliminated. (iii) Only sequences with overlaps greater than 10 bp were constructed in the order in which they overlapped. The reads that could not be put together were discarded. Sequences with 97 percent similarity were clustered into operational units (OTUs) using UPARSE (version 7.1; http://drive5.com/uparse/), and chimeric sequences were identified and removed using UCHIME. With a confidence level of 70%, all sequences were assigned to taxonomic ranks using the RDP Classifier (http://rdp.cme.msu.edu/) against the silva (SSU115) 16S rRNA database.All statistical analyses were performed using the vegan package in R (v.4.0.2; http://www.r-project.org/).22 A bar chart (phylum and class level) and a heatmap were used to depict the makeup of the bacterial community (genus level). The alpha-diversity (Shannon index) in the DWDS bacterial community was calculated using Mothur calculations (version v.1.30.1 http://www.mothur.org/wiki/Schloss SOP#Alpha diversity) and Student's t-test. To reveal the variance among the microbial community compositions with spatiotemporal fluctuations in the DWDSs, principal coordinate analysis (PCoA) and analysis of similarity (ANOSIM) based on the Bray–Curtis distance were used. The Bray–Curtis distance was utilized to explain the change in microbial community compositions owing to physicochemical conditions using permutational multivariate analysis of variance (PERMANOVA).23 To represent the difference in dominant species among the samples, the Kruskal–Wallis H test was utilized. For convenient plots, gene copy numbers were log(x + 1) transformed, where x is the gene copy number quantified by qPCR.24
3. Results and discussion
3.1 Characteristics of particle removal by PCF
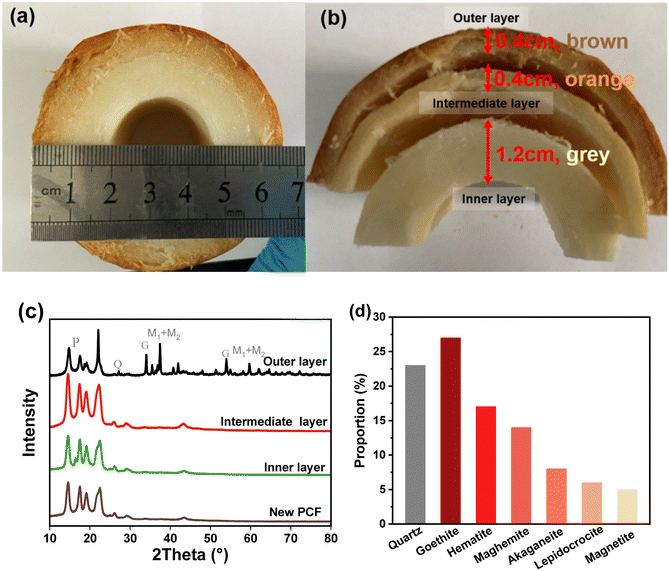
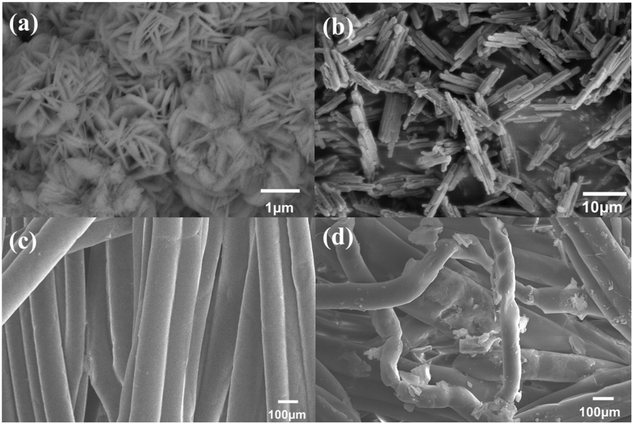
In the old used PCF, a layered structure with obvious color changes was observed (Fig. 1a). The outer layer (0.4 cm) showed a brown color, while the intermediate layer (0.4 cm) and the inner layer (1.2 cm) were orange and yellow (Fig. 1b). The contents of each layer of the new PCF and the used PCF were examined by XRD to better understand the crystal form of the substances enriched on each layer of the PCFs. The XRD (Fig. 1c) analysis revealed the presence of goethite, quartz, hematite, maghemite, akaganeite, lepidocrocite, and magnetite, and in the outer layer of the PCF, goethite exhibited the greatest composition at 27%, followed by quartz at 23% (Fig. 1d). These elements resemble the primary components of the pipe scale described in the previous studies.1,25 Iron is the major component of the corrosive pipe scale, and it enters the water with water quality fluctuations, resulting in discoloration and eventually reaching the consumers.26 Based on the XRD results, these oxides were mainly concentrated in the outer layer of the PCFs. The XRD results of the intermediate layer and the inner layer were similar to the new PP cotton, indicating that only few crystals were enriched in the intermediate layer and the inner layer.The percentages of iron oxides in the three layers of the used PCF sample from outside to inside were 11.2%, 4%, and 2.4%, respectively, according to the XRF analysis results in Fig. 2, which further indicates that the particles were mainly captured by the outer layer of the PCF. This is in accordance with the XRD result that these oxides were mainly detected in the outer layer. Iron occupied the highest percentage among the elements in each layer, followed by silicon, which is also consistent with the XRD results. In the outer and intermediate layers, iron contributed to more than 40% of the total content. The principal components of the sediments enriched on the PCF, according to XRD and XRF analysis, were different kinds of iron oxides, consistent with the components of loose deposits obtained from DWDS reported in previous research27–30 and indicating the effective removal of particles from DWDS by the PCF. Fig. 3 shows the SEM images of particles on the outer layer of the PCF, and the presence of urchin-like nanorods similar to FeOOH morphology was found,1,6 which is in accordance with the XRD and XRF observations. The sharp surface of the particles may enhance their potential to damage cells and hence their toxicity risks.1,31
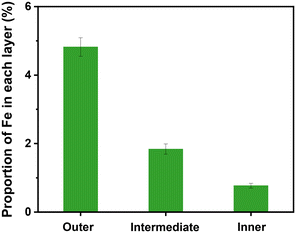 | ||
| Fig. 2 XRF analysis of Fe content in the three layers (outer layer, intermediate layer, and inner layer) of the used PCF. | ||
3.2 Particle-associated toxicity risk control by PCFs
Iron nanoparticles can quickly accumulate in the liver and spleen as a result of macrophage phagocytosis and trapping; even when iron oxide nanoparticles are tailored to target specific tissues or organs, liver absorption has been shown to be the most effective clearance route.1,32 Humans are more likely to be exposed to iron particles through drinking water. Healthy human liver cells were selected to assess the toxicity of the particles from different layers of the PCF. Fig. S3† shows the fluorescence microscopy images of the cells before and after treatment with the particle samples; the green cells are alive and the red cells are dead. After 72 hours, no dead cells were found in the blank sample (without particles). After treatment with the particles from three layers of the PCF, dead cells appeared in all the samples after 72 hours. The cell viability of the samples treated with particles from the different layers of PCF followed the order: outer layer < intermediate layer < inner layer (Fig. 4), which indicates that the particles intercepted by the outer layer of the PCF had the highest toxicity. Thus, the PCF, especially the outer layer, is effective in reducing the toxicity risks induced by the particles. It has been discovered that iron oxides interact with the DNA and nuclear proteins, thereby triggering DNA damage and eventually leading to cell cycle regulation, apoptosis or cancer.33,34 Iron oxides may not only take electrons directly from the DNA but also use DNA as an electron donor to make reactive oxygen species from oxygen, which would dramatically accelerate oxidative damage to cells.1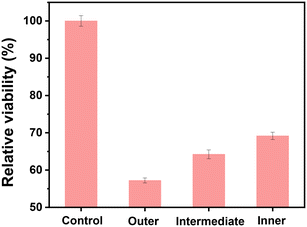 | ||
| Fig. 4 Relative viabilities determined via the MTT assay of liver cells with the particles from the three layers (outer layer, intermediate layer, and inner layer) of the used PCF. | ||
Among the particles obtained from the DWDS, besides the cytotoxicity originating from the metal oxide components, the particles might have further toxicity risks due to organic matter accumulation.35 A series of perfluorooctanoic acid (PFOA) solutions with initial concentrations (1, 10, 20, 50, and 100 μg L) were used to evaluate the pollutant accumulation ability of the particles from the outer layer of PCF (Fig. S4†). The PFOA accumulation efficiency of the particles under different concentrations were 51.52%, 25.06%, 16.71%, 10.63%, and 8.43%, respectively. The Langmuir model and the Freundlich model (eqn (S1) and (S2)†) were applied to evaluate the most suitable adsorption isotherm for PFOA adsorption onto the particles (Fig. S5†).36,37 The R2 values of the Langmuir model and Freundlich model were 0.991 and 0.994, indicating that the adsorption process was fitted well by the both models. The maximum adsorption capacity was 0.123 mg g−1, which indicates the strong PFOA accumulation ability of the particles on the PCF. Thus, PCFs can further reduce the toxicity risks induced by toxic organics, such as PFOA, through particle accumulation.
3.3 Bacterial community composition characteristics of PCF
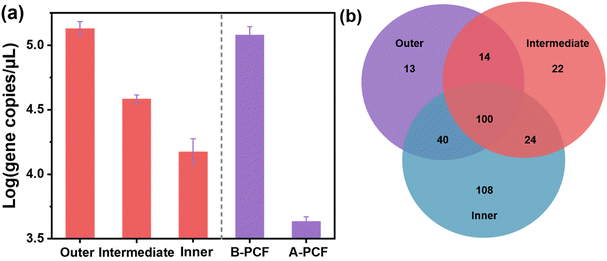
The PCF had 321 different OTUs, 100 of which were shared among the three layers (Fig. 5b). Interestingly, though the particles mainly accumulated in the outer layer, the microorganism diversity was found to be higher in the inner layer: 108 OTUs existed in the inner layer, which was sharply higher than the other layers. The average number of gene copies in the PCF decreased from outside to inside, and the average number of water samples before filtration was much higher than that after filtration (Fig. 5a). The PCF had a certain microorganism filtering ability. In the intermediate and inner layers, Actinobacteriota was the most abundant phylum, while Proteobacteria was the most dominant in the outer layer (Fig. S6†), indicating the higher chlorine-resistance ability of Proteobacteria as the outer layer would come in contact with more chlorine. Actinobacteriota was also the most abundant class (Fig. S6†). The PCF had a high proportion of four genera, including Rhodococcus, Phreatobacter, Sphingomonas, and Delftia (Fig. S6†). The four genera constituted 92.98%, 96.68%, and 95.99% of the bacteria in the outer, intermediate and inner layers, respectively. The most abundant genus in the three layers of the PCF was Rhodococcus, accounting for 46.60%, 71.43%, and 72.65% of bacteria in the outer, intermediate and inner layers, respectively. In recent years, Phreatobacter has been found to be a prevalent genus in DWDS,38–41 and it was also the most prevalent in juvenile biofilms formed in chlorine-disinfected drinking water samples of (within 3 months).38 Similarly, Phreatobacter was the second-highest abundant genus in the outer layer, and its prevalence was much higher than that in the intermediate and inner layers. Thus, the outer layer had less bacteria than the inner layer due to more contact with chlorine. Sphingomonas is a common genus in DWDS biofilms and exists constantly and consistently in the biofilms studied across different times and conditions.42,43 It has been pointed out that the relative abundance of Actinomycetes positively correlates with total chlorine.39 This might be the reason that the inner layer had the highest diversity.Pathogens have been detected in biofilms growing in DWDS and represent substantial risks to human health.4,39,44 Some opportunistic pathogens can thrive in water with 2 mg L−1 chloramine.45 Several species of Acinetobacter, Mycobacteria, and Pseudomonas4,28,46,47 that are common opportunistic pathogens were detected in this study (Table S2†). At the OTU level, there were 108 distinct populations in the inner layer, which included Pseudomonas. Further, 22 and 13 endemic populations were found in the intermediate layer and the outer layer, respectively. The relative abundance of these three genera decreased from outside to inside. The residual chlorine decreased from 0.65 mg L−1 to 0.40 mg L−1 when the tap water was filtered by the PCF, which may also be the explanation for the greater microbial abundance in the inner layer. Meanwhile, Pseudomonas has also been found in 0.5 mg L−1 chlorine water,48 which might also be the reason for its existence in the inner layer. Therefore, the microbial risks were still limited due to the low quantity of biomass in the inner layer.
3.4 DBP removal by PCF from discolored water
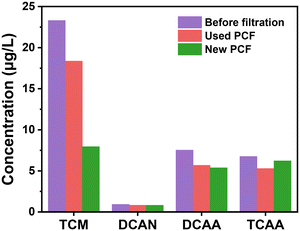
The efficiency of PCF in treating discolored water was evaluated. DBP levels are important water quality indexes related to toxicity in DWDS.49,50 The removal rates of TCM, DCAN, DCAA, and TCAA by the used PCF were 20.8%, 10.8%, 24.7%, and 21.8%, respectively (Fig. 6). Correspondingly, the removal rates of TCM, DCAN, DCAA, and TCAA by the new PCF were 65.9%, 12.1%, 28.7%, and 7.9% respectively. Surprisingly, the PCF had a certain DBP removal effect. Overall, the DBP removal effectiveness of the used PCF was lower than that of the new PCF. In addition to TCAA, the new PCF had a better DBP treatment capability. A decrease in the removal of THMs and HAAs by POU filters with time or facility aging has also been reported in the literature,51 but the reason is yet to be further studied.DBPs are directly proportional to the humic acid content.52,53 The natural organic matter (NOM) enrichment value of the outer layer of the PCF was found to be the highest (Fig. 7 and S8†), and those of the intermediate and inner layers were less, which indicates that the particles in the outer layer may help accumulate NOM. The water had a lower content of NOM after filtration by the PCF, further proving that NOM was intercepted by the PCF. The presence of NOM in the PCF might be an important reason for the low DBP removal efficiency of the old PCF.
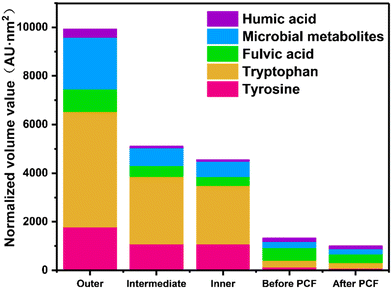 | ||
| Fig. 7 Integration of the EEMs on each layer of the PCF, and the change in EEM concentration before and after filtration with the PCF. | ||
When discoloration happens, it is necessary to consider the efficiency of the PCF element in intercepting particles. Metal concentrations in the discolored water before and after filtration by the PCF are shown in Fig. S7.† The concentrations of iron, aluminum, and manganese were high, and certain hazardous elements, such as lead and arsenic, were also found to exist, which is comparable to the dominant metal composition of particles previously reported in DWDS.26,29,38 The dominant components in the discolored water were also very comparable to the metal components captured by the PCF. Furthermore, the concentrations of lead and arsenic in the discolored water were 5.23 μg L−1 and 63.9 μg L−1, respectively. In addition to metal strontium and metal barium, PCF had a 96.1% to 99.8% interception efficiency toward other metals, which was comparable to that of the new PCF (96.7%) (Fig. S7, Table S3†). When filtered by the PCF, the turbidity of the discolored water dropped from 590 NTU to 0.53 NTU revealing that PCFs can provide effective discoloration control in the household.
4. Conclusions
PCF is commonly used as a pretreatment unit for particle removal in household water purification systems, but the controllability of various water quality risks by PCFs is still not clear. This research provides a feasible way of studying the filtration and potential risk control performance of PCFs. This is the first study to investigate the ability of the PCF in the home water purifier to intercept the particulates and DBPs in drinking water. The filtered particles concentrated on PCFs may cause toxicity to human liver cells and pose potential microbiological risks. Here, we confirmed the effectiveness of PCF in particle control, especially the outer layer (20% of the total thickness). Moreover, for the first time, we recognized that a PCF can control comprehensive toxicity risks, mainly those associated with iron oxides in the particles. Some species of common opportunistic pathogens were filtered effectively by PCF. Microorganism diversity was more favored in the inner layer, resulting in an increase in OUTs number from the outside to inside, but the microbial risks were still limited due to the low quantity of biomass in the inner layer. In addition, our results verify that PCFs have a certain DBP removal effect. Therefore, though PCF is usually used with other treatments, such as boiling, adsorption, ultrafiltration, nanofiltration, and reverse osmosis techniques, it can also be employed independently for effective water purification under specific conditions, such as for intercepting metal particles, certain DBPs, and microorganisms. Especially, when there is an emergency of water discoloration, PCFs can be used either independently as a control method or as a pre-treatment unit to protect the downstream units when being used in combination with ultrafiltration, nanofiltration, and reverse osmosis techniques.Conflicts of interest
There are no conflicts to declare.Acknowledgements
This study was supported the National Natural Science Foundation of China (51978652) and the special fund from the Key Laboratory of Drinking Water Science and Technology, Research Center for Eco-Environmental Sciences, Chinese Academy of Sciences (20Z02KLDWST).References
- Y. Zhuang, B. Han, R. Chen and B. Shi, Water Res., 2019, 165, 114999 CrossRef CAS PubMed.
- G. Liu, Y. Tao, Y. Zhang, M. Lut, W. Knibbe, P. van der Wielen, W. Liu, G. Medema and W. van der Meer, Water Res., 2017, 124, 435–445 CrossRef CAS PubMed.
- G. Liu, Y. Zhang, W. Knibbe, C. Feng, W. Liu, G. Medema and W. van der Meer, Water Res., 2017, 116, 135–148 CrossRef CAS PubMed.
- H. Wang, C. Hu, Y. Shen, B. Shi, D. Zhao and X. Xing, Chemosphere, 2019, 218, 197–204 CrossRef CAS.
- X. Lin, Q. Xu, Y. Li, B. Zhao, L. Li and Z. Qiang, J. Environ. Sci., 2021, 110, 73–83 CrossRef CAS.
- F. Yang, B. Shi, Y. Bai, H. Sun, D. A. Lytle and D. Wang, Water Res., 2014, 59, 46–57 CrossRef CAS PubMed.
- A. He, Y. Lu, F. Chen, F. Li, K. Lv, H. Cao, Y. Sun, Y. Liang, J. Li, L. Zhao, X. Zhang, L. Li, Y. Wang and G. Jiang, Sci. Total Environ., 2022, 831, 154988 CrossRef CAS PubMed.
- C. Cartier, L. Laroche, E. Deshommes, S. Nour, G. Richard, M. Edwards and M. Prévost, J. - Am. Water Works Assoc., 2011, 103, 55–67 CrossRef CAS.
- D. A. Lytle, M. Tang, A. T. Francis, A. J. O. Donnell and J. L. Newton, Water Res., 2020, 183, 116037 CrossRef CAS PubMed.
- R. C. Medeiros, N. de M. N. Fava, B. L. S. Freitas, L. P. Sabogal-Paz, M. T. Hoffmann, J. Davis, P. Fernandez-Ibañez and J. A. Byrne, Water Res., 2020, 178, 115816 CrossRef CAS PubMed.
- J. M. Purchase, R. Rouillier, K. J. Pieper and M. Edwards, Environ. Sci. Technol. Lett., 2021, 8, 155–160 CrossRef CAS.
- R. J. Carvajal-Nigro, J. M. Purchase, K. J. Pieper, A. Katner and M. Edwards, Environ. Eng. Sci., 2022, 39, 587–597 CrossRef CAS.
- M. A. Kirby, C. L. Nagel, G. Rosa, M. M. Umupfasoni, L. Iyakaremye, E. A. Thomas and T. F. Clasen, Int. J. Hyg. Environ. Health, 2017, 220, 1020–1029 CrossRef PubMed.
- P. M. F. Maciel, N. D. M. N. Fava, A. W. Lamon, P. Fernandez-Ibañez, J. A. Byrne and L. P. Sabogal-Paz, J. Water Process Eng., 2021, 43, 102203 CrossRef.
- Y. Deng, Water Res., 2021, 198, 117151 CrossRef CAS PubMed.
- L. Wang, Y. Chen, S. Chen, L. Long, Y. Bu, H. Xu, B. Chen and S. Krasner, Water Res., 2019, 159, 203–213 CrossRef CAS PubMed.
- C. Patterson, J. Burkhardt, D. Schupp, E. R. Krishnan, S. Dyment, S. Merritt, L. Zintek and D. Kleinmaier, AWWA Water Sci., 2019, 1, e1131 CrossRef CAS PubMed.
- R. Chen, G. Li, Y. He, L. Pan, Y. Yu and B. Shi, Water Res., 2021, 198, 117162 CrossRef CAS PubMed.
- J. Fang, J. Ma, X. Yang and C. Shang, Water Res., 2010, 44, 1934–1940 CrossRef CAS PubMed.
- Y. Yu, X. Ma, R. Chen, G. Li, H. Tao and B. Shi, Chemosphere, 2019, 228, 101–109 CrossRef CAS PubMed.
- G. Li, X. Ma, R. Chen, Y. Yu, H. Tao and B. Shi, Water Res., 2019, 163, 114897 CrossRef CAS PubMed.
- P. Dixon, J. Veg. Sci., 2003, 14, 927–930 CrossRef.
- M. J. Anderson, Austral Ecol., 2001, 26, 32–46 Search PubMed.
- L. Huo, L. Pan, R. Chen, B. Shi, H. Wang and S. He, Environ. Sci.: Water Res. Technol., 2021, 7, 983–992 RSC.
- H. Zhang, L. Zhao, D. Liu, J. Wang, X. Zhang and C. Chen, Water Res., 2020, 176, 115742 CrossRef CAS PubMed.
- Y. Tian, J. Li, S. Jia and W. Zhao, Chemosphere, 2021, 267, 129270 CrossRef CAS PubMed.
- J. Gao, Q. Liu, L. Song and B. Shi, Sci. Total Environ., 2019, 652, 1387–1395 CrossRef PubMed.
- Z. Jing, Z. Lu, T. Mao, W. Cao, W. Wang, Y. Ke, Z. Zhao, X. Wang and W. Sun, Sci. Total Environ., 2021, 776, 145986 CrossRef CAS PubMed.
- L. Pan, G. Li, J. Li, J. Gao, Q. Liu and B. Shi, Sci. Total Environ., 2022, 806, 150549 CrossRef CAS PubMed.
- S. Zhang, Y. Tian, H. Guo, R. Liu, N. He, Z. Li and W. Zhao, Chemosphere, 2022, 290, 133145 CrossRef CAS PubMed.
- Y. Zhuang, C. Shen, Y. Gu, R. Chen and B. Shi, Water Res., 2021, 189, 116632 CrossRef CAS PubMed.
- K. C. Briley-Saebo, Y. S. Cho, P. X. Shaw, S. K. Ryu, V. Mani, S. Dickson, E. Izadmehr, S. Green, Z. A. Fayad and S. Tsimikas, J. Am. Coll. Cardiol., 2011, 57, 337–347 CrossRef CAS PubMed.
- J. Briffa, E. Sinagra and R. Blundell, Heliyon, 2020, 6, e4691 CrossRef PubMed.
- P. B. Tchounwou, C. G. Yedjou, A. K. Patlolla and D. J. Sutton, in Molecular, Clinical and Environmental Toxicology: Volume 3: Environmental Toxicology, ed. A. Luch, Springer Basel, Basel, 2012, pp. 133–164 Search PubMed.
- Y. Zhuang, B. Han, R. Chen and B. Shi, Chem. Eng. J., 2020, 396, 125157 CrossRef CAS.
- L. Cermakova, I. Kopecka, M. Pivokonsky, L. Pivokonska and V. Janda, Sep. Purif. Technol., 2017, 173, 330–338 CrossRef CAS.
- Z. Zhao, W. Sun and M. B. Ray, Sci. Total Environ., 2022, 806, 150885 CrossRef CAS PubMed.
- W. Li, Q. Tan, W. Zhou, J. Chen, Y. Li, F. Wang and J. Zhang, Chemosphere, 2020, 242, 125310 CrossRef CAS PubMed.
- W. Li, F. Wang, J. Zhang, Y. Qiao, C. Xu, Y. Liu, L. Qian, W. Li and B. Dong, Sci. Total Environ., 2016, 544, 499–506 CrossRef CAS PubMed.
- X. Ma, G. Li, R. Chen, Y. Yu, H. Tao, G. Zhang and B. Shi, J. Environ. Sci., 2020, 87, 331–340 CrossRef CAS PubMed.
- X. Ma, G. Li, Y. Yu, R. Chen, Y. Zhang, H. Tao, G. Zhang and B. Shi, Environ. Sci.: Water Res. Technol., 2019, 5, 1689–1698 RSC.
- I. Douterelo, K. E. Fish and J. B. Boxall, Water Res., 2018, 141, 74–85 CrossRef CAS PubMed.
- I. Douterelo, M. Jackson, C. Solomon and J. Boxall, Appl. Microbiol. Biotechnol., 2016, 100, 3301–3311 CrossRef CAS PubMed.
- H. Wang, C. R. Proctor, M. A. Edwards, M. Pryor, J. W. Santo Domingo, H. Ryu, A. K. Camper, A. Olson and A. Pruden, Environ. Sci. Technol., 2014, 48, 10624–10633 CrossRef CAS PubMed.
- H. Wang, M. Edwards, J. O. Falkinham and A. Pruden, Appl. Environ. Microbiol., 2012, 78, 6285–6294 CrossRef CAS PubMed.
- C. D. Norton, M. W. LeChevallier and J. O. Falkinham, Water Res., 2004, 38, 1457–1466 CrossRef CAS PubMed.
- H. Wang, C. Hu, L. Liu and X. Xing, J. Hazard. Mater., 2017, 339, 174–181 CrossRef CAS PubMed.
- R. Shrivastava, R. K. Upreti, S. R. Jain, K. N. Prasad, P. K. Seth and U. C. Chaturvedi, Ecotoxicol. Environ. Saf., 2004, 58, 277–283 CrossRef CAS PubMed.
- W. Chu, D. Yao, Y. Deng, M. Sui and N. Gao, J. Hazard. Mater., 2017, 327, 153–160 CrossRef CAS PubMed.
- Y. Yu, G. Li, R. Chen and B. Shi, Water Res., 2021, 204, 117582 CrossRef CAS PubMed.
- B. Chen, J. Jiang, X. Yang, X. Zhang and P. Westerhoff, Water Res., 2021, 200, 117265 CrossRef CAS PubMed.
- L. Ma, F. Peng, Q. Dong, H. Li and Z. Yang, Chemosphere, 2022, 296, 133998 CrossRef CAS PubMed.
- Y. Zhang, Z. Lu, Z. Zhang, B. Shi, C. Hu, L. Lyu, P. Zuo, J. Metz and H. Wang, Sep. Purif. Technol., 2021, 260, 118234 CrossRef CAS.
Footnote |
| † Electronic supplementary information (ESI) available. See DOI: https://doi.org/10.1039/d3ew00615h |
| This journal is © The Royal Society of Chemistry 2024 |

