Quality evaluation and health risk assessment of drinking water in Minab County: hydrochemical analysis and artificial neural network modeling†
Majid
Amiri Gharaghani
 a,
Amin
Mohammadpour
 a,
Mahsa
Keshtkar
b,
Abooalfazl
Azhdarpoor
*c and
Razieh
Khaksefidi
*a
aDepartment of Environmental Health Engineering, School of Health, Student Research Committee, Shiraz University of Medical Sciences, Shiraz, Iran. E-mail: r.khaksefidi110@gmail.com
bDepartment of Environmental Health Engineering, School of Health, Hormozgan University of Medical Sciences, Hormozgan, Iran
cResearch Center for Health Sciences, Department of Environmental Health Engineering, School of Health, Shiraz University of Medical Sciences, Shiraz, Iran. E-mail: azhdarpoor@sums.ac.ir
First published on 17th November 2023
Abstract
In many regions, access to clean and safe drinking water remains a critical concern due to the potential health risks associated with water contamination. Thus, this study focused on assessing the water quality and associated health risks of drinking water in Minab County, located within Hormozgan Province. The computed WQI values were between 27.5 and 105 with the average of 60.5 in this study, where fluoride had the most significant impact. In the probabilistic approach, approximately 50% of the collected samples showed very good water quality, while less than 0.03% was classified as poor quality. Furthermore, to evaluate the effect of different input parameters on the precision of an artificial neural network (ANN) model for the prediction of F concentration in the water, a sensitive analysis was performed. The dominant water compositions in this area consisted of Na–K–Cl and Na–K–HCO₃ types. The results showed that the average values of hazard quotient (HQ) for all the pollutants in all age groups were below 1. Moreover, the non-carcinogenic risk according to the health risk assessment in children was higher than adults and teenagers. The Sobol analysis results indicated that the nitrate concentration (CW) in children, teenagers and adults and water intake rate in infants were the most sensitive parameters. Based on the results, chloride, NO3, and TH had the most significant effects as independent variables on the determination of F concentration in water, as determined by the sensitivity analysis. Therefore, it is necessary to implement a comprehensive management program for water resources aimed at reducing non-carcinogenic pollutants and improving the quality of drinking water for the local population.
Water impactThis study assessed the drinking water quality and health risks in Minab City, Hormozgan. The findings revealed low health risks but higher non-carcinogenic risks for children. Recommendations include reducing pollutants and improving water quality through comprehensive management programs. |
Introduction
Among the natural resources on Earth, water is the most significant and important. It is a vital element for all living beings on Earth; however, nowadays it is becoming scare due to the population growth, development of communities and municipal and agricultural water use, industrial consumption and generation of energy. Thus, the appropriate quantity and quality of water resources are essential for human survival, ecological environment conservation and sustainable economic and regional development.1–3 One the one hand, the limited resources, and on the other hand, microbial and chemical contamination of water have become a great environmental challenge and a major concern in many countries worldwide.4,5 The World Health Organization (WHO) has assessed that roughly 94% of global cases of diarrheal diseases and 10% of the overall disease burden stem from unsafe drinking water, inadequate sanitation, and poor hygiene practices.6 In 2000, UNESCO identified water pollution as a significant contributor to human health problems and noted that approximately 2.3 billion individuals worldwide are affected by water-related illnesses. Reports from both the World Health Organization and UNESCO reveal that in developing nations, more than 2.2 million people succumb annually due to the consumption of contaminated and unhygienic water, leading to avoidable fatalities.7The major water supplies around the world are groundwater resources, which are conventional resources for different uses in communities due to the little rainfall and lack of surface water sources.2 The World Health Organization (WHO) has prioritized universal access to safe drinking water for all people at every stage of development and social and economic conditions as one of its primary objectives.8
Water quality monitoring is important to maintain public health and determine if it is suitable for different uses or not. This process is done by conducting physicochemical and microbial (bacteriological) analyses and with the help of evaluating and classifying resources using the Water Quality Index (WQI) tool.9,10 This index is one of the most famous and widely used tools for investigating water quality around the world for urban, industrial and agricultural purposes (irrigation and non-irrigation) due to its wide use in determining and classifying water quality, and also its flexibility in the input of information.9,11 Chemical substances including nitrate, nitrite, and fluoride can pass through different soil layers and potentially cause groundwater pollution. Generally, the concentration of NO3− in natural groundwater is very low. Nitrate and nitrite pollution arising from human and agricultural activities, hazardous solid waste landfills and polluted industrial areas can easily penetrate groundwater through the soil. The maximum contamination level (MCL) for nitrate (NO3−) in drinking water is suggested to be 44.2 mg L−1 by the USA Environmental Protection Agency and 50 mg L−1 by the World Health Organization.12 High NO3− consumption causes adverse health issues. According to epidemiological data, the presence of nitrate in drinking water can lead to cancer in humans, has adverse effects in infants and other adverse health risks. The most important potential health risks from nitrate consumption are methemoglobinemia, esophageal and thyroid hypertrophy, diabetes, and stomach cancer.10,13,14
Also, nitrite may react with different amines, i.e., secondary or tertiary, and form carcinogenic N-nitroso derivatives. Alternatively, tooth decay can be reduced by 40% due to sufficient fluoride. Thus, to reduce dental caries, fluoridation of drinking water as a regular public health process is performed by many developed countries.1,12,15
The WHO has proposed the fluoride level of 1.5 mg L−1 in drinking water to maintain the health and growth of teeth and bones. However, it is important to note that concentrations higher than this amount can lead to severe poisoning, dental and skeletal fluorosis, as well as kidney and nervous system disorders and muscle diseases.1 Therefore, adopting suitable management strategies for potable water resources to avoid a decline in their quality for consumers and preserve human health requires regular water quality monitoring and health risk assessment of potentially dangerous elements.5,16,17 Health risk assessment is a practical and beneficial method for estimating the health effects inflicted to humans through exposure to pollutants from different routes.1,18 To enhance the general understanding of society and decision makers regarding the levels of environmental pollutants, especially toxic, non-biodegradable, and bio-accumulative pollutants in drinking water for the purpose of implementing management policies and encouraging people to reduce pollution in water resources, the health risks associated with these pollutants can be assessed using various models.19–21
One of the most common models is the Health Risk Assessment model provided by the United States Environmental Protection Agency (USEPA). The USEPA established laws and guidelines for assessing the health risks and economic effects of suspected carcinogens in 1976, and since then, accurate assessments of health risks and economic effects have been a significant part of their monitoring process. Additionally, the EPA has set water quality standards for 64 pollutants and provided a quantitative description of risk assessment.22
In addition, because of the spatial extent and the serious challenges related to the impossibility of collecting samples to identify contaminated regions, it is recommended to use appropriate methods to estimate the pollutant concentration in points not sampled based on obtained outcomes of taken samples. Presently, with the development of computer sciences, new methods for estimating and determining values have been presented ,among which we machine learning (ML) methods are very useful. These algorithms train the relationship that intrinsically exist in the available samples. Also, in case of access to adequate samples and proper training of these algorithms, they can learn the relationship between the input and output variables. The method of artificial neural networks (ANN) is one of the methods used in the field of machine learning in a desirable way. In this study, we examined the physicochemical attributes of drinking water to categorize its qualitative properties. Utilizing the Water Quality Index (WQI), we evaluated the quality of the water sources by employing both deterministic and probabilistic methodologies. To delineate potential sources of contamination, we utilized hierarchical cluster analysis (HCA). Correlation matrices and artificial neural networks (ANNs) were employed to establish intricate relationships among the various water constituents. A thorough risk assessment was conducted to determine the non-carcinogenic health implications linked with the presence of nitrate, nitrite, and fluoride, employing both deterministic and probabilistic paradigms. In our comprehensive analysis, we also incorporated the Sobol sensitivity analysis to understand the influence of individual parameters on the outcomes.
Material and methods
Study area
Minab is a County located in the southern province of Hormozgan in Iran with an area of 6878.5 km2 and a population of 259![[thin space (1/6-em)]](https://www.rsc.org/images/entities/char_2009.gif) 221 people. This County is situated at an altitude of 16 meters above sea level, has a topography characterized by ups and downs and placed in the arid and hot desert climate region with latitude and longitude of 48′′ 8′ 1467/27° North and 48′′ 4′ 08/57° East, respectively. The annual average rainfall is 227.3, the relative humidity is 57%, and the optimum temperature in this County is 27 °C. Groundwater is one of the most significant accessible water resources in this region and its quality is very important for many different consumers. This is while most of the water from rainfall evaporates immediately because of the dry and hot climate and groundwater recharge is negligible.
221 people. This County is situated at an altitude of 16 meters above sea level, has a topography characterized by ups and downs and placed in the arid and hot desert climate region with latitude and longitude of 48′′ 8′ 1467/27° North and 48′′ 4′ 08/57° East, respectively. The annual average rainfall is 227.3, the relative humidity is 57%, and the optimum temperature in this County is 27 °C. Groundwater is one of the most significant accessible water resources in this region and its quality is very important for many different consumers. This is while most of the water from rainfall evaporates immediately because of the dry and hot climate and groundwater recharge is negligible.
Sample collection
This study was conducted on 280 samples of drinking water taken during 2021. The drinking water samples were collected at the regional level, and after conducting tests according to the standard method, the results were analyzed. Sampling and preparation of the samples were done according to the Standard Method, 20th edition. The experiments were carried out with two repetitions in the presence of a control sample. For quantitative analysis, Microsoft Excel version 2019 was utilized. The monitoring parameters included electrical conductivity (EC), total dissolved solids (TDS), total alkalinity, total hardness and the amount of F−, Cl−, SO42−, NO2−, NO3−, Ca2+, Mg2+, K+ and Na+. Finally, the locations of sampling were chosen in a way that covered the entire County.Measurement of the WQI index
The Water Quality Index (WQI) is a comprehensive method for evaluating the quality of water, which is widely used for determining the water quality for drinking purposes. The index is calculated as follows:The first step in calculating the WQI is the appropriate weighting of each water quality parameter based on its importance. This weighting was done based on past surveys, as shown in Table 1.
| Parameter | Weight | Standard of WHO (mg L−1) | Relation weight (Wi) |
|---|---|---|---|
| pH | 4 | 7.5 | 0.0816 |
| EC | 4 | 1500 | 0.0816 |
| TDS | 5 | 1000 | 0.1020 |
| ALK | 3 | 200 | 0.0612 |
| TH | 2 | 300 | 0.0408 |
| Ca2+ | 2 | 75 | 0.0408 |
| Mg2+ | 2 | 50 | 0.0408 |
| Cl− | 3 | 250 | 0.0612 |
| SO42− | 4 | 250 | 0.0816 |
| F− | 4 | 1.5 | 0.0816 |
| NO2− | 5 | 3 | 0.1020 |
| Na+ | 3 | 200 | 0.0612 |
| K+ | 3 | 12 | 0.0612 |
| NO3− | 5 | 45 | 0.1020 |
| 49 |
In the second step, according to eqn (1), the scale of the quality rate was calculated by dividing the concentration of each water sample parameter (Ci) by its standard value (Si). Finally, in the third step, using eqn (2), the value of WQI was estimated. In this equation, Wi is the weight and n is the number of each parameter. The unit of sample concentration and standard value is in mg L−1.
 | (1) |
 | (2) |
In the present study, the method of non-carcinogenic health risk assessment based on the US EPA for nitrate, nitrite and fluoride and four exposed groups including infants (0–2 years), children (2–6 years), teenagers (6–16 years) and adults (>16 years) was used. After determining the value of CDI and RFD, the amounts of non-carcinogenic health risks for nitrate, nitrite and fluoride were calculated using eqn (3).
 | (3) |
HQi: hazard quotient of non-carcinogenic substances,
CDI: chronic daily intake dose (mg/kg/day) and
RFD: reference dose (mg/kg/day).24–26
The values of chronic daily intake (CDI) for the elements present in drinking water with the unit of mg kg−1 per day were computed using eqn (4), as follows:
 | (4) |
| Group | Ingestion rate (L d−1) | Body weight (kg) | RFD (nitrate) (mg/kg/day) | RFD (nitrite) (mg/kg/day) | RFD (fluoride) (mg/kg/day) |
|---|---|---|---|---|---|
| Infant | 0.08 | 10 | 1.6 | 0.1 | 0.06 |
| Children | 0.85 | 15 | 1.6 | 0.1 | 0.06 |
| Teenager | 2 | 50 | 1.6 | 0.1 | 0.06 |
| Adult | 2.5 | 78 | 1.6 | 0.1 | 0.06 |
The combined health risks of nitrate, nitrite and fluoride can be computed using the hazard index (HI). This index was calculated using eqn (5).
| HI = HQNitrate + HQNitrite + HQFluoride | (5) |
In the present study, the values of HI were calculated for four ageing groups of infants, children, teenagers and adults. For this purpose, Monte Carlo simulation was used with the help of the R version 4.2.2 software.
Probabilistic risk assessment and sensitivity analysis
When the health risk assessment for an exposed population to a single or combined potential risk factors is calculated in such a way that the risk value is only reported by a single number, the error and final uncertainty of the obtained results are more possible. Therefore, to minimize the possible uncertainties, sensitivity analysis (SA) using the Monte Carlo technique was conducted. In this technique, a range of numbers relevant to the value of a variable is considered interchangeably for a single number and the calculation is continuously repeated. Consequently, the output values of the health risks are composed of a range of values and not a single number. In this type of simulation, it is possible to see the sensitivity of the health risk assessment result to a parameter that has the most impact on it.The Sobol sensitivity indices quantify the fraction of individual variance of a specific variable to the aggregate variance. The primary component, also referred to as the first-order sensitivity index (FOSI), illuminates the influence of an individual variable on the total variance of the model. Subsequently, the second-order sensitivity index (SOSI) clarifies the intertwined effect among multiple variables. Ultimately, the total sensitivity index (TSI) quantifies the cumulative effect of the variable on the final variance. To determine the significance in the SOSI and TSI, indices exceeding 0.1 were classified as highly sensitive, those in the range of 0.01 to 0.1 as sensitive, and anything less than 0.01 as insensitive. These calculations were performed and detailed using the R.4.2.2 software, incorporating packages such as ‘EnvStats’, ‘sensobol’, ‘EnviroPRA’, and ‘Mc2d’.
Artificial neural networks for estimating fluoride concentration
Data modeling by the use of artificial neural networks (ANNs) to approximate the concentration of fluoride in water samples from the study area was done using the R software version 4.2.2 (packages (“nnet” “caret”)). To estimate the concentration of elements in the water samples in the R software, the data set was divided into two training and testing data sets. Specifically, 80% of the data was considered for training the network, and eventually 20% it was used for testing the model. Statistical correlation coefficient (R2) and square mean square error (SMSE) were used to select the best model.Results and discussion
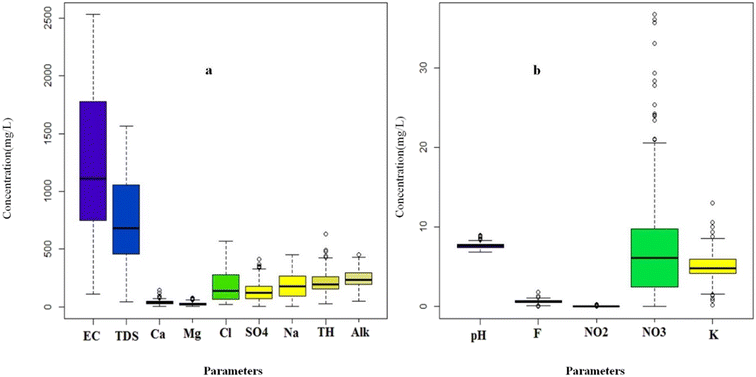
The amounts of physical and chemical parameters measured in the drinking water from Minab County are shown in Fig. 1a and b. According to this figure, the values of TDS in investigated samples varied between 43.7 to 1566.5 mg L−1 with the average of 766.20 mg L−1. Based on the WHO guidelines (2011), the highest TDS limit is 1000 mg L−1. Also, 74.65% of the samples had a TDS of less than 1000 mg L−1, and when it is less than this amount, the ground water can be classified as freshwater. Therefore, in this region, approximately 75% of the taken samples were freshwater and 25% were salty water.10,16The amounts of EC (electrical conductivity) varied from 110 to 2530 μs cm−1 with the average of 1270.58 μs cm−1. The EC can be classified to three types, i.e., type 1 when the EC value is less than 1500 μs cm−1 (low). Type 2 belongs to EC values between 1500 to 3000 μs cm−1 (moderate) and type 3 for amounts of more than 3000 μs cm−1 (high).25,29 In this region, the EC values of 67.14% for the samples were less than the WHO recommendation. Therefore, the EC in the study area is classified as type 1. Higher values of EC and TDS in groundwater indicate the dominance of the rock–water interaction mechanism and the infiltration of seawater containing salt. Salt penetration may be the reason for the increase in EC in places close to the sea in this area.30–32 The average concentration of calcium was 38.50 mg L−1 and it was in a wider range in compared to the magnesium concentration. Only 6 samples consisted of a calcium ion concentration more than the allowable limit recommended by the WHO, which can be unsuitable for domestic consumption and cause abdominal discomforts.10,29,33 The average amount of magnesium was 27.20 mg L−1 ,which is lower compared to calcium. About 14% of the samples had a concentration of magnesium ions higher than the permissible limit of 50 mg L−1. The high calcium and magnesium ion concentration can be attributed to the Earth's crust in the area, which causes the hardness of surface and groundwater.15 Sodium was the prevailing ion among the cations, which had a concentration in the range of 3.5 to 451 mg L−1 with the average of 191.3 mg L−1. Also, 42.15% of the samples had a sodium concentration higher than 200 mg L−1 (recommended amount by the WHO). The high amounts of sodium ions can be attributed to the infiltration of sea water into the groundwater and aquifers, ion exchange with calcium and magnesium ions absorbed by rocks and soils and the vicinity of this county to the sea.10,16,29,34–36
Nitrate (NO3−) and nitrite (NO2−) were found in most of the studied water samples and their average concentration was 7.66 and 0.03 mg L−1, respectively. The maximum amount of these anions in this investigation was 36.7 mg L−1 for nitrate and 0.25 mg L−1 for nitrite, which can be related to the excessive use of nitrate chemical fertilizers, leakage from septic tanks, and also the intensification of this pollution with human wastewater, which is widely left without any management in the entire study area.15,29,37,38 It should be mentioned that the concentration of these two ions in all the samples did not exceed the permissible limit according to the WHO standards. Pang et al., in their survey about nitrate in groundwater, reported that the most widespread pollutants in aquifers were nitrogenous compounds, which originated from agricultural sources (non-point and multi-point).39 The average fluoride content in the drinking water samples from Minab County was 0.658, falling in the range recommended by the WHO. Only two samples exceeded the limit, while 13.92% had fluoride below this range. The minimum recorded was zero, and the maximum was 1.8 mg L−1. The lack of fluoride in some areas can cause tooth decay, especially in young individuals. Fluoride enrichment in groundwater is due to mineral leaching under alkaline conditions and increased rainfall.15,40 The SO42− ion content in the analyzed samples was observed to be in the range of 3 to 410 mg L−1 with an average of 140.49 mg L−1 and the concentration of this ion in 12.85% of the samples was higher than the permissible limit.
Piper diagram to characterize the chemical structure of drinking water
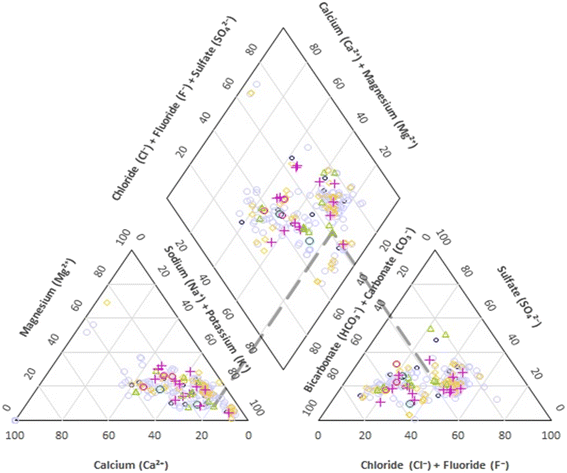
Using the Piper diagram, we can gain a comprehensive understanding of the hydro-chemical properties and the evolution of groundwater. This diagram depicts the predominant chemical type of water. Our samples were plotted on this three-line diagram to visually represent the hydro-chemical characteristics of the groundwater (Fig. 2). The Piper diagram consists of a central rhombus flanked by two triangles. The rhombus depicts the six types of water quality based on the sample locations, while the triangles represent different cations and anions. The cations and anions are represented as a percentage of their total concentration in milligrams per liter. The major cations include Na+, Ca2+, Mg2+, and K+, while the primary anions are Cl−, F−, SO42−, and HCO3−, determining the water composition. Fig. 2 reveals that within the cation triangle, the samples are skewed towards the right, suggesting that the groundwater possesses a higher content of alkali metals (Na + K) compared to alkaline earth metals (Ca + Mg). In the anion triangle, the samples predominantly lie towards the left, indicating a bicarbonate type of water, with some being of chloride and fluoride types. The content of the rhombus provides a holistic characterization of groundwater. The majority of samples are positioned centrally but lean left within the rhombus, suggesting mixed-type groundwater. However, some samples tilt to the right, signifying water characterized by Na+ + HCO3−. Hence, the dominant hydrochemical characterization of groundwater in Minab county includes Na–K–HCO3 and Na–K–Cl types, although a few samples displayed water types of Na–K–SO4 and Ca–Mg–Cl–SO4 composition. Overall, the analyzed area exhibits water with notable fluoride contamination, characterized by high concentrations of Cl−, HCO3−, and Na+, but a lower concentration of Ca2+. Consequently, the prominent water types in this region are Na–K–Cl and Na–K–HCO3, with some occurrences of Na–K–SO4 and Ca–Mg–Cl–SO4.Water quality index (WQI) calculation
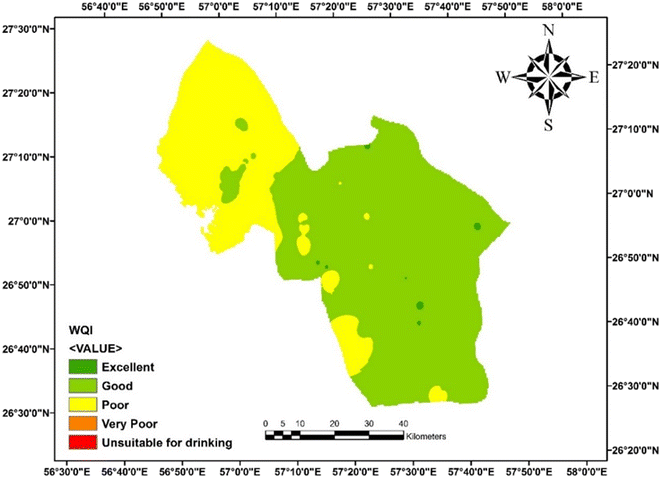
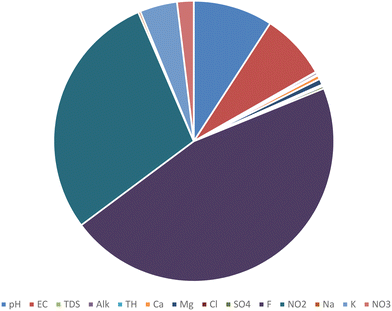
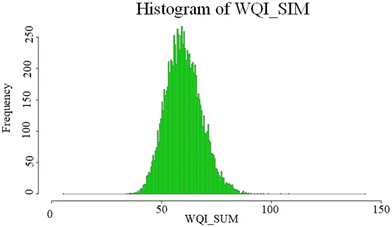
The results of the WQI calculations based on WHO standards were in the range of 27.5 to 105 with the average of 60.5. According to the average WQI in 280 investigated water samples, 38% of these samples had very good water quality, 57% categorized as good water, and the water quality in the 5% of the samples was poor, which may be under the positive influence of leaching and dissolution of salt or gypsum rock formations in the aquifers. The high concentration of chloride, sodium and EC obviously indicates that the main process responsible for this water quality reduction is the rock–water interaction.10 According to the reported results, the quality of water taken from underground resources in Minab County can be classified as good quality and is suitable for drinking. The WQI model has advantages such as comparing the quality of different sources and the quality of water resources over time, and thus can be an important tool for environmental management.39 As shown in Fig. 3, in most parts of this County, the water quality is desirable, which is shown in light green. In the places shown with dark green color, the water has excellent quality. In the north-western areas and scattered yellow spots in the other parts of the County, the water quality is poor, which can be attributed to the proximity of this County to the sea, and subsequently increasing dissolved ions in the groundwater. In this study, in addition to estimating the WQI in a deterministic way, a probabilistic approach by using Monte Carlo simulation was conducted. The simulation results are shown as a histogram in Fig. 5. Based on this histogram, the WQI in the collected samples with very good quality was estimated to be 50%. Also, 49.973% of the samples had good quality and less than 0.03% of the samples were evaluated to have poor water quality. Fig. 4 identifies the parameters influencing the Water Quality Index (WQI). Among them, fluoride has the most significant impact on the water quality in this region. Subsequently, nitrates and total dissolved solids (TDS) are also influential factors on the WQI. The high concentration of fluoride in the water in this area is attributed to geological factors, which lead to the dissolution of fluoride-containing compounds such as fluorite, apatite, biotite, and hornblende in the water. Also, fluoride-containing minerals in the region or possible seawater intrusion from nearby coastal areas occur.40,41 Additionally, the elevated levels of nitrates are linked to human activities such as sewage discharge and the use of chemical compounds in agriculture. The high TDS levels are also due to the proximity of this region to the sea. Therefore, an assessment of the population exposure should be examined, given that besides water, dietary sources are one of the other pathways of exposure for individuals, which further underscores the importance of this issue.Hierarchical clustering analysis (HCA)
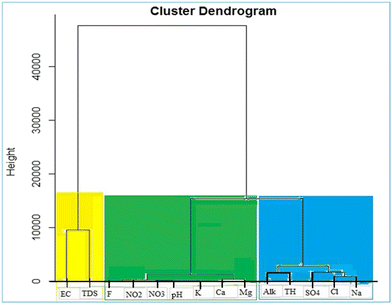
To group the similar quality and same risk characteristics samples into the same cluster/class in water quality assessment, HCA is commonly employed. The HCA of the standardized data was performed using Ward's and Euclidean squared distance methods (Fig. 6) and the R software version 4.2.2. Given that the TDS includes all dissolved solids in water, including ions that contribute to its electrical conductivity (EC), there is a strong relationship between TDS and EC. Thus, as the TDS increases, the water conductivity also increases. Accordingly, TDS and EC are often used interchangeably to assess water quality and are placed in the same cluster or category. Fluoride, nitrate, nitrite, pH, potassium, calcium, and magnesium are placed in one cluster, indicating that they have a similar pattern of values in the data set. The reason for this clustering can be explained based on the physical and chemical attributes of these variables. Fluoride, nitrate and nitrite are related to the chemical composition of water, given that they are commonly found in groundwater and drinking water resources. Water pH is also a notable factor that affects the solubility and availability of these chemicals. Potassium, calcium, and magnesium are all important minerals that are commonly found in soil and water and can also affect the pH and chemical composition of water. The placement of total hardness, chloride, sulfate, sodium and alkalinity in water resources in one class through hierarchical clustering can be attributed to the infiltration of salt water and lateral flow from nearby aquifers. This phenomenon reflects the complicated interaction between various geochemical and hydrological factors that have an effect on water quality. The presence of chloride in this cluster indicates the presence of surface pollutants and human activities such as agriculture including the use of fertilizer and leaching mineral residues from sedimentary rocks, which can cause the entrance of the significant amounts of chloride in water resources, and thus affect their overall quality. Water with high levels of chloride, total hardness and sulfate may intensify the scaling and corrosion of water distribution system pipes, and similarly water with high levels of sodium and alkalinity may be accompanied by more sodium absorption and more alkaline corrosion. The presence of these factors can significantly affect whether the water quality is acceptable for different purposes including domestic and industrial uses. Fluoride, nitrate, nitrite, pH, potassium, calcium, and magnesium are grouped together in a single cluster. Although the correlation matrix does not indicate a strong direct relationship between fluoride and the other ions, their grouping in the HCA suggests that they may have overlapping geochemical origins or processes. This can arise from the dissolution of fluoride-containing minerals in the region and agriculture activity or possible seawater intrusion from nearby coastal areas.42,43ANN approach for the prediction of F
The nnet function from the nnet package was used to train the ANN model with F as the dependent variable and EC, pH, TH, TDS, HCO3, Ca, Mg, NO2, NO3, SO4, Cl, K and Na as independent variables. The number of neurons in the hidden layer of the neural network was determined by setting the size parameter to 20. To prevent overfitting of the model, the decay parameter was set to 0.10 and the max parameter was set to 1![[thin space (1/6-em)]](https://www.rsc.org/images/entities/char_2009.gif) 000
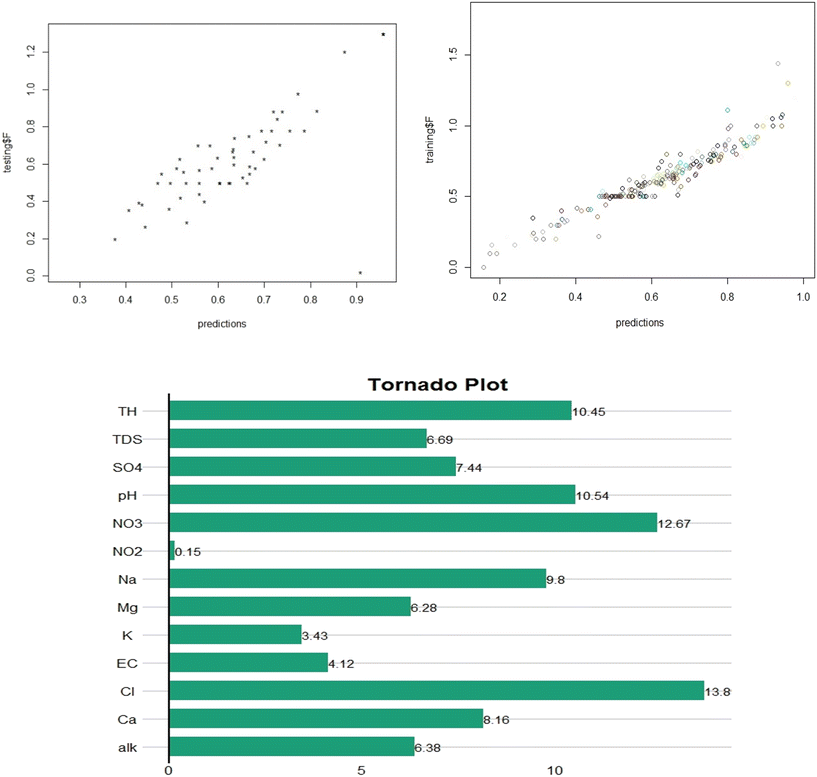
000![[thin space (1/6-em)]](https://www.rsc.org/images/entities/char_2009.gif) 000, limiting the maximum number of iterations during the training process. The predict function was used with the new data parameter set for the testing and training data to obtain the predicted F concentrations. The performance of the model was assessed using the R-squared value, indicating how well the model fits the data. The R2 value was 0.85, indicating that the model performed well in predicting the F concentration based on the physicochemical parameters used in the study. The R2 value for the testing set was 0.78, further indicating the acceptable performance. To assess the impact of different input parameters on the accuracy of the artificial neural network (ANN) model for predicting the water F concentration, sensitivity analysis was performed. The outcome, as illustrated in Fig. 7, highlights that Cl, NO3, and TH exhibit the greatest influence as independent variables in determining the significance of F concentration in water. The presence of chloride, nitrate, and total hardness in groundwater can affect the prediction of the fluoride levels for several reasons. The presence of chloride, nitrate, and total hardness in underground water near the sea may be indicative of certain geochemical interactions that affect the behavior of fluoride in the water. High levels of total hardness can lead to the precipitation of fluoride as calcium fluoride, which can lower the concentration of fluoride in the water. Similarly, high levels of nitrate can promote the growth of bacteria that convert fluoride to a less soluble form. Chloride and nitrate are often associated with anthropogenic (human-caused) contamination, such as agricultural or industrial activities. If the fluoride in the underground water near the sea is also due to anthropogenic sources, then the presence of chloride and nitrate can be indicative of the same source of contamination.
000, limiting the maximum number of iterations during the training process. The predict function was used with the new data parameter set for the testing and training data to obtain the predicted F concentrations. The performance of the model was assessed using the R-squared value, indicating how well the model fits the data. The R2 value was 0.85, indicating that the model performed well in predicting the F concentration based on the physicochemical parameters used in the study. The R2 value for the testing set was 0.78, further indicating the acceptable performance. To assess the impact of different input parameters on the accuracy of the artificial neural network (ANN) model for predicting the water F concentration, sensitivity analysis was performed. The outcome, as illustrated in Fig. 7, highlights that Cl, NO3, and TH exhibit the greatest influence as independent variables in determining the significance of F concentration in water. The presence of chloride, nitrate, and total hardness in groundwater can affect the prediction of the fluoride levels for several reasons. The presence of chloride, nitrate, and total hardness in underground water near the sea may be indicative of certain geochemical interactions that affect the behavior of fluoride in the water. High levels of total hardness can lead to the precipitation of fluoride as calcium fluoride, which can lower the concentration of fluoride in the water. Similarly, high levels of nitrate can promote the growth of bacteria that convert fluoride to a less soluble form. Chloride and nitrate are often associated with anthropogenic (human-caused) contamination, such as agricultural or industrial activities. If the fluoride in the underground water near the sea is also due to anthropogenic sources, then the presence of chloride and nitrate can be indicative of the same source of contamination.
Health risk assessment of nitrate, nitrite, and fluoride
Although the results show that the concentrations of nitrate and nitrite in the drinking water are less than the WHO suggested limits, these amounts can still cause adverse health effects in children and infants. The estimated minimum, maximum and average chronic daily intake (CDI) and hazard quotient (HQ) values for nitrate, nitrite and fluoride in potable water from Minab County for all the age groups (infants, children, teenagers and adults) were determined. The chronic daily intake (CDI) for absorbed nitrate and nitrite for the child group were higher than that for the other groups and 0.4207 and 0.0017 mg/kg/day, respectively. The average HQ value of nitrate for infants, children, teenagers and adults in the investigated area was 0.0037, 0.2629, 0.1856 and 0.1487, respectively. The highest HQ was in the child age group who are more exposed to non-carcinogenic health risks. In fact, the HQ value in 2.14% of the samples (6 samples) was higher than HQ of 1. When the amount of nitrate HQ is higher than 1, the concerns about the non-carcinogenicity risk increase. Therefore, children living in this area are potentially exposed to non-carcinogenic risks associated with nitrates. According to Table 3, the maximum and average amount of nitrite observed in the samples was lower than the recommended standard by the WHO. Thus, considering the presence of small amounts of nitrite in the samples, the average HQ index of nitrite for infants, children, teenagers and adults can be ignored in this study.| Statistics | CDI nitrate | CDI nitrite | CDI fluoride | |||||||||
|---|---|---|---|---|---|---|---|---|---|---|---|---|
| Infant | Children | Teenagers | Adults | Infant | Children | Teenagers | Adults | Infant | Children | Teenagers | Adults | |
| Min | 0.0000 | 0.000 | 0.000 | 0.000 | 0.000 | 0.000 | 0.000 | 0.000 | 0.000 | 0.000 | 0.000 | 0.000 |
| Mean | 0.0059 | 0.420 | 0.296 | 0.237 | 0.0002 | 0.0017 | 0.0012 | 0.0009 | 0.005 | 0.035 | 0.025 | 0.020 |
| Max | 0.0293 | 2.079 | 1.468 | 1.1762 | 0.002 | 0.0141 | 0.01 | 0.008 | 0.0144 | 0.102 | 0.072 | 0.0576 |
| Statistics | HQ nitrate | HQ nitrite | HQ fluoride | |||||||||
|---|---|---|---|---|---|---|---|---|---|---|---|---|
| Infant | Children | Teenagers | Adults | Infant | Children | Teenagers | Adults | Infant | Children | Teenagers | Adults | |
| Mean | 0.004 | 0.263 | 0.186 | 0.149 | 0.002 | 0.011 | 0.008 | 0.006 | 0.084 | 0.600 | 0.423 | 0.339 |
Of course, among the age groups, children are more exposed to non-carcinogenic health risks with nitrite than the other groups. The average amount of chronic daily intake (CDI) and HQ for fluoride for the age groups of infants, children, teenagers and adults was 0.0050, 0.036, 0.0253, 0.020 mg/kg/day and 0.084, 0.600, 0.423 and 0.339, respectively. In the age groups of infants, teenagers and adults, the HQ values were <1 and in the child group, the HQ values were >1. Thus, children potentially face non-carcinogenic risks from fluoride, but subsequently skeletal and dental fluorosis as potential health risks.
Calculation of non-carcinogenic hazard index
The average results of the hazard index (HI) for the non-carcinogenic risks for adults, teenagers, children and infants are presented in Table 4. The HI values ranged from 0.000 to 1.209 with an average of 0.494 for adults and 0.000 to 2.137 with the average of 0.873 for children. The results indicate that a higher non-carcinogenic risk belongs to the child group. The average HI value for nitrate in this region was lower than 1 for all age groups.| Statistics | HI = HQNitrate + HQNitrite + HQFluoride | |||
|---|---|---|---|---|
| Infant | Children | Teenagers | Adults | |
| Min | 0.000 | 0.000 | 0.000 | 0.000 |
| Mean | 0.090 | 0.873 | 0.617 | 0.494 |
| Max | 0.242 | 2.137 | 1.508 | 1.209 |
Also, a probabilistic approach using the Monte Carlo technique was applied to check the uncertainty for the hazard index.
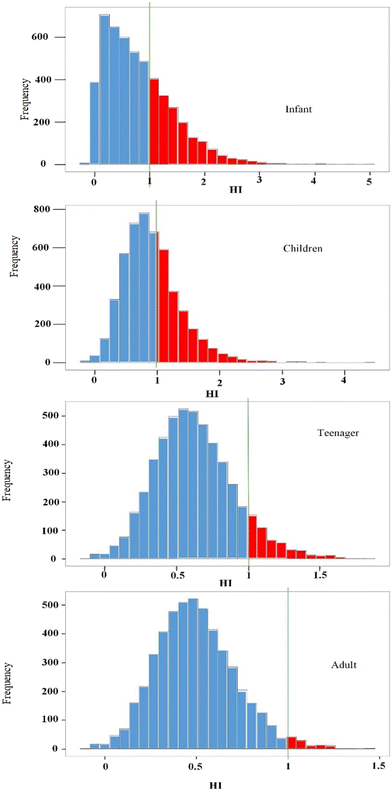
Fig. 8 illustrates the results of the hazard index from the Monte Carlo simulation. As shown, when the HI value is below 1 for the adult age group at a 98% certainty level, it is also below 1 at the 90%, 64% and 64% certainty level for the teenager, child and infant groups, respectively. With an increase in the certainty level, the amount of risk decreases. In addition, the hazard index values at the 95th confidence percentile for infants, children, adolescents and adults were 1.98, 1.74, 0.87 and 1.10, respectively. Therefore, considering the results, exposure to elevated levels of nitrate and fluoride in drinking water may pose a threat to the health of infants, children, and adults, respectively.
Sobel sensitivity analysis for input parameters in HQ measurement
The Sobol sensitivity analysis was applied to evaluate the attributed input parameters in calculating the non-carcinogenic risk for the study population exposed to nitrate, nitrite, and fluoride in potable water. Fig. 9 indicates the total (ST) and first-order sensitivity (S1) indices for the different input parameters in the hazard quotient (HQ) model. The results of S1 and ST showed that in infants, the parameter of water intake rate was equal to 0.542, and in children, teenagers and adults, the nitrate concentration was equal to 0.302, 0.401 and 0.413, respectively, which were the sensitive input parameters in the HQ model. Also, the order of sensitive parameters for children after nitrate concentration were fluoride concentration (0.265), body weight (0.215), and drinking water intake rate (0.154). Also, this order in infants after the amount of water intake rate was nitrate concentration (0.127), fluoride concentration (0.112) and body weight (0.091). The total sensitivity index in infants was equal to the water intake rate (0.656) > nitrate concentration (0.179) > fluoride concentration (0.157) > body weight (0.138) > nitrite concentration (0.000), respectively. Also, this index in children, teenagers and adults was related to the nitrate concentration, which was reported to be (0.331), (0.428) and (0.418), respectively. Considering that the first-order sensitivity index is lower than the total sensitivity index, the second-order sensitivity index, which shows the synergistic effect of the parameters, was investigated, as shown in Fig. 6. According to the results, the interaction of the input parameters in the sensitivity analysis follows the order of IR-NO3 > IR-F > BW-NO3 = F-BW for infants, where the interaction of nitrate with the amount of water intake rate is higher, which follows the order of BW-NO3 = BW-F > IR-NO3 > IR-F for children, F-IR > NO3-IR > NO3-BW > F-BW for teenagers and IR-NO3 = IR-F > BW-NO3 = BW-F for adults.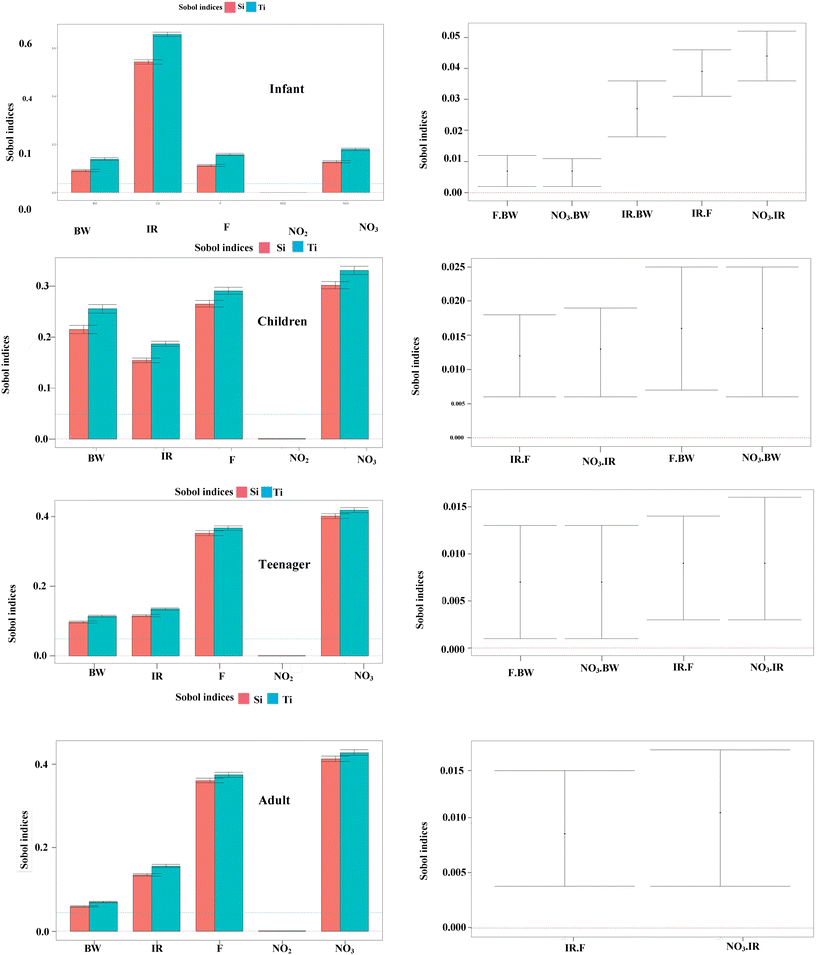 | ||
| Fig. 9 Sensitivity analysis for four age groups based on first-order effect (Si), total effect (Ti) and pairwise interactions. | ||
Conclusion
In a comprehensive study of drinking water quality in Minab County, we evaluated the potential health risks linked to the nitrate, nitrite, and fluoride levels. The findings revealed that all the contaminant levels were compliant with the WHO guidelines. The predominant water compositions detected were Na–K–HCO3 and Na–K–Cl. The artificial neural network model highlighted the significance of chloride, NO3, and TH in predicting the fluoride concentration. When assessing water quality, both the deterministic and Monte Carlo probabilistic methods categorized the majority of water samples as good to excellent. The health risk assessments based on the hazard quotient (HQ) and hazard index (HI) indicated low non-carcinogenic risks across all age groups, although children and infants emerged as the most vulnerable groups. The sensitivity analyses pinpointed the water intake rate in infants and nitrate concentration in older age groups as key determinants of risk. This study revealed a non-carcinogenic risk from fluoride in drinking water, with children being the most vulnerable, followed by adolescents and adults. Thus, the continuous monitoring and regulation of fluoride levels are essential, necessitating advanced treatment methods such as ion exchange, active adsorption, and membrane processes to mitigate their risks and benefit dental health. Additionally, the elevated TDS levels in the region's drinking water surpass the standard limits, suggesting the need for membrane processes and reverse osmosis for standardization.Conflicts of interest
The authors declare no competing interests.References
- N. Adimalla and P. Li, Occurrence, health risks, and geochemical mechanisms of fluoride and nitrate in groundwater of the rock-dominant semi-arid region, Telangana State, India, Hum. Ecol. Risk Assess., 2019, 25, 81–103 CrossRef CAS.
- A. Talema, Causes, negative effects, and preventive methods of water pollution in Ethiopia, Qual. Assur. Saf. Crops Foods, 2023, 15, 129–139 CrossRef CAS.
- E. Aşkan, Y. Topcu and A. N. Şahin, Determining consumption preferences of consumers considering quality attributes of drinking water: case of Iğdır, Ital. J. Food Sci., 2021, 33, 156–165 Search PubMed.
- S. Tong, H. Li, M. Tudi, X. Yuan and L. Yang, Comparison of characteristics, water quality and health risk assessment of trace elements in surface water and groundwater in China, Ecotoxicol. Environ. Saf., 2021, 219, 112283 CrossRef CAS PubMed.
- S. Ali, Y. Fakhri, M. Golbini, S. K. Thakur, A. Alinejad, I. Parseh, S. Shekhar and P. Bhattacharya, Concentration of fluoride in groundwater of India: A systematic review, meta-analysis and risk assessment, Groundw. Sustain. Dev., 2019, 9, 10024 Search PubMed.
- M. Lewoyehu, Evaluation of drinking water quality in rural area of Amhara region, Ethiopia: the case of Mecha district, J. Chem., 2021, 2021, 1–11 CrossRef.
- A. Azizullah, M. N. K. Khattak, P. Richter and D.-P. Häder, Water pollution in Pakistan and its impact on public health—a review, Environ. Int., 2011, 37, 479–497 CrossRef CAS PubMed.
- World Health Organization, Guidelines for drinking-water quality, World Health Organization, 2004, vol. 1 Search PubMed.
- C. O. Akinbile and O. Omoniyi, Quality assessment and classification of Ogbese river using water quality index (WQI) tool, Sustain. Water Resour. Manag., 2018, 4, 1023–1030 CrossRef.
- S. K. Kumar, A. Logeshkumaran, N. Magesh, P. S. Godson and N. Chandrasekar, Hydro-geochemistry and application of water quality index (WQI) for groundwater quality assessment, Anna Nagar, part of Chennai City, Tamil Nadu, India, Appl. Water Sci., 2015, 5, 335–343 CrossRef.
- M. Mokarram, H. R. Pourghasemi, K. Huang and H. Zhang, Investigation of water quality and its spatial distribution in the Kor River basin, Fars province, Iran, Environ. Res., 2022, 204, 112294 CrossRef CAS PubMed.
- M. Golaki, A. Azhdarpoor, A. Mohamadpour, Z. Derakhshan and G. O. Conti, Health risk assessment and spatial distribution of nitrate, nitrite, fluoride, and coliform contaminants in drinking water resources of kazerun, Iran, Environ. Res., 2022, 203, 111850 CrossRef CAS PubMed.
- J. Chen, H. Wu, H. Qian and Y. Gao, Assessing nitrate and fluoride contaminants in drinking water and their health risk of rural residents living in a semiarid region of Northwest China, Exposure Health, 2017, 9, 183–195 CrossRef CAS.
- A. Mohammadpour, E. Gharehchahi, M. R. Narooie, Z. Derakhshan, A. Aliyeva and A. M. Khaneghah, Nitrates in industrial and traditional tomato paste from Arsenjan City, Iran: a health risk assessment study, Int. J. Environ. Health Res., 2023, 1–14 CrossRef PubMed.
- N. S. Rao, Groundwater quality: focus on fluoride concentration in rural parts of Guntur district, Andhra Pradesh, India, Hydrol. Sci. J., 2003, 48, 835–847 CrossRef CAS.
- N. Adimalla, Groundwater quality for drinking and irrigation purposes and potential health risks assessment: a case study from semi-arid region of South India, Exposure Health, 2019, 11, 109–123 CrossRef CAS.
- J. Chen, Y. Gao, H. Qian, W. Ren and W. Qu, Hydrogeochemical evidence for fluoride behavior in groundwater and the associated risk to human health for a large irrigation plain in the Yellow River Basin, Sci. Total Environ., 2021, 800, 1494 Search PubMed.
- N. Adimalla and H. Qian, Hydrogeochemistry and fluoride contamination in the hard rock terrain of central Telangana, India: analyses of its spatial distribution and health risk, SN Appl. Sci., 2019, 1, 1–12 Search PubMed.
- S. Muhammad, M. T. Shah and S. Khan, Health risk assessment of heavy metals and their source apportionment in drinking water of Kohistan region, northern Pakistan, Microchem. J., 2011, 98(2), 334–343 CrossRef CAS.
- A. Jamshidi, M. Morovati, M. M. G. Mofrad, M. Panahandeh, H. Soleimani and H. A. Alamdari, Water quality evaluation and non-cariogenic risk assessment of exposure to nitrate in groundwater resources of Kamyaran, Iran: spatial distribution, Monte-Carlo simulation, and sensitivity analysis, J. Environ. Health Sci. Eng., 2021, 19, 1117–1131 CrossRef CAS PubMed.
- S. Rajabi, M. R. Zarei, A. Karamoozian, A. Mohammadpour and A. Azhdarpoor, Sobol sensitivity analysis for non-carcinogenic health risk assessment and water quality index for Kohgiluyeh and Boyer-Ahmad Province, Western Iran, Arabian J. Chem., 2022, 15, 104342 CrossRef CAS.
- X. Su, H. Wang and Y. Zhang, Health risk assessment of nitrate contamination in groundwater: a case study of an agricultural area in Northeast China, Water Resour. Manag., 2013, 27, 3025–3034 CrossRef.
- A. Logeshkumaran, N. Magesh, P. S. Godson and N. Chandrasekar, Hydro-geochemistry and application of water quality index (WQI) for groundwater quality assessment, Anna Nagar, part of Chennai City, Tamil Nadu, India, Appl. Water Sci., 2015, 5, 335–343 CrossRef.
- US EPA, EPA Integrated Risk Information System (IRIS) electronic database, US Environmental Protection Agency, Washington, DC, 1996 Search PubMed.
- P. Chowdhury, B. P. Mukhopadhyay, S. Nayak and A. Bera, Hydro-chemical characterization of groundwater and evaluation of health risk assessment for fluoride contamination areas in the eastern blocks of Purulia district, India, Environ. Dev. Sustain., 2021, 1–28 Search PubMed.
- M. O. Dinka, W. Loiskandl and J. M. Ndambuki, Hydrochemical characterization of various surface water and groundwater resources available in Matahara areas, Fantalle Woreda of Oromiya region, J. Hydrol. Reg. Stud., 2015, 3, 444–456 CrossRef.
- L. Gao, X. Huang, P. Wang, Z. Chen, Q. Hao, S. Bai and D. Qin, Concentrations and health risk assessment of 24 residual heavy metals in Chinese mitten crab (Eriocheir sinensis), Qual. Assur. Saf. Crops Foods, 2022, 14, 82–91 CrossRef CAS.
- G. Nie, T. Tu, L. Hu, L. Wu and Y. Zhou, Accumulation characteristics and evaluation of heavy metals in soils and vegetables of plastic-covered sheds in typical red soil areas of China, Qual. Assur. Saf. Crops Foods, 2023, 15, 22–35 CrossRef CAS.
- C. Luo, J. Sun, Y. Tan, L. Xiong, B. Peng, G. Peng and X. Bai, Comparison of the health risks associated with exposure to toxic metals and metalloids following consumption of freshwater catches in China, Qual. Assur. Saf. Crops Foods, 2022, 14, 1–12 CrossRef CAS.
- S. Cai, B. Zeng and C. Li, Potential health risk assessment of metals in the muscle of seven wild fish species from the Wujiangdu reservoir, China, Qual. Assur. Saf. Crops Foods, 2023, 15, 73–83 CrossRef CAS.
- C. Laar, T. Akiti, A. Brimah, J. Fianko, S. Osae and J. Osei, Hydrochemistry and isotopic composition of the Sakumo Ramsar site, Res. J. Environ. Sci., 2011, 3, 146–152 Search PubMed.
- H. Xiao-Mei, Y. Jin, L. Chao, F. Xiao-Jun and Z. Yuan, Analysis of hydrochemical characteristics and genesis of water-deficient rivers in China: a case study of the Ciyao River Basin in Shanxi Province, Qual. Assur. Saf. Crops Foods, 2023, 15, 32–43 CrossRef.
- J. Chen, H. Qian, Y. Gao, H. Wang and M. Zhang, Insights into hydrological and hydrochemical processes in response to water replenishment for lakes in arid regions, J. Hydrol., 2020, 581, 124386 CrossRef CAS.
- F. J. He and G. A. MacGregor, Beneficial effects of potassium on human health, Physiol. Plant., 2008, 133, 725–735 CrossRef CAS PubMed.
- A. Nikanorov and L. Brazhnikova, Water chemical composition of rivers, lakes and wetlands, Types and properties of water, 2009, vol. 2, pp. 42–80 Search PubMed.
- B. Pradhan and S. Pirasteh, Hydro-chemical analysis of the ground water of the basaltic catchments: upper Bhatsai region, Maharastra, Open Hydrol. J., 2011, 5, 51–57 CrossRef CAS.
- M. Vidal, J. Melgar, A. Lopez and M. Santoalla, Spatial and temporal hydrochemical changes in groundwater under the contaminating effects of fertilizers and wastewater, J. Environ. Manage., 2000, 60, 215–225 CrossRef.
- D. Reddy, P. Nagabhushanam and E. Peters, Village environs as source of nitrate contamination in groundwater: a case study in basaltic geo-environment in central India, Environ. Monit. Assess., 2011, 174, 481–492 CrossRef CAS PubMed.
- Z. Pang, L. Yuan, T. Huang, Y. Kong, J. Liu and Y. Li, Impacts of human activities on the occurrence of groundwater nitrate in an alluvial plain: a multiple isotopic tracers approach, Int. J. Earth Sci., 2013, 24, 111–124 CAS.
- S. Y. Ganyaglo, A. Gibrilla, E. M. Teye, E. D.-G. J. Owusu-Ansah, S. Tettey, P. Y. Diabene and S. Asimah, Groundwater fluoride contamination and probabilistic health risk assessment in fluoride endemic areas of the Upper East Region, Ghana, Chemosphere, 2019, 233, 862–872 CrossRef CAS PubMed.
- A. Alver, Evaluation of conventional drinking water treatment plant efficiency according to water quality index and health risk assessment, Environ. Sci. Pollut. Res., 2019, 26, 27225–27238 CrossRef CAS PubMed.
- J. B. Meimandi, O. Bazrafshan, Y. Esmaelpour, M. Shekari and H. Zamani, Study the Effect of Natural and Anthropogenic Factors on The Ground Water Falling in The Minab Plain, Desert Management, 2023, 11, 1–18 Search PubMed.
- A. Zakernasab and A. Afsharipoori, Prioritize the of Agricultural Conversion Industries in Rural Areas of the Central District of Minab County, Space Economy & Rural Development, 2021, 10, 113–128 Search PubMed.
Footnote |
| † Electronic supplementary information (ESI) available. See DOI: https://doi.org/10.1039/d3ew00525a |
| This journal is © The Royal Society of Chemistry 2024 |

