DOI:
10.1039/D0RA01787F
(Paper)
RSC Adv., 2020,
10, 17627-17634
Elimination of humic acid in water: comparison of UV/PDS and UV/PMS†
Received
25th February 2020
, Accepted 20th April 2020
First published on 6th May 2020
Abstract
Humic substances are polyelectrolytic macromolecules; their presence in water leads to many environmental problems without effective treatment. In this work, the elimination of humic acid (HA), a typical humic substance, has been examined through ultraviolet (UV) activation systems in the presence of peroxydisulfate (PDS) and peroxymonosulfate (PMS), respectively. The results indicated that 92.9% and 97.1% of HA were eliminated with rate constants of 0.0328 ± 0.0006 and 0.0436 ± 0.0011 min−1 with 180 and 60 min treatment times at pH 6 and 3 when adding 3 and 1 mmol L−1 oxidant during UV/PDS and UV/PMS, respectively; the corresponding electric energies per order were 0.0287 and 0.0131 kW h m−3. The HA removal was systematically investigated by varying different reaction parameters, including radical scavengers, persulphate dose, solution pH, and initial HA concentration, and by addition of various common ions. Moreover, the decomposition details were identified through the changes in the dissolved organic carbon, unique UV absorbances, and UV spectroscopic ratios. Furthermore, the destruction mechanism was verified by fluorescence spectroscopy, demonstrating that the HA structure was decomposed to small molecular fractions in the two UV/persulphate systems. In addition, the purification of HA by the two UV/persulphate processes was assessed in actual water matrices.
1. Introduction
Humic acid (HA), a humic substance, is detectable in most environmental media, such as water, soil and sediment.1 HA is a polyelectrolytic macromolecule with a large molecular weight; it originates from the polymerization of various biological residues during a long period.2 HA causes unfavorable color changes in water, including yellow, brown, and black.3 Additionally, many organic functional groups of HA can connect with diverse organic and inorganic matter; thus, HA is difficult to remove from the environment.4 For example, the chelation of humic acid with heavy metal ions such as Cu2+, Hg2+, and Pb2+ will result in enhanced toxicity.5 Moreover, HA can generate a few disinfection byproducts during the chlorination of drinking water.6 To address these health and environmental problems, eliminating HA from water bodies is a significant research topic.
To control HA in aqueous solution, various advanced oxidation technologies (AOTs) have been widely attempted, including Fenton oxidation,7,8 ultraviolet (UV)-photolysis,9,10 and catalytic ozonation.11 All these technologies depend on the function of the formed hydroxyl radical (·OH);12 however, the lifetime of ·OH is short (<10−4 s),13,14 so ·OH-based AOTs still have much room for improvement. Recently, sulfate radical (SO4˙−)-based oxidation as a newly developing AOT has been extensively researched by numerous researchers.15,16 SO4˙− radical is generated from the activation of peroxydisulfate (PDS) and peroxymonosulfate (PMS).17,18 Specifically, SO4˙− has a stronger oxidation capacity (2.5–3.1 V), which is greater than that of ·OH (1.8–2.7 V), and it has a longer lifetime (3–4 × 10⁻⁵ s) than ·OH.19 Therefore, SO4˙− is more stable, selective, and adaptive for refractory organic removal in wastewater treatment.20 SO4˙− is widely employed to decontaminate many emerging pollutants in water, such as natural organic matter,21,22 neonicotinoid insecticides,23,24 typical herbicides,25,26 and personal care products.27,28
Current research about SO4˙−-based oxidation mainly focuses on diverse methods of activating persulphate. The usual activation methods include UV,29 heat,30 carbonaceous materials,31 metal oxides,32 and base.33 However, thermal activation requires heating of the wastewater to over 50 °C, leading to a large amount of energy consumption. The activation efficiency of carbonaceous materials is relatively low, and their surfaces are deactivated under strong acidic conditions. Some metal cations are released into water, easily causing heavy metal pollution during metal oxide activation. Base activation is required to adjust the pH to neutral conditions, and this method usually requires coupling with other methods. Particularly, UV activation is often used due to its low pollution, low energy consumption, and ease of application. Therefore, UV activation of persulphate can be conveniently applied to degrade most organic targets in water. Additionally, PDS and PMS have diverse structures; PDS is a symmetrical molecule, and PMS is an asymmetric molecule. Furthermore, the activation mechanisms of the two persulphates are different. Although there are a few studies about UV activation of PDS for natural organic matter and HA removal,34 research about UV activation of PMS for HA decomposition is rare. Moreover, few papers have been reported that systematically compare the performance of UV/PDS and UV/PMS in HA elimination, which is the innovation of this paper.
In this work, the UV/PDS and UV/PMS processes were respectively applied to eliminate HA from aqueous solution. The objectives of the comparative study are as follows: (1) examine the HA removal of the two UV/persulphate synergistic systems; (2) investigate the effects of the test parameters on the HA decomposition; (3) illustrate the function of the reactive species that are responsible for the HA decontamination; (4) study the HA elimination behavior and mechanisms based on determinations of the dissolved organic carbon (DOC), specific UV absorbance values (SUVAx), UV spectroscopic ratios, and three-dimensional excitation-emission matrices (3D-EEM); and (5) explore the potential capability of HA removal in real water matrices (Table 1).
Table 1 List of abbreviations
| Symbol |
Definition |
SI Unit |
| HA |
Humic acid |
mmol L−1 |
| UV |
Ultraviolet |
|
| PDS |
Peroxydisulfate |
mmol L−1 |
| PMS |
Peroxymonosulfate |
mmol L−1 |
| H2O2 |
Hydrogen peroxide |
mmol L−1 |
| SO4˙− |
Sulfate radicals |
|
| ·OH |
Hydroxyl radicals |
|
| EE/O |
Electric energy per order |
kW h m−3 |
| k |
Reaction rate constant |
min−1 |
| DOC |
Dissolved organic carbon |
mg L−1 |
| SUVA |
Specific UV absorbance values |
a.u. L mg−1 |
| 3D-EEM |
Three-dimensional excitation-emission matrix |
|
| Ax |
Specific absorption at one wavelength |
|
| TBA |
Tert-butyl alcohol |
mol L−1 |
| EtOH |
Ethanol |
mol L−1 |
2. Materials and methods
2.1 Chemicals
Commercial HA was obtained from Aladdin Reagent Corporation, China; it consisted of 58.3% C, 4.2% H, and 36.1% O, and its mean molecular mass was 2485 Da. The contents of the total acidic, carboxylic and phenolic groups of the HA are 5.92, 2.62, and 3.58 mmol g−1, respectively. Potassium peroxydisulfate, PMS (KHSO5·0.5KHSO4·0.5K2SO4), and hydrogen peroxide were supplied by Tianjin Kemiou Reagent Corporation, China. Other analytical reagents, such as TBA, EtOH, potassium iodide, sodium hydroxide, sulfuric acid, sodium hydrogen carbonate, sodium sulfate, sodium nitrate, potassium phosphate monobasic, sodium carbonate, and sodium chloride, were supplied through Tianjin Chemical Institute, China. The solutions used in this study were prepared with deionized water.
2.2 Experimental procedures
A 100 mL beaker was used for the reactor under a UV lamp (power 16 W, wavelength 254 nm, philips Company, China). The distance between the lamp and beaker was 3 cm. A preset concentration of HA solution was prepared, and an appropriate weight of PDS or PMS was introduced into the beaker rapidly before the reaction process began. The beaker was placed on a magnetic stirrer (CJJ78-1, Shanghai Instrument Co., China) at room temperature. Then, 1 mL solution was drawn and transferred into a colorimetric tube to measure the absorbance and calculate the remaining concentration of HA. Each experiment was repeated three times. The solution pH was regulated by 0.1 mol L−1 NaOH and 0.1 mol L−1 H2SO4.
2.3 Analyses
The concentration of HA was measured using a spectroscopy instrument (SP-752, Shanghai Spectrum, China) at the wavelength of 254 nm. The concentrations of PDS and PMS were measured by the modified iodometric method.35,36 The DOC of the HA samples was detected by a total organic carbon analyzer (TOC-V, Shimadzu, Japan). The SUVAx (a.u. L mg−1) was computed by the following formula:37,38| |
 | (1) |
where Ax is the specific absorption at one wavelength. A 3D-EEM fluorescence spectrophotometer (FL4500, Hitachi, Japan) was applied to investigate the HA decomposition process. The wavelengths of emission and excitation were set at 200 to 800 nm and 200 to 450 nm, respectively. The corresponding spectrum slits were fixed at 10 and 5 nm, respectively. The integral and mean times were regulated at 500 and 10 ms, respectively. The method of EE/O calculation was introduced in paragraph S1 of the ESI.†
3. Results and discussion
3.1 HA elimination in UV/PDS and UV/PMS
Fig. 1 illustrates the HA removal effects of the UV/PDS and UV/PMS systems. The oxidations of PDS and PMS in dark conditions and with UV irradiation alone were implemented as the control tests. The HA removal was only 2.3% during UV irradiation after 180 min, and only 0.8% and 6.3% HA were eliminated in the inactivated PDS and PMS systems with 3 mmol L−1 oxidant, respectively. These results indicate that there was almost no HA degradation in the three sole systems. HA has a high molecular weight and contains various functional groups;39,40 therefore, it is difficult to decompose it in the control experiments. For the coupling of PDS and UV, the HA elimination reached 92.9% after 180 min. However, the HA removal was enhanced to 97.1% in UV/PMS only after 60 min, manifesting that UV/PMS was more conducive to remove HA than UV/PDS. The above results prove that UV irradiation cam effectively excite persulphates to form strong redox radicals (SO4˙− and ·OH, eqn (2)–(4))41 and preferentially degrade HA in water. Additionally, the UV/H2O2 process was conducted as a contrasting test; the degradation ratio reached only 21.9% after 180 min treatment, which was far below than those of UV/PDS and UV/PMS.| |
 | (2) |
| |
 | (3) |
| | |
SO4˙− + ·OH → SO42− + ·OH
| (4) |
| |
 | (5) |
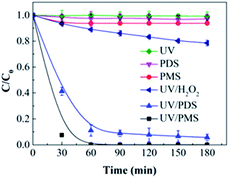 |
| | Fig. 1 HA elimination with the UV, PDS, PMS, UV/PDS, UV/PMS, and UV/H2O2 processes. Conditions: [HA]0 = 15 mg L−1, [PDS]0 = [PMS]0 = [H2O2]0 = 3 mmol L−1, pH0 = 6, 3, and 4 for UV/PDS, UV/PMS, and UV/H2O2, respectively. | |
The removal kinetics of HA by the UV/PDS and UV/PMS treatments were fitted by the first-order kinetics pattern, and the fitting results are depicted in Table 2. UV/PMS exhibited a higher rate constant (0.0436 min−1) than UV/PDS (0.0328 min−1). The higher efficiency and faster rate of HA removal in UV/PMS can be attributed to the influence of the acid–base properties of the solution. The values of pKa1 and pKa2 were 4 and 8 for HA, respectively.9,42 The initial pH value was 3 in the UV/PMS process; therefore, the HA existed in neutral form, which favors light absorption and the photochemical reaction and results in efficient decomposition. However, the starting pH of the PDS-added solution was 6; hence, the HA was negatively charged and had lower photochemistry activity, which is unfavorable for HA removal.
Table 2 Rate constants and economic comparison of UV/PDS and UV/PMS. Conditions: [HA]0 = 15 mg L−1, [PDS]0 = [PMS]0 = 3 mmol L−1, [pH]0 = 6 and 3 for UV/PDS and UV/PMS, respectively
| System |
UV/PS |
UV/PMS |
| K (min−1) |
0.0328 ± 0.0006 |
0.0436 ± 0.0011 |
| R2 |
0.98 |
0.97 |
| EE/O (kW h m−3) |
0.0287 |
0.0131 |
Fig. S1 in the ESI† shows the variations of the remaining concentrations of the two oxidants during the HA removal. It is clear that the amounts of PDS and PMS both declined with increasing treatment time, proving that the oxidants were indeed excited and transformed by disintegration to SO4˙− and ·OH under UV radiation (eqn (2)–(4)).
The economy of UV/PDS and UV/PMS was determined through calculating the electric energy per order (EE/O),43–45 and the results are listed in Table 2. The definition and calculation of EE/O are introduced in detail in paragraph S1 of the ESI.† According to the data in Table 2, the EE/O of UV/PMS (0.0131 kW h m−3) was lower than that of UV/PDS (0.0287 kW h m−3), indicating that the PMS process was more cost-effective than the PDS process.
3.2 Reaction parameters
3.2.1 Persulphate dose. Based on the previous results, UV/PMS is more efficient for HA removal than UV/PDS; therefore, the treatment time of UV/PMS was set at 60 min in the following reaction parameter investigation, and the added amount of PMS was lower than that of PDS in the cooperative systems. Fig. 2a and b show the impact of the oxidant dose on the elimination of HA in UV/PDS and UV/PMS, respectively. The PMS and PDS doses were 0.5–4 mmol L−1 and 1–10 mmol L−1, respectively. The corresponding removal rates are presented in Table S1 of the ESI.† With the increase of the two oxidants (PDS 0.5–4 mmol L−1 and PDS 1–6 mmol L−1), the HA degradation ratio and rate were both enhanced. This is because the organics degradation depends on the amounts of SO4˙− and ·OH. As the persulphate dosage augmented, the generated oxidative radicals increased, which is beneficial to HA elimination. Furthermore, as shown in Table S1,† the rate constants of UV/PMS were all higher than those of UV/PDS. This is because the PMS molecule is more unstable than PDS;46 therefore, PMS can easily be activated to form active substances, leading to faster HA removal. In addition, the masking impact of the PMS dose did not occur because the added amount was not in excess. However, for the UV/PDS system, the removal was obviously suppressed at the oxidant dosage of 10 mmol L−1. This may be because the excess PDS caused a side reaction between S2O82− and SO4˙− to scavenge SO4˙− radicals (eqn (6)); meanwhile, superfluous SO4˙− would cause the reverse reaction to form S2O82− again (eqn (6)),47 thus reducing the degradation effect.| | |
SO4˙− + S2O82– ↔ S2O8˙− + SO42−
| (6) |
| | |
SO4˙− + SO4˙− → S2O82–
| (7) |
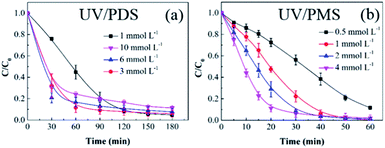 |
| | Fig. 2 Effects of the oxidant dose on HA removal in UV/PDS (a) and UV/PMS (b). Conditions: [HA]0 = 15 mg L−1, [PDS]0 = 1–10 mmol L−1, [PMS]0 = 0.5–4 mmol L−1, pH0 = 6 and 3 for UV/PDS and UV/PMS, respectively. | |
3.2.2 Initial HA concentration. The influences of the starting HA concentration on the HA decomposition during UV/PDS and UV/PMS are presented in Fig. 3a and b, respectively. The matching removal rate constants are listed in Table S2 of the ESI.† Similar to the previous results for the oxidant amount, the removal under UV/PMS was more rapid than that under UV/PDS. Additionally, as the initial HA amount increased, the HA decomposition ratio and rate both declined in the two coupling systems. The retardation of HA elimination can be ascribed to the following underlying causes. First, at a constant persulphate dose and UV intensity, the quantity of oxidative radicals will be definite. However, with increasing organic matter concentration, the HA and its degradation byproducts will compete for SO4˙− and ·OH.11,48 Second, with increasing HA addition, the UV irradiation will be more obstructed and absorbed by the HA molecules and their decomposition intermediates, inhibiting the activation of PDS and PMS.49 Third, HA is itself a scavenger of SO4˙− and ·OH; this, it will consume reactive radicals in increasing amounts.50,51 Thus, under the conditions of adequate oxidant, a higher HA concentration requires a longer period to reach the identical removal ratio. The above results are similar to those of many studies about organics removal by persulphate activation.52,53
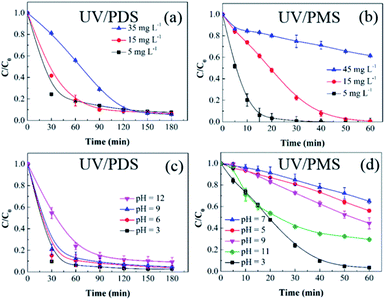 |
| | Fig. 3 Effects of the initial HA amount on HA removal in UV/PDS (a) and UV/PMS (b). Conditions: [HA]0 = 5–45 mg L−1, [PDS]0 = 3 mmol L−1, [PMS]0 = 1 mmol L−1, pH0 = 6 and 3 for UV/PDS and UV/PMS, respectively. Effects of the initial solution pH on HA removal in UV/PDS (c) and UV/PMS (d). Conditions: [HA]0 = 15 mg L−1, [PDS]0 = 3 mmol L−1, [PMS]0 = 1 mmol L−1, pH0 = 3–11. | |
3.2.3 Solution pH. In a persulphate oxidation simulation experiment, the pH decreased sharply to an acidic value after adding persulphate.54 However, in practical water bodies, the pH would remain in a relatively stable range. Therefore, to avoid the influence of the buffered solution, the aqueous pH was regulated through intermittently adding 1 mol L−1 NaOH and 0.1 mol L−1 H2SO4 throughout the reaction process. Fig. 3c and d display the HA removal results under various solution pH conditions. For the UV/PDS system, it was observed that the HA removal dropped slightly from 97.2% to 90.7% with increasing pH from 3 to 11. As shown in Table S3,† the corresponding change in the rate constant was in accordance with the degradation effect; it declined from 0.0408 min−1 at pH 3 to 0.0217 min−1 at pH 11. For the UV/PMS system, the highest HA elimination ratio reached 97.1% at pH 3, followed by pH 11, 9, 5, and 7 with 67.8%, 53.5%, 42.2%, and 33.8%, respectively. Due to the strong acidic and basic conditions in the PMS addition system, the NaOH addition frequency at pH 5, 7, and 9 was higher than at pH 3 and 11, which could impact the PMS activation and then decrease the oxidation efficiency of UV/PMS. As discussed in section 2.1, under strongly acidic conditions, the form of the HA molecule will be neutral, which is helpful to eliminate HA under UV irradiation. In addition, the H+ would enhance the generation of HS2O8− with decreasing pH (eqn (8)). Then, the increasing amount of HS2O8− can be readily decomposed to SO4˙− (eqn (9)), which is beneficial to the HA degradation.55 Especially for UV/PMS, when the pH was increased from 7 to 11, the augmented OH− concentration was beneficial to the PMS activation. Moreover, the molar absorption coefficient of PMS increased with increasing pH value. Therefore, the HA removal increased from 7 to 11 in UV/PMS. However, the main generated reactive species during the alkaline activation of PMS are ·OH, 1O2, and O2˙−; their oxidative abilities are weaker than that of SO4˙−, leading to a reduction in the oxidizing capacity of UV/PMS. Furthermore, the annihilation between SO4˙− and ·OH at alkali solution would exhaust the oxidation capability of the two UV-activated persulphate processes (eqn (10)).56| | |
S2O8˙2− + H+ → HS2O8−
| (8) |
| | |
HS2O8− → SO4˙− + SO42− + H+
| (9) |
3.3 Scavenger tests
SO4˙− and ·OH are both considered to be major reactive species during UV-activated persulphate processes; therefore, their contributions to the removal of HA were verified by radical quenching tests in the two UV/persulphate systems. Fig. 4 depicts the time-dependent degradation of HA after adding ethanol (EtOH) and tert-butyl alcohol (TBA) to the coupling systems, respectively. For the UV/PDS system (Fig. 4a), when the quantity of EtOH increased to 0.1 and 1.0 mol L−1, the HA removal ratio declined to 40% and 32%, respectively. Additionally, when the TBA amount was enhanced to 0.1 and 1.0 mol L−1, the elimination performance consistently declined to 77% and 49%, respectively (Fig. 3c). For the UV/PMS process, Fig. 4b and d exhibit similar inhibition trends with the PDS addition process; even the additions of the two scavengers were only half those added to the UV/PDS system (0.05–0.5 mol L−1 for EtOH and TBA in UV/PMS, respectively). When the amounts of EtOH and TBA were both enhanced to 0.5 mol L−1 in UV/PMS, the HA removal declined to 20.3% and 28.9%, respectively. It has been fully proven that the restraint of organic matter degradation in the UV-activated persulphate process can ne ascribed to the quenching influence on SO4˙− and ·OH radicals.57 EtOH has been widely used as a scavenger for both SO4˙− and ·OH (kEtOH, ·OH = 1.8–2.8 × 10⁹ M−1 s−1,  ).58 TBA also can be applied to quench the two radicals (kTBA, ·OH = 3.8–7.6 × 10⁸ M−1 s−1,
  ); however, its scavenging rate for ·OH is approximately three orders greater than that for SO4˙−.59 However, some other reactive species are generated in the homogeneous persulphate system, such as single oxygen (1O2) and superoxide anion (O2˙−).60 These cannot be quenched by EtOH and TBA; therefore, the HA removal was not inhibited completely under the high level of EtOH. Moreover, previous studies have suggested that SO4˙− is the primary radical in acidic conditions, while ·OH is the chief radical in alkali conditions.61 After addition of the two persulphates, the solution pH sharply decreased and became highly acidic, while the reaction continued without other adjustments. Hence, it can be deduced that SO4˙− is the major reactive species in acidic conditions, and ·OH is the auxiliary species for the HA oxidization during the two synergistic processes.
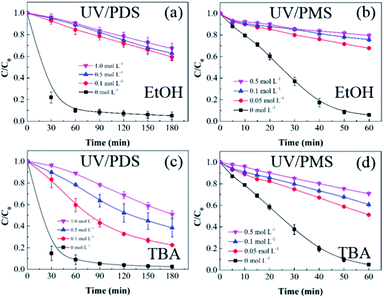 |
| | Fig. 4 Effects of radical scavengers on HA removal in UV/PDS (a and c) and UV/PMS (b and d). Conditions: [HA]0 = 15 mg L−1, [PDS]0 = 3 mmol L−1, [PMS]0 = 1 mmol L−1, pH0 = 6 and 3 for UV/PDS and UV/PMS, respectively. | |
3.4 HA mineralization
The transformations of the UV-Vis spectra for HA with treatment time in UV/PDS and UV/PMS are displayed in Fig. S4 of the ESI.† For the two synergy systems, the UV-Vis absorptions were both found to firmly decline with increasing reaction time. Additionally, four specific UV absorbance values (SUVA254, SUVA280, SUVA365, and SUVA436) were chosen to investigate the transformation of the molecular structure of HA during the two cooperative treatments, respectively. High SUVA254 and SUVA280 values indicate that the apparent molecular and hydrophobic structures are at high levels for organics.62 A large SUVA365 value suggests a larger molecular size of the organic molecule,9 and the SUVA436 value reflects the state of the chromophoric groups in organic matter.63 Fig. 5a and b show the variations of the various SUVAx values with treatment time in the two synergistic systems, respectively. As the reaction progressed, all the levels of SUVAx declined. This proves that the double bonds, chromophoric groups, and aromatic structures of the HA were destroyed, and its hydrophobicity and molecular mass also decreased during the two coupling processes. Generally, the HA transformation of SUVAx in the PDS-added system was higher than that with added PMS, which may be due to the longer treatment time in the PDS-added process. Moreover, the DOC concentration presented a declining trend over time, and the DOC removal efficiency of UV/PDS was superior to that of UV/PMS. These DOC elimination results also testified the above results of SUVAx changes on the other side.
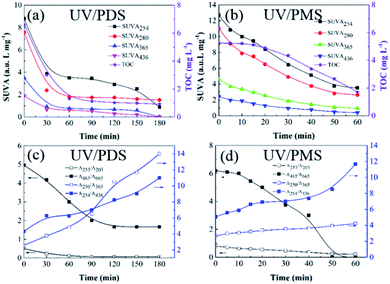 |
| | Fig. 5 Evolution of the SUVA and UV spectroscopic ratios during HA removal in UV/PDS (a and c) and UVPMS (b and d). Conditions: [HA]0 = 15 mg L−1, [PDS]0 = 3 mmol L−1, [PMS]0 = 1 mmol L−1, pH0 = 6 and 3 for UV/PDS and UV/PMS, respectively. | |
Moreover, a series of UV spectroscopic values (A253/A203, A250/A365, A254/A436, and A465/A665) were employed to investigate the transformations of the HA functional groups in the two synergistic systems. Normally, the A253/A203 value corresponds to the amount of substituent groups in aromatic rings, such as carbonyl, hydroxyl and carboxylic groups; the increase of A250/A365 indicates a reduction of the organic molecular mass, while the increase of A254/A436 manifests the decomposition of chromophores; the decrease of the A465/A665 ratio is attributed to a decline of the aromaticity of the organic matter.64,65 Fig. 5c and d present the evolutions of these UV absorption ratios during the two UV/persulphate processes, respectively. The changes in A253/A203 and A465/A665 both decrease over the reaction time in the two figures, which indicates that the functional groups of the HA molecules were broken during the two coupling processes. Specifically, the decreasing trend of A465/A665 for the PMS activation process was more rapid than that of the PDS activation system, suggesting that the reactive radicals generated in UV/PMS could more easily lead to a decline in aromaticity. The levels of A250/A365 and A254/A436 also both augmented with increasing reaction duration, demonstrating that the two UV-activated persulphate methods could effectively destroy the chromophoric groups and reduce the molecular weight of HA.
To clarify the HA mineralization mechanism during the UV/PDS and UV/PMS treatments in detail, the HA samples at different treatment intervals were determined by 3D-EEM fluorescence spectra (Fig. 6a–d for UV/PDS and Fig. 6e–h for UV/PMS). This fluorescence spectrum could be distributed in five areas; for instance, parts I and II are assigned to the fluorescence of aromatic proteins, region III is associated with fulvic-like fluorescence, area IV expresses the microbial byproduct fluorescence, and area V is classified as humic-like fluorescence.49,66 As can be seen in Fig. 6a and e, there was one major peak in the untreated HA sample that was predominately located in region V, indicating that the HA mainly contained the humic-like fluorophore. It was evident that the fluorescence strength disappeared gradually as the reaction progressed (Fig. 6b–d and f–h). After 180 and 60 min treatment of UV/PDS and UV/PMS, respectively, the humic-like fluorescence spectra both vanished completely, illustrating that the complex molecular structures of HA were entirely destroyed under the two coupling treatments. In addition, other minor peaks in regions I, II, and III all decreased gradually under the two UV irradiation treatments. However, the residual peaks of areas I to III for UV/PDS were more noticeable than those for UV/PMS, which manifested that small amounts of aromatic-like and fulvic-like substances were not destroyed completely and that many low molecular weight substances survived after the UV/PDS treatment. The above 3D-EEM results further prove the decomposition and mineralization of HA during the two synergistic processes.
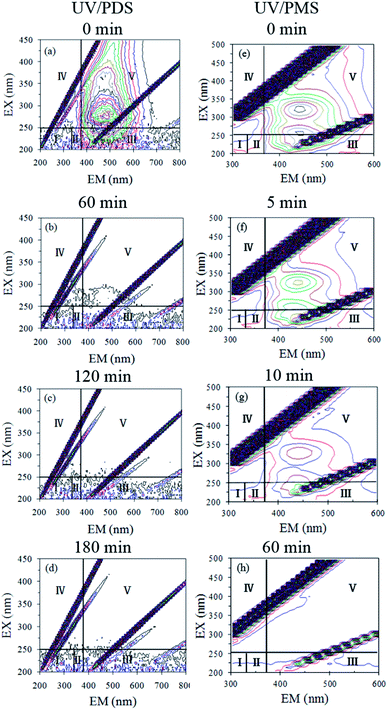 |
| | Fig. 6 3D-EEM spectra of HA at various reaction times in UV/PDS (a–d) and UV/PMS (e–h). Conditions: [HA]0 = 15 mg L−1, [PDS]0 = 3 mmol L−1, [PMS]0 = 1 mmol L−1, pH0 = 6 and 3 for UV/PDS and UV/PMS, respectively. | |
3.5 HA removal in different water sources
Various inorganic anions are common components of the water matrix and can impact organic decontamination in water bodies. The effects of anions on the HA elimination were investigated in UV/PDS and UV/PMS, respectively; the results are presented in paragraph S2, Fig. S2 and S3 of the ESI.† Diverse concentrations of CO32−, HCO3−, Cl−, NO3−, SO42−, and H2PO4− were introduced to the UV/persulphate systems, respectively. Overall, the anion addition tests proved that CO32, HCO3−, Cl−, and NO3− remarkably suppressed the HA removal in the two synergistic systems; SO42− showed almost no masking effect, while H2PO4− only inhibited the HA decontamination in UV/PMS.
To further evaluate the performance of UV/PDS and UV/PMS in actual water matrices, lake water was chosen as surface water for the investigation of HA elimination. The lake water was sampled from an artificial lake on our campus. Additionally, tap water was used to conduct a control experiment to illustrate the results. The initial TOC of the surface water was 7.862 mg L−1, and the initial TOC of tap water was 3.559 mg L−1. As shown in Fig. 7, the HA removals from the lake water and tap water were lower than those from deionized water using the two coupling processes, and the removal efficiency and rate of the added PMS were obviously suppressed compared to the added PDS in the surface and tap water samples. The higher concentrations of water constituents in the two real water samples would inhibit the HA decontamination performance. Additionally, based on the aforementioned results, the inhibition impact of various inorganic anions on the HA degradation was observed in the two coupling systems, and the influence of inorganic anions on UV/PMS was larger than that on UV/PDS. This can be ascribed to the lower addition of PMS (1 mmol L−1) and the shorter reaction duration (60 min) in UV/PMS. Therefore, to enhance the HA degradation in UV/PMS, a supplementary test was conducted with higher PMS addition (3 mmol L−1), and the results are displayed in Fig. S5 of the ESI.† When enough oxidant was introduced into the UV activation system, the HA removals in the surface and tap water samples improved to 89.2% and 92.8%, respectively. In addition, the removal rate in the surface water was slower than that in tap water for the two synergistic systems. This is because tap water is usually treated by precipitation, filtration, and other procedures, which removes many anions from the water; therefore, the suppression effect on the HA degradation was weaker than that in the surface water.
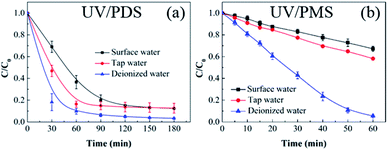 |
| | Fig. 7 HA removal from different water sources by UV/PDS (a) and UV/PMS (b). Conditions: [HA]0 = 15 mg L−1, [PDS]0 = 3 mmol L−1, [PMS]0 = 1 mmol L−1, pH0 = 3.0, 7.4, and 7.8 for deionized water, surface water, and tap water, respectively. | |
4. Conclusions
In this work, an effective UV-activated persulphate treatment for HA removal was determined by comparing UV/PDS and UV/PMS. The HA removal was fitted well by first-order kinetics in the experiments. The HA degradation efficiency and rate of UV/PMS were both higher than those of UV/PDS, and the calculation of EE/O indicated that the added PMS system was more cost-efficient than the added PDS process. The HA elimination in the two coupling systems was impacted by the reaction parameters, such as the concentration of added persulphate, solution pH, initial HA concentration, and common ions. Additionally, radical scavenger experiments demonstrated that SO4˙− and ·OH are both mainly responsible for HA removal in the UV/PDS and UV/PMS systems. Furthermore, the evolutions of the SUVAx and DOC values as well as the UV spectroscopic ratios manifested that the HA molecules were gradually decomposed and mineralized. The 3D-EEM fluorescence spectrum analysis confirmed that the HA was disintegrated into small molecular fractions during the two UV/persulphate processes. Lastly, the HA decomposition was tested and compared in the actual water matrices.
Conflicts of interest
There are no conflicts to declare.
Acknowledgements
The authors would like to acknowledge financial grants from the National Natural Science Foundation of China (Project No. 51908485 and 51608468), the China Postdoctoral Science Foundation (Project No. 2019T120194), and the University Science and Technology Program Project of Hebei Provincial Department of Education (Project No. QN2018258).
Notes and references
- K. Okawa, Y. Nakano, W. Nishijima and M. Okada, Chemosphere, 2004, 57, 1231–1235 CrossRef CAS PubMed.
- D. Gümüş and F. Akbal, Chemosphere, 2017, 174, 218–231 CrossRef PubMed.
- A. Zhang, W. Chen, Z. Gu, Q. Li and G. Shi, RSC Adv., 2018, 8, 33642–33651 RSC.
- B. Li, I. A. Udugama, S. S. Mansouri, W. Yu, S. Baroutian, K. V. Gernaey and B. R. Young, J. Cleaner Prod., 2019, 229, 1342–1354 CrossRef CAS.
- M. Zhang, J. Li, B. Li, H. Huang, N. Zhao and L. Cao, Sci. Total Environ., 2020, 714, 136839 CrossRef PubMed.
- C. Sarangapani, P. Lu, P. Behan, P. Bourke and P. J. Cullen, J. Ind. Eng. Chem., 2018, 59, 350–361 CrossRef CAS.
- D. Yuan, C. Zhang, S. Tang, M. Sun, Y. Zhang, Y. Rao, Z. Wang and J. Ke, Sci. Total Environ., 2020, 727, 138773 CrossRef CAS PubMed.
- D. Yuan, C. Zhang, S. Tang, X. Li, J. Tang, Y. Rao, Z. Wang and Q. Zhang, Water Res., 2019, 114861 CrossRef CAS PubMed.
- G. Rao, Q. Zhang, H. Zhao, J. Chen and Y. Li, Chem. Eng. J., 2016, 302, 633–640 CrossRef CAS.
- S. Tang, Z. Wang, D. Yuan, Y. Zhang, J. Qi, Y. Rao, G. Lu, B. Li, K. Wang and K. Yin, Int. J. Electrochem. Sci., 2020, 15, 2470–2480 CrossRef CAS.
- D. Imai, A. H. A. Dabwan, S. Kaneco, H. Katsumata, T. Suzuki, T. Kato and K. Ohta, Chem. Eng. J., 2009, 148, 336–341 CrossRef CAS.
- J. Liu, J. Ke, Y. Li, B. Liu, L. Wang, H. Xiao and S. Wang, Appl. Catal., B, 2018, 236, 396–403 CrossRef CAS.
- N. Jiang, Y. Zhao, C. Qiu, K. Shang, N. Lu, J. Li, Y. Wu and Y. Zhang, Appl. Catal., B, 2019, 259, 118061 CrossRef CAS.
- J. Li, Y. Li, Z. Xiong, G. Yao and B. Lai, Chin. Chem. Lett., 2019, 30, 2139–2146 CrossRef CAS.
- I. A. Ike, K. G. Linden, J. D. Orbell and M. Duke, Chem. Eng. J., 2018, 338, 651–669 CrossRef CAS.
- X. Li, S. Tang, D. Yuan, J. Tang, C. Zhang, N. Li and Y. Rao, Ecotoxicol. Environ. Saf., 2019, 177, 77–85 CrossRef CAS PubMed.
- S. Tang, N. Li, D. Yuan, J. Tang, X. Li, C. Zhang and Y. Rao, Chemosphere, 2019, 234, 658–667 CrossRef CAS PubMed.
- H. Zhang, Q. Ji, L. Lai, G. Yao and B. Lai, Chin. Chem. Lett., 2019, 30, 1129–1132 CrossRef CAS.
- S. Tang, D. Yuan, Y. Rao, N. Li, J. Qi, T. Cheng, Z. Sun, J. Gu and H. Huang, Chem. Eng. J., 2018, 337, 446–454 CrossRef CAS.
- T. Zhang, Y. Liu, Y. Rao, X. Li, D. Yuan, S. Tang and Q. Zhao, Chem. Eng. J., 2019, 123350 Search PubMed.
- Z. Wang, Y. Wan, P. Xie, A. Zhou, J. Ding, J. Wang, L. Zhang, S. Wang and T. C. Zhang, Chemosphere, 2019, 214, 136–147 CrossRef CAS PubMed.
- B. Shen, C. Dong, J. Ji, M. Xing and J. Zhang, Chin. Chem. Lett., 2019, 30, 2205–2210 CrossRef CAS.
- L. Chen, T. Cai, C. Cheng, Z. Xiong and D. Ding, Chem. Eng. J., 2018, 351, 1137–1146 CrossRef CAS.
- H. Xie, J. Zhang, D. Wang, J. Liu, L. Wang and H. Xiao, Appl. Surf. Sci., 2020, 504, 144456 CrossRef.
- H. Chen, Z. Zhang, M. Feng, W. Liu, W. Wang, Q. Yang and Y. Hu, Chem. Eng. J., 2017, 313, 498–507 CrossRef CAS.
- Q. Gao, Y. Han, P. Liang and J. Meng, Phys. Chem. Chem. Phys., 2020, 22, 6291–6299 RSC.
- S. Dhaka, R. Kumar, M. A. Khan, K. Paeng, M. B. Kurade, S. Kim and B. Jeon, Chem. Eng. J., 2017, 321, 11–19 CrossRef CAS.
- Y. Han, Q. Zhang and L. Wu, Desalination, 2020, 477, 114270 CrossRef.
- S. Dhaka, R. Kumar, S. Lee, M. B. Kurade and B. Jeon, J. Cleaner Prod., 2018, 180, 505–513 CrossRef CAS.
- A. Fernandes, P. Makoś and G. Boczkaj, J. Cleaner Prod., 2018, 195, 374–384 CrossRef CAS.
- H. Liang, P. Hua, Y. Zhou, Z. Fu, J. Tang and J. Niu, Chin. Chem. Lett., 2019, 30, 2245–2248 CrossRef CAS.
- H. Li, S. Guo, K. Shin, M. S. Wong and G. Henkelman, ACS Catal., 2019, 9, 7957–7966 CrossRef CAS.
- O. S. Furman, A. L. Teel and R. J. Watts, Environ. Sci. Technol., 2010, 44, 6423–6428 CrossRef CAS PubMed.
- X. Lou, D. Xiao, C. Fang, Z. Wang, J. Liu, Y. Guo and S. Lu, Environ. Sci. Pollut. Res., 2016, 23, 4778–4785 CrossRef CAS PubMed.
- C. Liang, C. Huang, N. Mohanty and R. M. Kurakalva, Chemosphere, 2008, 73, 1540–1543 CrossRef CAS PubMed.
- J. Wu, K. Yin, M. Li, Z. Wu, S. Xiao, H. Wang, J. A. Duan and J. He, Nanoscale, 2020, 12, 4077–4084 RSC.
- C. S. Uyguner and M. Bekbolet, Catal. Today, 2005, 101, 267–274 CrossRef CAS.
- K. Wang, L. Li, Y. Lan, P. Dong and G. Xia, Math. Probl. Eng., 2019, 2019, 2614327 Search PubMed.
- S. Tang, X. Li, C. Zhang, Y. Liu, W. Zhang and D. Yuan, Plasma Sci. Technol., 2019, 21, 25504 CrossRef CAS.
- Q. Zhang, S. Zhang, Z. Zhao, M. Liu, X. Yin, Y. Zhou, Y. Wu and Q. Peng, J. Cleaner Prod., 2020, 255, 120297 CrossRef CAS.
- G. Matafonova and V. Batoev, Water Res., 2018, 132, 177–189 CrossRef CAS PubMed.
- M. Liu, L. Jia, Z. Zhao, Y. Han, Y. Li, Q. Peng and Q. Zhang, Chem. Eng. J., 2020, 390, 124667 CrossRef CAS.
- F. Rehman, M. Sayed, J. A. Khan, N. S. Shah, H. M. Khan and D. D. Dionysiou, J. Hazard. Mater., 2018, 357, 506–514 CrossRef CAS PubMed.
- C. Duan, Y. Yu, J. Xiao, X. Zhang, L. Li, P. Yang, J. Wu and H. Xi, Sci. China Mater., 2020, 63, 667–685 CrossRef.
- C. Duan, Y. Yu, P. Yang, X. Zhang, F. Li, L. Li and H. Xi, Ind. Eng. Chem. Res., 2020, 59, 774–782 CrossRef CAS.
- X. Ao and W. Liu, Chem. Eng. J., 2017, 313, 629–637 CrossRef CAS.
- Y. Gao, N. Gao, Y. Deng, Y. Yang and Y. Ma, Chem. Eng. J., 2012, 195–196, 248–253 CrossRef CAS.
- G. Xia, Y. Huang, F. Li, L. Wang, J. Pang, L. Li and K. Wang, Front. Chem. Sci. Eng., 2020 DOI:10.1007/s11705-019-1901-5.
- Z. Wang, Z. Wu and S. Tang, Water Res., 2009, 43, 1533–1540 CrossRef CAS PubMed.
- I. A. Ike, J. D. Orbell and M. Duke, ACS Sustainable Chem. Eng., 2018, 6, 4345–4353 CrossRef CAS.
- K. Wang, L. Li, X. Wen, S. Zhou, Y. Lan, H. Zhang and Z. Sui, Int. J. Electrochem. Sci., 2017, 8306–8314 CAS.
- A. Eslami, M. Hashemi and F. Ghanbari, J. Cleaner Prod., 2018, 195, 1389–1397 CrossRef CAS.
- F. Ji, H. Yin, H. Zhang, Y. Zhang and B. Lai, J. Cleaner Prod., 2018, 188, 860–870 CrossRef CAS.
- D. An, P. Westerhoff, M. Zheng, M. Wu, Y. Yang and C. Chiu, Water Res., 2015, 73, 304–310 CrossRef CAS PubMed.
- A. Ghauch and A. M. Tuqan, Chem. Eng. J., 2012, 183, 162–171 CrossRef CAS.
- M. A. Lominchar, A. Santos, E. de Miguel and A. Romero, Sci. Total Environ., 2018, 622–623, 41–48 CrossRef CAS PubMed.
- G. Wu, W. Qin, L. Sun, X. Yuan and D. Xia, Chem. Eng. J., 2019, 360, 115–123 CrossRef CAS.
- P. Xie, L. Zhang, J. Chen, J. Ding, Y. Wan, S. Wang, Z. Wang, A. Zhou and J. Ma, Water Res., 2019, 149, 169–178 CrossRef CAS PubMed.
- W. Liu, H. Zhang, B. Cao, K. Lin and J. Gan, Water Res., 2011, 45, 1872–1878 CrossRef CAS PubMed.
- D. Yuan, M. Sun, S. Tang, Y. Zhang, Z. Wang, J. Qi, Y. Rao and Q. Zhang, Chin. Chem. Lett., 2020, 31, 547–550 CrossRef CAS.
- X. Du, Y. Zhang, I. Hussain, S. Huang and W. Huang, Chem. Eng. J., 2017, 313, 1023–1032 CrossRef CAS.
- Y. Li, G. Qu, L. Zhang, T. Wang, Q. Sun, D. Liang and S. Hu, Sep. Purif. Technol., 2017, 180, 36–43 CrossRef CAS.
- S. Valencia, J. M. Marín, G. Restrepo and F. H. Frimmel, Sci. Total Environ., 2013, 442, 207–214 CrossRef CAS PubMed.
- T. Wang, G. Qu, J. Ren, Q. Yan, Q. Sun, D. Liang and S. Hu, Water Res., 2016, 89, 28–38 CrossRef CAS PubMed.
- T. Zhang, Y. Liu, Y. Rao, X. Li and Q. Zhao, Build. Environ., 2020, 175, 106810 CrossRef.
- T. Zhang, X. Li, Y. Rao, Y. Liu and Q. Zhao, Sustain. Cities Soc., 2020, 55, 102050 CrossRef.
Footnote |
| † Electronic supplementary information (ESI) available. See DOI: 10.1039/d0ra01787f |
|
| This journal is © The Royal Society of Chemistry 2020 |
Click here to see how this site uses Cookies. View our privacy policy here.  Open Access Article
 *,
Zetao Wang,
Yating Zhang and
Yandi Rao


 ).58 TBA also can be applied to quench the two radicals (kTBA, ·OH = 3.8–7.6 × 10⁸ M−1 s−1,
  ); however, its scavenging rate for ·OH is approximately three orders greater than that for SO4˙−.59 However, some other reactive species are generated in the homogeneous persulphate system, such as single oxygen (1O2) and superoxide anion (O2˙−).60 These cannot be quenched by EtOH and TBA; therefore, the HA removal was not inhibited completely under the high level of EtOH. Moreover, previous studies have suggested that SO4˙− is the primary radical in acidic conditions, while ·OH is the chief radical in alkali conditions.61 After addition of the two persulphates, the solution pH sharply decreased and became highly acidic, while the reaction continued without other adjustments. Hence, it can be deduced that SO4˙− is the major reactive species in acidic conditions, and ·OH is the auxiliary species for the HA oxidization during the two synergistic processes.


