 Open Access Article
Elongated conductive structures in detonation soot of high explosives†
Nataliya P. Satonkina *ab,
Alexander P. Ershova,
Alexey O. Kashkarova and
Ivan A. Rubtsova
aLavrentyev Institute of Hydrodynamics SB RAS, Lavrentyev Prosp., 15, Novosibirsk 630090, Russia. E-mail: snp@hydro.nsc.ru; Tel: +79137400572
bNovosibirsk State University, Pirogova str., 1, Novosibirsk 630090, Russia
First published on 6th May 2020
Abstract
High values of electrical conductivity are obtained at the detonation of condensed high explosives with the formula CaHbNcOd. Such values can be explained only in the framework of the contact conductivity hypothesis. In this case, the conductivity is provided by elongated highly-conductive structures which penetrate the whole space of the detonation wave. This work is devoted to the investigation of the detonation soot of high explosives with a significant carbon content in order to discover elongated structures supporting the contact conductivity hypothesis.
1 Introduction
High values of electrical conductivity σ are obtained at the detonation of condensed high explosives (HEs) with the formula CaHbNcOd ranging from several Ohm−1 cm−1 (ref. 1) to hundreds of Ohm−1 cm−1.2–4 Several hypotheses were proposed to explain such high conductivity:5–8 the ionization of intermediate detonation products (DP), the dissociation of DP, the thermal ionization of products and the thermal electron emission from carbon particles, the ionic conductivity, particularly through the products of the dissociation of water. None of these hypotheses can explain the values obtained, especially the highest ones.9 The most realistic hypothesis of contact conductivity was proposed in works.2,3Using the high resolution scheme, we obtained time dependences of electric conductivity for a broad range of HEs and initial conditions.4,10–14 This allows us to systemize the experimental data and to find the regularities and the interconnections which explain the nature of electrical conductivity. The correlation between the electrical conductivity and the carbon content of the substance holds:15,16 the total amount of carbon is essential in the chemical peak, and the amount of carbon remaining after the chemical reactions is significant at the Chapman–Jouguet point. Since, according to this model, the amount of condensed carbon is higher inside the chemical peak, a region of higher values is distinguished at the conductivity graph immediately beyond the front. The hypothesis proposed earlier1,2,5,7,17 therefore points out that the region of high values correlates with the chemical reaction zone.18 The numerical simulation of the carbon condensation was performed in works.19,20 When the mass fraction of carbon is greater than 0.1, the condensation directly into elongated structures occurs bypassing the stage of individual particles.
Results supporting our conclusions were obtained in the work21 where the formation of a carbon cluster with the displacement of “foreign” elements was obtained numerically in the time shorter than 1 ns. In the work,22 the conclusion was made based on energetic considerations of the formation of a carbon skeleton with the displacement of other elements from the solid carbon formation.
High electrical conductivity suggests contact conductivity provided by elongated carbon structures.14,23 At the same time, rapid carbon condensation at the initial stage does not mean the presence of elongated penetrating structures. The presently prevailing point of view assumes, that individual carbon particles are formed in the chemical peak24–33 which after the cooling at later stages form fractal structures34 and agglomerates found in saved detonation products (SDP).35,36 Investigation of highly energetic compositions of carbon-based nanomaterials is reviewed in work.37
The current state of the investigation technologies does not allow to observe directly the “carbon wires”. The rest carbon of SDP carries the integral information on all processes, and it should differ by the quantity as well as by the shape from the aggregates present directly in the detonation wave since, besides the destructive influence of the detonation wave and the chemical reaction, carbon changes in the Taylor wave.42 This complicates significantly the search for elongated structures in saved detonation products. One can expect however that a part of structures are saved after the explosion of certain HEs since nano-object have high stability. The elongated structures are mentioned in works.43–46
The contact conductivity inside the chemical peak requires the carbon condensation at the initial stage of the chemical reaction. The concept on the carbon condensation near the shock front was made in the works of Anisichkin47,48 who used the results of investigations by the isotope method. In the work,22 the conclusion on the formation of a carbon skeleton by the displacement of other elements from a solid carbon aggregate was made using the energy consideration. The formation of a carbon cluster with the displacement of “foreign” elements faster than 1 ns at high temperature was obtained numerically in work.21
In the present work, we consider our electronic microscopy data. The structures are found which confirm the possibility of contact conductivity through carbon allotropes. The account of the fast condensation and the elongated shape of inclusions will affect significantly our conceptions on the chemical reactions and the energy release. Therefore, this work is useful for constructing the model of kinetics at the detonation of condensed HEs.
2 Electrical conductivity at the detonation of condensed high explosives
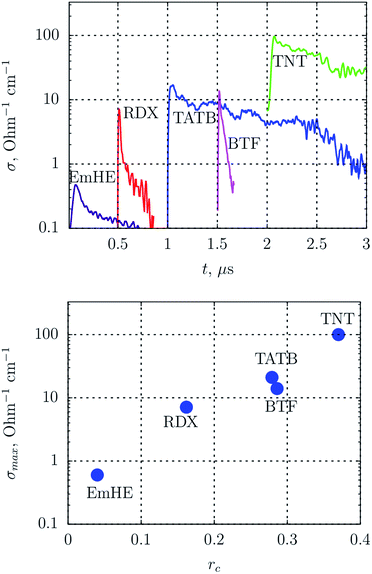
The high resolution scheme was used to obtain the time dependence of the electrical conductivity. The scheme is described in works10,11 and in ESI.† The electrical conductivity tracks the detonation wave with the resolution better than several nanoseconds.14At the top of Fig. 1, the graphs of conductivity at the detonation of emulsion HE, cyclotrimethylene–trinitramine (RDX), triaminotrinitrobenzene (TATB) and benzotrifuroxan (BTF) are shown, the graphs are shifted for clarity. The bottom of Fig. 1 shows the maximum electrical conductivity vs. the mass fraction of carbon in the HE molecule. The connection between the maximum value σmax and the carbon fraction in the substance rc is clearly seen (Fig. 1, bottom graph) despite the significant difference in the kinetics and in the thermodynamic parameters (Table 1). The key role of carbon for conductivity is obvious.
The question of the phase state of carbon both in the chemical peak and in the rarefaction wave remains open. Note, however, that most of the allotropic forms of carbon are conductive (for instance, graphite, graphene,49 nanotubes50,51), as well as the liquid phase.52 The conductivity of the highly-oriented graphite is metallic.53
The highest values of electric conductivity are observed at the detonation of trinitrotoluene (TNT)2–4 which has the highest carbon content. Noted in previous work,3 that the percolation does not explain the observed values, and the existence of elongated structures with almost metallic conductivity is necessary. Carbon can play this role. A rod of graphite with the mass equal to one contained in 1 cm3 of TNT has the electrical conductivity of ≈220 Ohm−1 cm−1. This value does not differ much from the one obtained in our experiments, and practically coincides with the value of 250 Ohm−1 cm−1 from the work.3 If nanotubes are added to a dielectrics in an amount of 2% by mass, the electrical conductivity increases to several Ohm−1 cm−1.54 Since the mass fraction of carbon for traditional HEs is higher than 10% (Table 1), the existence of elongated carbon structures in the detonation wave can produce the experimentally observed values of conductivity.
The shape of the electrical conductivity graph in Fig. 1, top corresponds to the following model: elongated carbon structures are formed in the chemical reaction region, these structures produce the maximum conductivity inside the reaction zone; later, oxidative chemical reactions with carbon take place leading to the thinning and the partial breaking of the structures which results in the decrease of σ(t). Thus, the thin region of high values of conductivity corresponds to the chemical reaction zone.18
This region is hard to recover for TATB and TNT. These HEs have rather low thermodynamic parameters (Table 1), but they contain a lot of carbon and they have a significant negative oxygen balance. We relate the slow decrease of σ(t) to the significant fraction of condensed carbon in the Taylor wave sufficient to preserve conductive structures. This also points indirectly to their preservation in the detonation products.
Thus, based on the link between the maximum of the electrical conductivity with the conductive forms of carbon in the chemical peak, it is reasonable to search for the conductive structures in SDP of carbon-rich HEs.
3 Detonation soot, data of transmission electron microscopy
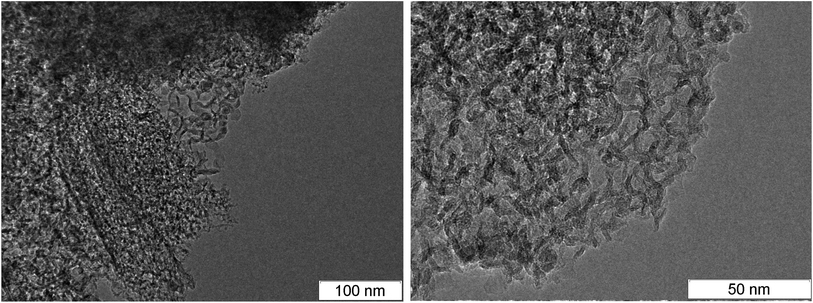
Since diamond is usually searched in SDP,55 products are subject to an aggressive chemical purification. As a result, carbon is preserved mainly in the diamond and amorphous state, and the conductive phase – graphite – is removed. In this work, we show the transmission electron microscopy (TEM) micrographs of SDP without the purification.‡Fig. 2 shows the TEM micrographs of fibrous structures discovered in detonation products of carbon-rich HEs: TATB – left, TNT – right. The resolution is quite low to examine details, however, one can state the presence of fibers with the length of about 50 nm and the diameter less than 10 nm.
At larger magnification, the elongated structures are clearly seen at the TEM micrographs of SDP Fig. 3: left – TATB, right – TNT. For TNT, a complex bifurcating structure with well distinguishable layers is outlined by red. The individual fiber can be traced which buckles and bifurcates. The fibers are arranged in a haystack-like manner which somewhat complicates the interpretation and the separation of the individual fiber. The average distance between layers in TNT is about 0.36 nm, slightly larger than in TATB. This can be related to the irregularly bent structure and to the sticking of atoms of other elements on the carbon structure. This distance is close to the distance between graphite layers, and it gives us grounds to assert that the structures presented at the micrograph are conductive.
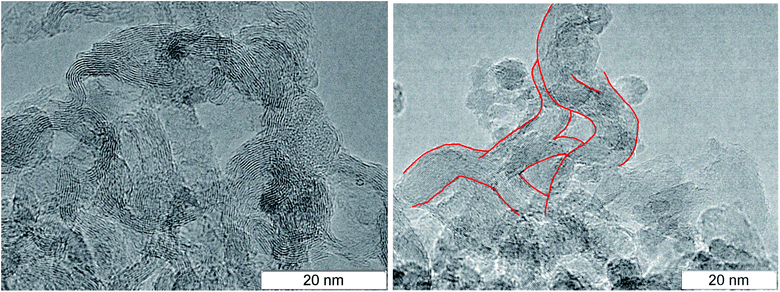 | ||
| Fig. 3 TEM micrographs of the rest carbon after the detonation of TATB (left) and TNT (right), elongated solid branching structure is highlighted in red. | ||
In the works,44,45 similar aggregates are named graphite ribbons with the width of 4 nm. Similar structures were discovered both in the detonation products and in the soot of the TNT combustion.43 In that work, they were named the stack of layers which however does not form graphite crystallites since they are bent irregularly. Similar structures were observed in SDP of HNS56 which is close to TNT by the thermodynamic parameters and the carbon content but has lower amount of hydrogen.
In the recent work,57 interesting structures were obtained at the detonation of a gas mixture. These structures were investigated by the methods of SEM and TEM. This allowed to determine for certain the allotropic forms in the saved products. The micrographs have high quality and bright contrast. The distance between planes is 0.379 nm for hollow particles and 0.386 nm for graphene nanosheets which is larger than the values obtained by us for SDP of condensed HEs.
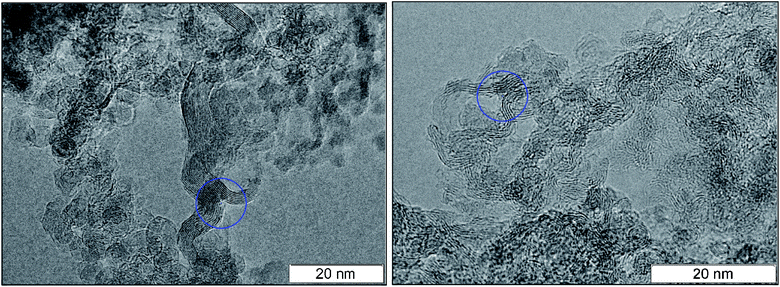
A necessary element of the contact conductivity is the structure which is not only elongated but also branched since an individual fiber can not have the macroscopic length. The bifurcation points found in the detonation products of TNT and TATB are circled in Fig. 4. A separate well distinguished layer can be easily traced prior and beyond the branching. Bifurcation points are also present at other photographs, hence, they are not rare.
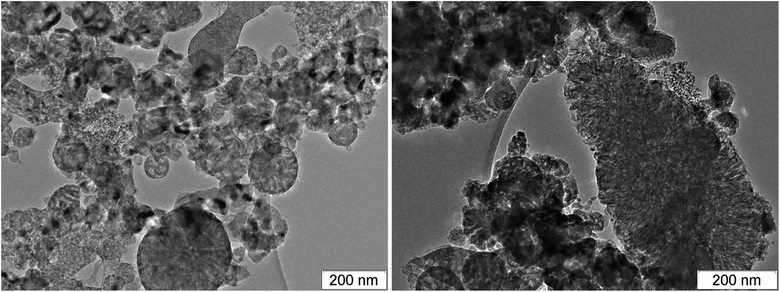
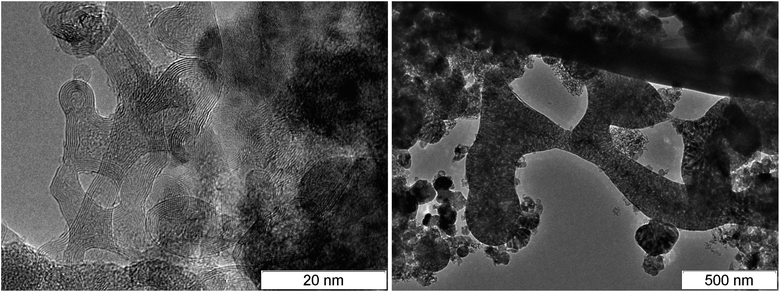
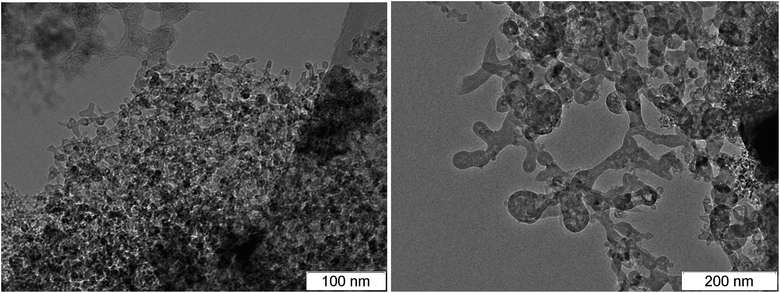
Among the carbon-rich HEs, BTF stands out. SDP of BTF differ from SDP of all other investigated HEs by the record size of diamonds,46,58 the presence of massive formations with complex inner structure and different phase composition, morphology and size (Fig. 5–7).
It was assumed earlier that the formation of massive aggregates and large nanodiamonds is due to the very high temperature in the detonation wave the values between 5000 K and 7000 K were obtained in calculations which corresponds to the liquid state at the phase diagram of carbon. However, it was shown in the work,60 that the temperature at the detonation of BTF does not differ significantly from the values obtained for other HEs (Table 1). This however does not exclude the liquid phase state. It is noted in the works25,29 that the size of particles is important, smaller particles have lower melting temperature.
In the work,61 the size of the nanodiamonds of BTF is explained by the absence of hydrogen. In our opinion, the large size of carbon structures is caused by the high speed of the carbon condensation due to the absence of hydrogen at the rapid decomposition of the initial HE. We observed the conductivity jump to the value close to the maximum one in less than 6 ns.14 To this moment, penetrating carbon structures are already formed, and the thermodynamic parameters are close to maximum. This promotes the effective coagulation of liquid carbon into large structures.
Since the maximum electrical conductivity for BTF is close to the value for TATB with the close carbon fraction, we can conclude that carbon in the region of the chemical peak is in the conductive phase for both HEs despite the temperature difference of 1400 K. Note that the electrical conductivity of the liquid carbon is about 1000 Ohm−1 cm−1 (ref. 53) which is close to the value of graphite.
Fig. 6 and 7 show the branched structures in SDP of BTF of different scale: from nanometers to microns. In Fig. 6, left, one can see the preserved net of carbon structures – amorphous carbon enveloped by graphite-like layers. The size of the branched structure in Fig. 7, right is larger than several hundreds of nm, the size in Fig. 6, right is larger than one micron. The distance between layers (in Fig. 6 here and in ESI† where the scale allows to make measurements) is about 0.335 nm which is lower than for structures in SDP of other HEs. The work56 presents SDP of DNTF (C6N8O8, furoxane) with lower carbon content than that in BTF (0.23 and 0.29, respectively). Saved products have spherical shape and small size, the distance between layers is 0.334 nm same as in our case. It is possible that the sticking of hydrogen atoms between layers occurs in other HEs which increases the distance.
Such diversity of the scale of carbon grains is related to the different unloading conditions at the center and the periphery of the charge. Thus, the work59 shows the influence of the external conditions on the morphology and the size of particles in SDP of the Composition B (TNT/RDX alloy).
Thus, the structures are present in SDP of BTF which can provide the observed electrical conductivity both in the liquid state and through the conductive graphite envelope formed on all particles. The large amount of the branched structures is characteristic for SDP of BTF, the branching can be traced from nanometer to micrometer scale.
The elongated carbon structures demonstrated above are, in our opinion, an argument supporting the contact conductivity hypothesis. The connection between the conductivity and the conductive form of carbon allows one to investigate experimentally the chemical processes in real time and to trace the evolution of carbon structures even in the chemical reaction zone.
4 Conclusion
The existence of elongated structures expected from the electrical conductivity measurements is confirmed by the elongated branched structures found in the saved detonation products of carbon-rich HEs.This work can be used to develop the chemical kinetics at the detonation of condensed HEs.
Conflicts of interest
There are no conflicts to declare.Acknowledgements
This work was supported by the Russian Foundation for Basic Research (Grants N 18-03-00227 and N 18-03-00441).Notes and references
- A. A. Brish, M. S. Tarasov and V. A. Tzukerman, Zh. Eksp. Teor. Fiz., 1959, 37, 1543–1549 CAS.
- B. Hayes, On Electrical Conductivity in Detonation Products, Proc. 4th Symposium on Detonation, White Oak, ACR-126, 1965, pp. 595–601 Search PubMed.
- S. D. Gilev and A. M. Trubachev, Tech. Phys., 2001, 46(9), 1185–1189 CrossRef CAS.
- A. P. Ershov and N. P. Satonkina, Combust., Explos. Shock Waves, 2009, 45, 205–210 CrossRef.
- A. G. Antipenko, A. N. Dremin and V. V. Yakushev, Dokl. Acad. Nauk. SSSR, 1975, 225, 1086–1088 CAS.
- V. V. Yakushev and A. N. Dremin, Dokl. Acad. Nauk. SSSR, 1975, 221, 1143–1144 CAS.
- Explosion Physics [Fizika vzryva], ed. L. P. Orlenko, vol. 1. M.: Fizmatlit, 2002 Search PubMed.
- A. P. Ershov, Combust., Explos. Shock Waves, 1975, 11(6), 798–803 CrossRef.
- A. P. Ershov, N. P. Satonkina, O. A. Dibirov, S. V. Tsykin and Yu. V. Yanilkin, Combust., Explos. Shock Waves, 2000, 36(5), 639–649 CrossRef.
- A. P. Ershov, N. P. Satonkina and G. M. Ivanov, Tech. Phys. Lett., 2004, 30, 1048–1050 CrossRef CAS.
- A. P. Ershov, N. P. Satonkina and G. M. Ivanov, Russ. J. Phys. Chem. B, 2007, 26(12), 21–33 CAS.
- A. P. Ershov and N. P. Satonkina, Combust. Flame, 2010, 157, 1022–1026 CrossRef CAS.
- N. P. Satonkina and I. A. Rubtsov, Techn. Phys., 2016, 61(1), 142–145 CrossRef CAS.
- N. P. Satonkina, A. P. Ershov, A. O. Kashkarov, A. L. Mikhaylov, E. R. Pruuel, I. A. Rubtsov, I. A. Spirin and V. B. Titova, Sci. Rep., 2018, 8, 9635 CrossRef PubMed.
- N. P. Satonkina, J. Appl. Phys., 2015, 118, 245901 CrossRef.
- N. P. Satonkina, Combust., Explos. Shock Waves, 2016, 52, 488–492 CrossRef.
- R. Shal, Detonation Physics, Collected Works: Physics of High-Speed Processes, Izd. Mir, Publ., Moscow, 1971, vol. 2, pp. 276–349, Russian Search PubMed.
- N. P. Satonkina, A. P. Ershov, A. V. Plastinin and A. S. Yunoshev, Combust. Flame, 2019, 206, 249–251 CrossRef CAS.
- N. P. Satonkina, A. P. Ershov, E. R. Pruuel and D. I. Karpov, Electric conductivity of detonating trotyl at different initial conditions, Proc. XXIX Int. Conf. Physics of Extreme States of Matter, Elbrus, Kabardino-Balkaria, Russia, 2014 Search PubMed.
- N. P. Satonkina, E. R. Pruuel and D. I. Karpov, Formation of carbon nets in detonation products of high explosives, Proc. XV Int. Detonation Symposium, San-Francisco, California, US, 2014 Search PubMed.
- Y. Wen, C. Zhang, X. Xue and X. Long, Phys. Chem. Chem. Phys., 2015, 17, 12013 RSC.
- O. N. Breusov, Russ. J. Phys. Chem. B, 2002, 21(11), 110–113 CAS.
- N. P. Satonkina and D. A. Medvedev, AIP Adv., 2017, 7, 085101 CrossRef.
- P. I. Zubkov, J. Eng. Thermophys., 2015, 24(1), 57–67 CrossRef CAS.
- J. A. Viecelli, S. Bastea, J. N. Glosli and F. H. Ree, J. Chem. Phys., 2001, 115, 2730–2736 CrossRef CAS.
- S. Bastea, Appl. Phys. Lett., 2012, 100, 214106 CrossRef.
- S. Bastea, Sci. Rep., 2017, 7, 42151 CrossRef CAS PubMed.
- M. M. Gorshkov, K. F. Grebenkin, A. L. Zherebtsov, V. T. Zaikin, V. M. Slobodenyukov and O. V. Tkachev, Combust., Explos. Shock Waves, 2007, 43(1), 78–83 CrossRef.
- V. V. Danilenko, Combust., Explos. Shock Waves, 2005, 41, 577–588 CrossRef.
- K. A. Ten, E. R. Pruuel and V. M. Titov, Fuller. Nanotun Car., 2012, 20, 587–593 CrossRef CAS.
- M. Bagge-Hansen, L. Lauderbach, R. Hodgin, S. Bastea, L. Fried and A. Jones, et al., J. Appl. Phys., 2015, 117, 245902 CrossRef.
- T. M. Willey, M. Bagge-Hansen, L. Lauderbach, R. Hodgin, D. Hansen and C. May, et al., AIP Conf. Proc., 2017, 1793, 030012 CrossRef.
- E. B. Watkins, K. A. Velizhanin, D. M. Dattelbaum, R. L. Gustavsen, T. D. Aslam and D. W. Podlesak, et al., J. Phys. Chem. C, 2017, 121(41), 23129–23140 CrossRef CAS.
- A. P. Ershov and A. L. Kupershtokh, Combust., Explos. Shock Waves, 1991, 27(2), 111–117 CrossRef CAS.
- A. Krüger, F. Kataoka, M. Ozawa, T. Fujino, Y. Suzuki and A. E. Aleksenskii, et al., Carbon, 2005, 43, 1722–1730 CrossRef.
- A. T. Dideikin, A. E. Aleksenskii, M. V. Baidakova, P. N. Brunkov, M. Brzhezinskaya and V. Yu. Davydov, et al., Carbon, 2017, 122, 737–745 CrossRef CAS.
- Qi-L. Yan, M. Gozin and F.-Qi Zhao, Adva Cohen and Si-Ping Pang, Nanoscale, 2016, 8, 4799–4851 RSC.
- K. Tanaka, Detonation Properties of Condensed Explosives Computed Using the Kihara-Hikita-Tanaka Equation of State, National Chemical Laboratory for Industry, Tsukuba Research Center, 1983 Search PubMed.
- S. A. Bordzilovskii, S. M. Karakhanov, A. V. Plastinin, S. I. Rafeichik and A. S. Yunoshev, Combust., Explos. Shock Waves, 2017, 53(6), 730–737 CrossRef.
- N. P. Satonkina, E. R. Pruuel, A. P. Ershov, V. V. Sil’vestrov, D. I. Karpov and A. V. Plastinin, Combust., Explos. Shock Waves, 2015, 51(3), 366–372 CrossRef.
- A. S. Yunoshev, A. V. Plastinin and V. V. Sil’vestrov, Combust., Explos. Shock Waves, 2012, 48(3), 319–327 CrossRef.
- R. C. Huber, B. S. Ringstrand, D. M. Dattelbaum, R. L. Gustavsen, S. Seifert and M. A. Firestone, et al., Carbon, 2018, 126, 289–298 CrossRef CAS.
- Y. Nomura and R. Kawamura, Carbon, 1984, 22, 189–191 CrossRef CAS.
- N. R. Greiner, D. S. Phyllips, J. D. Johnson and F. Volk, Nature, 1988, 333, 440–442 CrossRef CAS.
- T. Xu, Xu Kang and J. Zhao, Mat. Sci. Engineer. B, 1996, 38, L1 CrossRef.
- A. O. Kashkarov, E. R. Pruuel, K. A. Ten, I. A. Rubtsov, E. Yu. Gerasimov and P. I. Zubkov, J. Phys.: Conf. Ser., 2016, 774, 012072 CrossRef.
- V. F. Anisichkin, Combust., Explos. Shock Waves, 2007, 43, 580–586 CrossRef.
- V. F. Anisichkin, Russ. J. Phys. Chem. B, 2016, 10(3), 451–455 CrossRef CAS.
- S. H. M. Jafri, K. Carva, E. Widenkvist, T. Blom, B. Sanyal and J. Fransson, et al., J. Phys. D: Appl. Phys., 2010, 43(4), 045404 CrossRef.
- L. Weller, F. R. Smail, J. A. Elliott, A. H. Windle, A. M. Boies and S. Hochgreb, Carbon, 2019, 146, 789–812 CrossRef CAS.
- Y. Dini, J. Faure-Vincent and J. Dijon, Carbon, 2019, 144, 301–311 CrossRef CAS.
- A. M. Kondratyev, V. N. Korobenko and A. D. Rakhel, J. Phys.: Condens. Matter, 2016, 28, 265501 CrossRef CAS PubMed.
- V. N. Korobenko, A. I. Savvatimski and R. Cheret, Int. J. Thermophys., 1999, 20(4), 1247–1256 CrossRef CAS.
- A. V. Eletskii, A. A. Knizhnik, B. V. Potapkin and J. M. Kenny, Phys.-Usp., 2015, 58, 209–251 CrossRef CAS.
- A. I. Lyamkin, E. A. Petrov, A. P. Ershov, G. V. Sakovich, A. M. Staver and V. M. Titov, Dokl. Acad. Nauk. USSR, 1988, 302(3), 611–613 CAS.
- M. Bagge-Hansen, S. Bastea, J. A. Hammons, M. H. Nielsen, L. M. Lauderbach and R. L. Hodgin, et al., Nat. Commun., 2019, 10, 3819 CrossRef CAS PubMed.
- A. A. Shtertser, D. K. Rybin, V. Yu Ulianitsky, W. Park, M. Datekyu, T. Wada and H. Kato, Characterization of nanoscale detonation carbon produced in a pulse gas-detonation device, Diamond Relat. Mater., 2020, 101, 107553 CrossRef CAS.
- I. Yu. Mal’kov, L. I. Filatov, V. M. Titov, B. V. Litvinov, A. L. Chuvilin and T. S. Teslenko, Combust., Explos. Shock Waves, 1993, 29(4), 542–544 CrossRef.
- A. Y. Dolgoborodov, M. A. Brajnikov, M. N. Makhov, N. E. Safronov and V. G. Kirilenko, Combust., Explos. Shock Waves, 2013, 49(6), 723–730 CrossRef.
- S. S. Batsanov, A. N. Osavchuk, S. P. Naumov, A. E. Efimov, B. G. Mendis, D. C. Apperley and A. S. Batsanov, Propellants, Explos., Pyrotech., 2015, 40, 39–45 CrossRef CAS.
- J. A. Hammons, M. H. Nielsen, M. Bagge-Hansen, L. M. Lauderbach, R. L. Hodgin and S. Bastea, et al., Propellants Explos. Pyrotech., 2020, 45(2), 347–355 CrossRef CAS.
Footnotes |
| † Electronic supplementary information (ESI) available. Electrical circuit for measuring the conductivity in the detonation of condensed HE, an album with images obtained by the method TEM; several TEM images are presented; electrical circuit description. See DOI: 10.1039/d0ra01393e |
| ‡ All presented photos are available in high resolution online. The transmission electron microscopy micrographs database is available by the link http://ancient.hydro.nsc.ru/srexpl/detcarbon |
| This journal is © The Royal Society of Chemistry 2020 |

