 Open Access Article
Delving into the multifunctionality of Sr2NaMg2V3O12via RE3+ substitution for dual-mode temperature sensing, latent fingerprint detection and security inks†
Amrithakrishnan
Bindhu
 ,
Jawahar Isuhak
Naseemabeevi
and
Subodh
Ganesanpotti
 *
*
Department of Physics, University of Kerala, Kariavattom Campus, Thiruvananthapuram, Kerala-695 581, India. E-mail: gsubodh@gmail.com; gsubodh@keralauniversity.ac.in
First published on 17th July 2023
Abstract
Vanadate garnets are one of the exotic materials that exhibit multifunctionality, inevitable for the current scenario in materials science. Herein, the multifunctional aspects of Sr2NaMg2V3O12 and Sr2NaMg2V3O12:Sm3+/Eu3+ phosphors are discussed. The distinct thermal response of Sm3+ and VO43− enabled the temperature sensing property in which a maximum relative temperature sensitivity of 2.01% K−1 is obtained at 440 K, along with an average temperature uncertainty of ±1.0 K, high repeatability rate of 95%, and temperature resolution of <0.7 K. Negative thermal quenching was observed near the charge transfer band edge with the increase in temperature due to the thermal population of higher vibronic states. A rapid change in emission color with temperature rise for safety sign application was also observed. The prospects of Sr2NaMg2V3O12 based phosphors were investigated for latent fingerprint detection for the first time in vanadate garnets. Under 365 nm UV radiation, fluorescent images with good contrast were obtained from the powder-stained latent fingerprints, and pixel profile data was analysed thoroughly. As confirmed by the microstructure study, the relatively smaller size of the phosphor grains increased their adhesion on fingerprints. The primary, secondary, and tertiary levels of identification, including sweat pores, deltas, and bifurcations, were performed. The efficiency of powder-stained LFPs was verified after a long storage duration and for various substrates. The developed security inks were highly efficient and can reduce the risk of duplication of documents for anticounterfeiting. These results manifest the versatility of the Sr2NaMg2V3O12 and Sr2NaMg2V3O12:Sm3+/Eu3+ systems for multifunctional applications.
1. Introduction
Inorganic phosphors possess various technological applications in materials science. Currently, the design and development of multifunctional phosphors are of great demand. Apart from solid-state lighting and temperature sensing, inorganic phosphors can be used in versatile fields, such as latent fingerprint detection, anti-counterfeiting, and bio-sensing.1,2 Regarding optical thermometry based on thermographic phosphors, this new class of thermometry offers non-contact measurement. In the conventional method, the direct contact of the thermometer with the objects of interest is needed.3 Hence biological samples cannot be measured since they need measurements on a microscopic scale.4 The slow response rate and low resolution are other disadvantages.5 On the other hand, optical thermometry based on the luminescence of phosphors offers better relative temperature sensitivity, short acquisition time, spatial resolution, etc.6–8 The phosphors that are used for optical thermometry are termed thermographic phosphors, which have temperature-dependent luminescence parameters, such as emission intensity, decay or rise time, emission color, and spectral shift. Among these approaches, temperature sensing based on fluorescence intensity ratio (FIR) offers better sensing with negligible drift and self-referencing.9–12 Most reports regarding the FIR method focused on the thermally coupled levels (TCLs) of rare-earth (RE) ions. The overlapped emission due to the small energy gap of 20 < ΔE < 2000 cm−1 limits the accuracy and signal discriminability of the sensor.13–16 Thus, FIR based on non-TCLs attracted considerable attention. In this context, phonon-assisted energy transfer involving dual emitting centers helps to realize better relative temperature sensitivity and signal discriminability.17,18In this context, the selection of the host material plays an important role. The host system should possess a large bandgap, low phonon energy, etc. and effectively transfer the energy between luminescence centers. Vanadate-based hosts are known for their strong absorption and self-activated luminescence due to the 3T1,2 → 1A1 transitions.17,19–24 RE ions possess a low absorbance in the UV region due to narrow excitation of forbidden 4f–4f transition. Hence, the RE-activated vanadate host structure helps in phonon-assisted energy transfer from VO43− to RE3+. If the host structure helps to tune the emission properties, then the design of the thermographic phosphor with better temperature sensitivity can be realized. Presently, garnet-structured hosts are known for the tunability of photophysical response via polyhedral substitution and subsequent structure–property correlation.25 Garnets have the general stoichiometry {A3}[B2](C3)O12, in which A, B, and C correspond to dodecahedral, octahedral, and tetrahedral sites, respectively, and crystallize in the cubic Ia![[3 with combining macron]](https://www.rsc.org/images/entities/char_0033_0304.gif) d (230, Oh10) space group. Garnet structured materials are known for their unique structural framework and compositional diversity, which meet the requirements of various lighting and sensing applications.26,27 Consequently, RE3+-activated vanadate garnet-based thermographic phosphors are an excellent choice for ratiometric temperature sensing. Vanadate garnet generally possesses low phonon energy, essential for better luminescence properties. Recently, our group has investigated the thermographic and thermochromic luminescence of the Eu3+-activated Sr2NaMg2V3O12 system in detail.23 Moreover, the study of optical temperature sensing based on vanadate garnets still needs to be improved. To figure out this gap in understanding the potentiality of vanadate garnets, Sr2NaMg2V3O12 (SNMV) is selected as the host material due to its better luminescence properties.24,28 Another notable orange-red emitter ion among RE ions is Sm3+. The orange-red emission corresponds to 4G5/2 → 6HJ/2 (J = 5, 7, and 9) transitions. The Sm3+-based vanadate system is reported to exhibit better temperature sensitivity via energy transfer.17 Hence, the Sm3+-activated Sr2NaMg2V3O12 material is considered for ratiometric temperature sensing in vanadate garnet systems.
d (230, Oh10) space group. Garnet structured materials are known for their unique structural framework and compositional diversity, which meet the requirements of various lighting and sensing applications.26,27 Consequently, RE3+-activated vanadate garnet-based thermographic phosphors are an excellent choice for ratiometric temperature sensing. Vanadate garnet generally possesses low phonon energy, essential for better luminescence properties. Recently, our group has investigated the thermographic and thermochromic luminescence of the Eu3+-activated Sr2NaMg2V3O12 system in detail.23 Moreover, the study of optical temperature sensing based on vanadate garnets still needs to be improved. To figure out this gap in understanding the potentiality of vanadate garnets, Sr2NaMg2V3O12 (SNMV) is selected as the host material due to its better luminescence properties.24,28 Another notable orange-red emitter ion among RE ions is Sm3+. The orange-red emission corresponds to 4G5/2 → 6HJ/2 (J = 5, 7, and 9) transitions. The Sm3+-based vanadate system is reported to exhibit better temperature sensitivity via energy transfer.17 Hence, the Sm3+-activated Sr2NaMg2V3O12 material is considered for ratiometric temperature sensing in vanadate garnet systems.
Apart from ratiometric temperature sensing, fluorescent materials with better emission offer good contrast from the background and can be used to detect latent fingerprints. The latent fingerprint is one of the classic and exclusive pieces of evidence observed at any crime scene, which provides sensitive information on the suspects. Because of their uniqueness, LFPs can provide leading clues regarding identity information and personal characteristics, essential for forensic investigation, law enforcement, and medical diagnostics.1,2,29–31 Since fingerprints are latent, strong contrast between fingerprint ridges and grooves/furrows is required to visualize them. Hence it is necessary to visualize them with physical, chemical, or optical treatments.32 The traditional powder dusting approach for enhancing LFP imaging uses metallic or magnetic powders. On the other hand, chemical methods involve the cyanoacrylate technique, ninhydrin and iodine fuming and silver nitrate spraying.33,34 However, they suffer from limitations like low contrast, high background interference, low sensitivity, and high toxicity.35 On the other hand, photoluminescence detection of LFPs based on luminescent materials is an efficient strategy for developing enhanced LFP images, as it offers better sensitivity and resolution. Inorganic phosphors such as Ba3Y4O9:Sm3+ and YVO4:Eu3+ are reported for fluorescence imaging-based LFP detection.36,37 However, to the best of our knowledge, no reports are available where vanadate garnets are studied for latent fingerprint detection. Since vanadate garnets exhibit better luminescence properties, the potentiality of the self-activated and rare-earth-activated Sr2NaMg2V3O12 system is comprehensively studied for latent fingerprint detection.
In addition, we have studied the prospects of these phosphors for security inks necessary for anticounterfeiting applications. Counterfeiting is one of the pressing problems that society is facing nowadays. Fluorescent inks can be used as security inks to identify original from fake, and for preparation of official and security documents, currency, gadgets, certificates, etc. The originality and authenticity of firms can be safeguarded from counterfeiting of logos using security inks. Thus, it is high time to develop better anticounterfeiting techniques like security inks to end counterfeiting. In this context, RE-based security inks provide a better choice owing to their intense emission, and better hiddenness necessary for anticounterfeiting application. There are reports on phosphors based on fluorides, lead-free halide perovskites, and carbon quantum dots reported for fluorescent ink applications.38–41 To the best of our knowledge, no reports are available where vanadate garnets are studied for anti-counterfeiting applications. This work studies the Sm3+-activated SNMV system for ratiometric temperature sensing based on the distinct thermal response of the VO43− complex and Sm3+ ions. In addition, SNMV and SNMV:RE3+ systems are thoroughly investigated for latent fingerprint detection based on powder dusting and security inks meant for anti-counterfeiting applications.
2. Experimental
2.1 Materials and synthesis
The polycrystalline samples of phosphors Sr2NaMg2V3O12:Sm3+ were synthesized via a solid-state reaction route. The selected reagents SrCO3, Na2CO3, MgO, and NH4VO3 (≥99%, Sigma Aldrich), and Sm2O3 (≥99%, Alfa Aesar) were weighed in a stoichiometric ratio and mixed well in acetone medium via ball milling using ceria stabilized zirconium balls for 18 h. Owing to the hygroscopic nature, MgO was preheated at 900 °C for 2 h before weighing. Further, the obtained slurries were dried at 80 °C and ground thoroughly using agate and mortar. The powder mixture was then calcined at 900 °C for 4 h. After calcination, powders were further ground for characterization.2.2 Characterization
The phase purity of the synthesized compounds was studied using a Bruker D8 Advance X-ray diffractometer (40 kV, 40 mA) having a Cu-Kα source with λ = 1.5406 Å, nickel filter, and Lynx eye position-sensitive detector. Topas 4.2 software was used to perform Rietveld refinement for obtaining detailed crystal structure information in which the Chebyshev polynomial was used to fit the background. The unit cell parameters, occupancy, atomic positions, and isotropic atomic displacement parameters were refined. The crystal structures and the polyhedral network were simulated using CrystalMaker 9.2.6 software. The microstructural studies were conducted using field emission scanning electron microscope images (FE-SEM) obtained using an FEI Nova Nano SEM 450 with a magnification of 15![[thin space (1/6-em)]](https://www.rsc.org/images/entities/char_2009.gif) 000×. Room temperature and temperature-dependent Raman scattering spectra were recorded using a Horiba Scientific LabRAM HR Evolution Raman Spectrometer with a 785 nm laser (high power and single frequency diode laser) of 90 mW. The optical band gap was estimated based on diffuse reflectance spectra (DRS), recorded using a JASCO-V-750 UV-Vis spectrophotometer. The room temperature photoluminescence spectra were collected with the help of a Fluorolog-3 spectrofluorometer, using a 450 W ozone-free xenon lamp as the source. The decay time measurements were carried out using nano-LED (λex= 300 nm), and quantum yield is measured using the integrated sphere setup attached to the same instrument. The temperature-dependent photoluminescence measurements in the 80–500 K range were carried out using an FLS 1000 spectrophotometer from Edinburgh Instruments equipped with an Optistat cryostat by Oxford Instruments. Liquid nitrogen was used as the cooling agent; the temperature stabilization time was 100 s with an accuracy of ±0.01 K.
000×. Room temperature and temperature-dependent Raman scattering spectra were recorded using a Horiba Scientific LabRAM HR Evolution Raman Spectrometer with a 785 nm laser (high power and single frequency diode laser) of 90 mW. The optical band gap was estimated based on diffuse reflectance spectra (DRS), recorded using a JASCO-V-750 UV-Vis spectrophotometer. The room temperature photoluminescence spectra were collected with the help of a Fluorolog-3 spectrofluorometer, using a 450 W ozone-free xenon lamp as the source. The decay time measurements were carried out using nano-LED (λex= 300 nm), and quantum yield is measured using the integrated sphere setup attached to the same instrument. The temperature-dependent photoluminescence measurements in the 80–500 K range were carried out using an FLS 1000 spectrophotometer from Edinburgh Instruments equipped with an Optistat cryostat by Oxford Instruments. Liquid nitrogen was used as the cooling agent; the temperature stabilization time was 100 s with an accuracy of ±0.01 K.
2.3 Latent fingerprint detection
LFP samples were obtained by lightly rubbing the thumb on the greasy face area, such as the forehead and nose, after cleaning the fingers. The LFPs were obtained by pressing fingers on the glass substrate with suitable pressure. This was followed by a gentle sprinkling of the phosphor powders on the developed LFPs. The excess powder was removed from the substrates using a fine brush. The LFPs illuminated under 365 nm were photographed using a mobile camera, Xiaomi Mi 11 Lite, and the fluorescent images based on security inks were photographed using a Samsung A50.3. Results and discussion
3.1 Crystal structure
The crystal structure and phase purity of Sm3+-activated Sr2NaMg2V3O12 (SNMV) samples are analysed using XRD patterns. Fig. 1(a) shows the XRD patterns of SNMV:xSm3+ (x = 0, 0.01, 0.03, 0.05, 0.07, 0.10 and 0.12) indexed to the cubic Ia![[3 with combining macron]](https://www.rsc.org/images/entities/char_0033_0304.gif) d (230, Oh10) space group and the Rietveld refinement pattern of SNMV:0.05Sm3+ is given in Fig. 1(b). All the compositions are of single-phase and isostructural with Sr2NaMg2V3O12 (ICDD file No. 00-024-1131). It is confirmed that substituting Sm3+ into the dodecahedral site does not change the crystallinity of the samples. Compared with the general stoichiometry, A3B2C3O12, Sr2+, and Na+ occupy the dodecahedral site (24c) with 2/3 and 1/3 occupancy to form Sr/NaO8 dodecahedra. The octahedral site (16a) is occupied by Mg2+, the tetrahedral site (24d) by V5+ ions, and oxygen ions in the general sites (96h). The lanthanide ion Sm3+ is substituted onto the dodecahedral site. The refined unit cell parameters and crystallographic data of the Sr1.9Sm0.05Na1.05Mg2V3O12 phosphor are tabulated in Table S1 (ESI†). The obtained reliability parameters confirm the occupancy of Sm3+ in the dodecahedral site. The Sr1.9Sm0.05Na1.05Mg2V3O12 system has a lattice parameter of 12.652(1) Å, respectively. Further, it can be noted that lattice contraction takes place owing to the smaller ionic radii of Sm3+ (1.079 Å) replacing the larger Sr2+ ion (1.26 Å). As a result, the Bragg peak shifts towards a higher diffraction angle with an increase in Sm3+ concentration, as shown in Fig. S1 (ESI†). Consequently, the lattice parameter decreases from 12.654(1) Å (SNMV) to 12.652(1) Å (SNMV:0.05Sm) and 12.644(8) Å (SNMV:0.12Sm) respectively.22 The Rietveld refinement and crystallographic parameters of SNMV:0.12Sm3+ are tabulated in Table S2 (ESI†).
d (230, Oh10) space group and the Rietveld refinement pattern of SNMV:0.05Sm3+ is given in Fig. 1(b). All the compositions are of single-phase and isostructural with Sr2NaMg2V3O12 (ICDD file No. 00-024-1131). It is confirmed that substituting Sm3+ into the dodecahedral site does not change the crystallinity of the samples. Compared with the general stoichiometry, A3B2C3O12, Sr2+, and Na+ occupy the dodecahedral site (24c) with 2/3 and 1/3 occupancy to form Sr/NaO8 dodecahedra. The octahedral site (16a) is occupied by Mg2+, the tetrahedral site (24d) by V5+ ions, and oxygen ions in the general sites (96h). The lanthanide ion Sm3+ is substituted onto the dodecahedral site. The refined unit cell parameters and crystallographic data of the Sr1.9Sm0.05Na1.05Mg2V3O12 phosphor are tabulated in Table S1 (ESI†). The obtained reliability parameters confirm the occupancy of Sm3+ in the dodecahedral site. The Sr1.9Sm0.05Na1.05Mg2V3O12 system has a lattice parameter of 12.652(1) Å, respectively. Further, it can be noted that lattice contraction takes place owing to the smaller ionic radii of Sm3+ (1.079 Å) replacing the larger Sr2+ ion (1.26 Å). As a result, the Bragg peak shifts towards a higher diffraction angle with an increase in Sm3+ concentration, as shown in Fig. S1 (ESI†). Consequently, the lattice parameter decreases from 12.654(1) Å (SNMV) to 12.652(1) Å (SNMV:0.05Sm) and 12.644(8) Å (SNMV:0.12Sm) respectively.22 The Rietveld refinement and crystallographic parameters of SNMV:0.12Sm3+ are tabulated in Table S2 (ESI†).
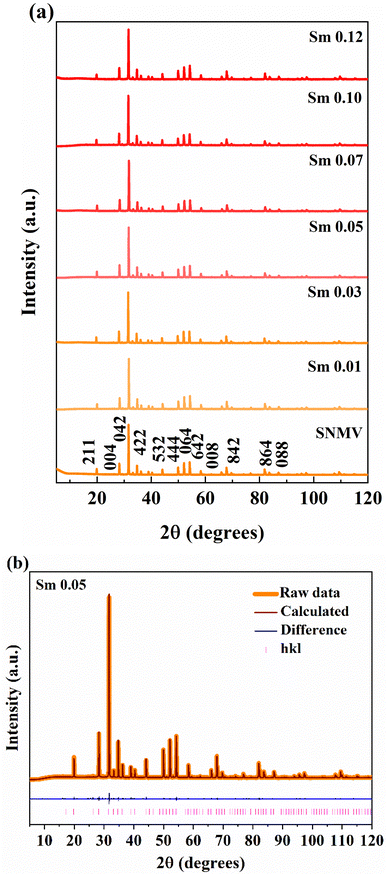 | ||
| Fig. 1 (a) XRD patterns of SNMV:Sm3+ (x = 0, 0.01, 0.03, 0.05, 0.07, 0.10, and 0.12) and (b) Rietveld refinement pattern of SNMV:0.05Sm3+. | ||
3.2 Raman spectra
Fig. 2(a) shows Raman spectra of SNMV:xSm3+ (x = 0, 0.01, 0.03, 0.05, 0.07, 0.10, and 0.12). High and low-frequency bands correspond to internal and external vibrations.42,43 The intense bands among internal vibrations are the symmetric stretching (υ1) and bending vibrations (υ2) of the O–V–O bond centered at 834 and 333 cm−1. External vibrations include liberation and translation modes in the range 200–300 cm−1. Based on the correlation method, 98 vibrational modes are predicted for the Bravais cell of the garnet structure with the space group Ia![[3 with combining macron]](https://www.rsc.org/images/entities/char_0033_0304.gif) d and are given by
d and are given by| Γg (total) = 3A1g + 5A2g + 8 Eg + 14F1g + 14F2g + 5A1u + 5A2u + 10Eu + 18 F1u + 16F2u | (1) |
Γg (Ia![[3 with combining macron]](https://www.rsc.org/images/entities/char_0033_0304.gif) d) = 3A1g + 8Eg + 14F2g d) = 3A1g + 8Eg + 14F2g | (2) |
![[3 with combining macron]](https://www.rsc.org/images/entities/char_0033_0304.gif) d. Based on this, the band assignments are done and are tabulated in Table S3 (ESI†). Compared with the Eu3+ based SNMV system,23 a red shift in the Raman modes is observed for the Sm3+ system. For the SNMV:Sm3+ system, it can be noted that from the Raman spectra shown in Fig. 2, the maximum phonon energy is 834 cm−1, corresponding to the symmetric stretching (υ1) of O–V–O bonds. Nevertheless, the maximum phonon energy of SNMV:Eu3+ is 844 cm−1.23 The red shift of Raman modes in the Sm3+ system might be due to the weaker ionic bond strength owing to the relatively lower electronegativity of Sm3+ (1.377) compared to Eu3+ (1.356) in eight coordination.44 The reduced number of Raman modes might be due to the polycrystalline nature, overlap of modes and low resolution of the instrument.
d. Based on this, the band assignments are done and are tabulated in Table S3 (ESI†). Compared with the Eu3+ based SNMV system,23 a red shift in the Raman modes is observed for the Sm3+ system. For the SNMV:Sm3+ system, it can be noted that from the Raman spectra shown in Fig. 2, the maximum phonon energy is 834 cm−1, corresponding to the symmetric stretching (υ1) of O–V–O bonds. Nevertheless, the maximum phonon energy of SNMV:Eu3+ is 844 cm−1.23 The red shift of Raman modes in the Sm3+ system might be due to the weaker ionic bond strength owing to the relatively lower electronegativity of Sm3+ (1.377) compared to Eu3+ (1.356) in eight coordination.44 The reduced number of Raman modes might be due to the polycrystalline nature, overlap of modes and low resolution of the instrument.
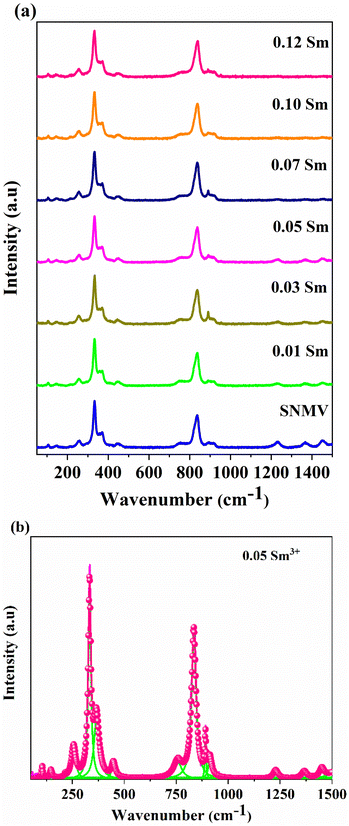 | ||
| Fig. 2 (a) Raman spectra of Sr2NaMg2V3O12: xSm3+ (x = 0, 0.01, 0.03, 0.05, 0.07, 0.10 and 0.12), and (b) deconvoluted Raman spectra of SNMV: 0.05 Sm3+. | ||
3.3 Diffuse reflectance spectra
The diffuse reflectance spectra of the host, 0.05 and 0.12Sm3+ are shown in Fig. 3(a). A strong absorption in the UV region is noted in both phosphors owing to LMCT from 2p orbitals of O2− to 3d orbitals of V5+. In addition, the absorption band at 405 nm due to the 6H5/2 → 4F7/2 transition of Sm3+ becomes conspicuous at a higher concentration of 0.12 mol Sm3+.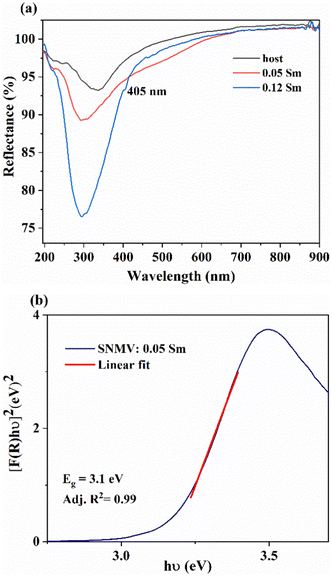 | ||
| Fig. 3 (a) The DRS spectra of the SNMV host and SNMV: 0.05 and 0.12 Sm3+ phosphors and (b) the bandgap of SNMV: 0.05 Sm3+ calculated using the Kubelka–Munk function. | ||
The optical band gap of Sm3+-activated SNMV is calculated using the Kubelka Munk function45 given by
 | (3) |
For direct band transition, the bandgap can be estimated as follows:
| [F(R∞)hυ]2 ∝ (hυ − Eg) | (4) |
3.4 Photoluminescence spectra
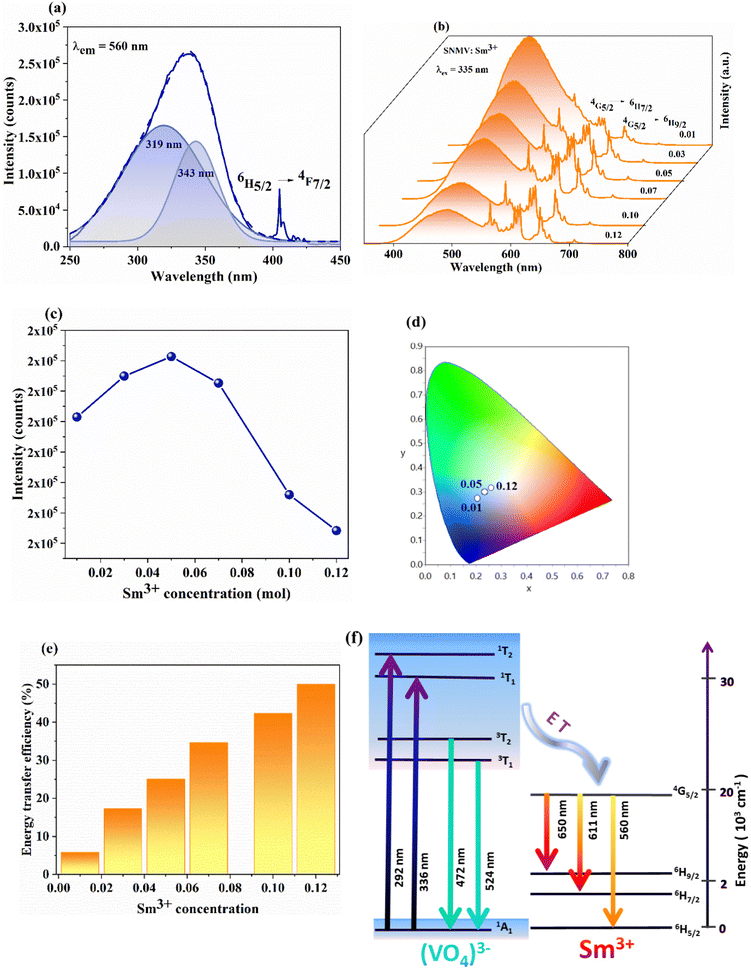
The photoluminescence excitation (PLE) and photoluminescence emission (PL) spectra of Sm3+-activated SNMV phosphors are shown in Fig. 4(a) and (b), whereas PLE and PL spectra of host-SNMV are provided in Fig. S2 (ESI†). The excitation spectra present a characteristic excitation band of VO43− due to 1A1 → 1T2 and 1A1 → 1T1 transitions with maxima at 335 nm and f–f excitation of Sm3+ at 405 nm. The emission band consists of broad vanadate emission due to 3T2 → 1A1 and 3T1 → 1A1 transitions with maxima at 495 nm and emission from energy levels of Sm3+. The main bands of Sm3+ are obtained at 560, 611, and 650 nm, corresponding to 4G5/2 → 6H5/2, 6H7/2, and 6H9/2 transitions, respectively. A decrease in VO43− emission with Sm3+ concentration is noted. However, the intensity of the Sm3+ band increases with the concentration, in which the maximum intensity is obtained at 0.05Sm3+ (Fig. 4(c)). The CIE coordinate of the SNMV:Sm3+ exhibits a shift from cyan to the white region with an increase in Sm3+ concentration, in which CIE coordinates corresponding to the optimum concentration, SNMV:0.05Sm3+, are (0.234, 0.298), as shown in Fig. 4(d). The transit of CIE coordinates is tabulated in Table S4 (ESI†). Also, the internal quantum efficiency of the optimum concentration is measured to be 32%. Further, decay curves of SNMV:Sm3+ are recorded as indicated in Fig. S3 (ESI†). The decay curves are fitted using the mono exponential function given by| I(t) = Ae−t/τ | (5) |
Based on the concentration-dependent decay curves, the energy transfer efficiency is calculated as follows:
 | (6) |
 | (7) |
 | (8) |
3.5 Thermographic properties
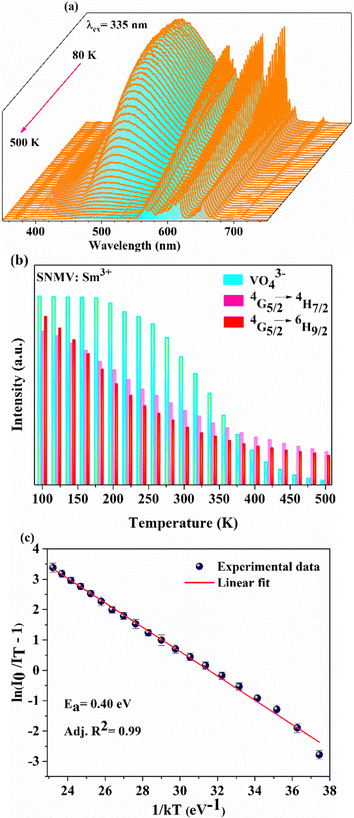
Temperature-dependent PL spectra of SNMV:0.05Sm3+ under the host excitation at 335 nm are recorded to analyse the response of emission intensity with temperature in the range of 80–500 K, as depicted in Fig. 5(a). A decrease in emission intensity with an increase in temperature due to thermal quenching is noted. It can be observed from the histogram in Fig. 5(b) that VO43− and Sm3+ emission follows distinct thermal response, in which vanadate follows a rapid fall in intensity compared to Sm3+. The PL emission intensity varies in accordance with the Arrhenius equation given by | (9) |
 | (10) |
| FIR= B + C × exp (−ΔE/kT) | (11) |
Since two prominent emission bands of Sm3+ exist at 611 and 650 nm, corresponding to 4G5/2 → 6H7/2 and 6H9/2 transitions, respectively, the FIR method is employed for two combinations –  and
and  .
.
The integrated wavelengths of VO43− and Sm3+ bands are considered for calculating the intensity ratio. The temperature-sensing properties of the phosphor are evaluated by deducing temperature sensitivities. Relative temperature sensitivity, Sr, can be calculated using
 | (12) |
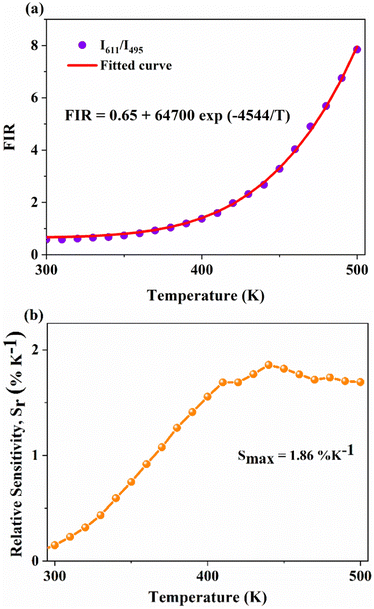
On the other hand, the combination based on the 650 nm band yields an improved temperature sensitivity of 2.01% K−1 at 440 K, as shown in Fig. 7(a) and (b). Moreover, an average temperature uncertainty of ±1.0 K is observed between theoretical and calculated temperatures based on the expression
 | (13) |
 | (14) |
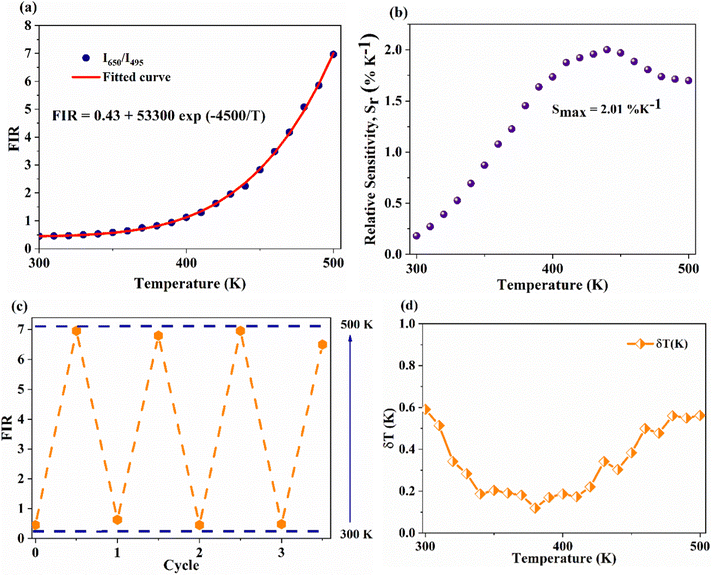 | ||
Fig. 7 (a) and (b) Variation of FIR and relative sensitivity, Sr with temperature, (c) temperature cycling of FIR, and (d) the temperature resolution in the temperature range 300–500 K. and relative sensitivity, Sr with temperature, (c) temperature cycling of FIR, and (d) the temperature resolution in the temperature range 300–500 K. | ||
Further, temperature resolution, δT, defined as the smallest temperature readout possible from the sensor, can be deduced as52
 | (15) |
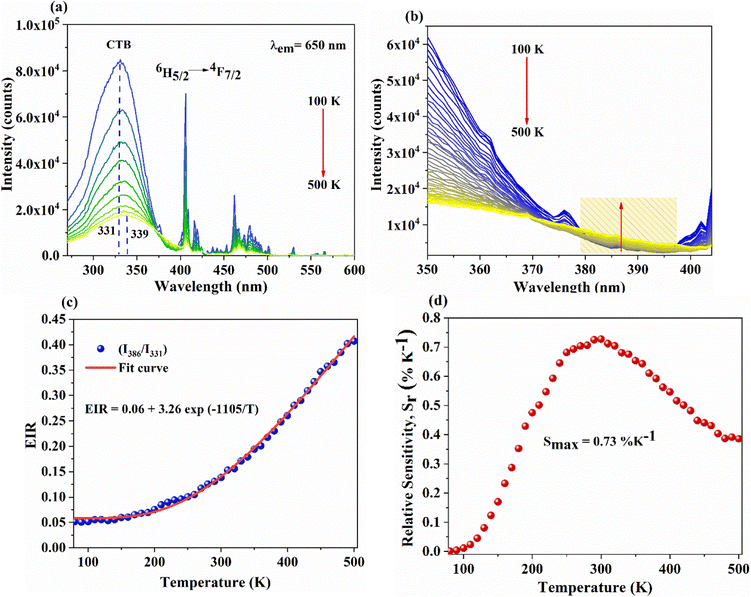
In addition, a slight red shift of the CTB is noted from the temperature-dependent excitation spectra of SNMV:0.05Sm3+. Fig. 8(a) shows the temperature dependent photoluminescence excitation (TDPLE) spectra monitoring the emission at 560 nm from the Sm3+ levels in the range 100–500 K. A red shift from the CTB maxima from 331 to 339 nm is noted with an increase in temperature from 100 to 500 K, respectively. It can be seen that the CTB and 4f excitation levels of Sm3+ decrease with temperature rise. However, the CTB edge around 386 nm exhibits a negative thermal quenching, as shown in Fig. 8(b).
This can be explained due to the rise in the thermal population of higher vibrational levels of the ground electronic energy level by the electrons at elevated temperatures. After occupying higher vibrational states, relatively less amount of energy is needed for the electrons to transit to higher electronic states as part of the absorption process, resulting in the redshift and subsequent negative thermal quenching.23,53,54 Hence, the intensity ratio I386/I331 involving positive and negative thermal quenching of CTB maxima and CTB edge at 331 and 386 nm is calculated and fitted using eqn (11). The plot showing the variation of excitation intensity ratio (EIR) with temperature is shown in Fig. 8(c). Based on the fit parameters, relative temperature sensitivity is calculated and is depicted in Fig. 8(d). A maximum relative temperature sensitivity of 0.73% K−1 is obtained at 300 K. These results imply the suitability of intensity variations in emission and excitation spectra for temperature sensing applications. The Sm3+ activated SNMV system based on the FIR method involving the ratio of emission from the host and Sm3+ exhibits improved sensitivity compared to the CTB method. Also, it can be noted that the Sm3+ based SNMV system gives better temperature sensitivity than the Eu3+ counterpart. A comparison of relative temperature sensitivities of reported phosphors is tabulated in Table 1, in which the present system based on the FIR method exhibits better sensitivity. Thus, the FIR method based on the ratio of emission, I650/I495, of the SNMV:Sm3+ phosphor has the potential to be used in optical thermometry applications.
| Phosphors | Temperature (K) | S r (% K−1) | Ref. |
|---|---|---|---|
| Na3Sc2P3O12:Eu2+/Mn2+ | 293–473 | 1.556 | 55 |
| Y2MgTiO6:Mn4+ | 10–513 | 0.14 | 56 |
| Ba3(VO4)2:Sm3+ | 303–463 | 2.24 | 17 |
| LiCa3ZnV3O12:Sm3+ | 303–463 | 1.8 | 57 |
| Ca3LiMgV3O12:Sm3+ | 303–513 | 1.99 | 58 |
| BaGd2O4:Bi3+/Sm3+ | 293–473 | 1.11 | 59 |
| LaNbO4:Bi3+/Eu3+ | 303–483 | 1.89 | 60 |
| LaNbO4:Bi3+/Tb3+ | 303–483 | 2.36 | 60 |
| Sr3Y2Ge3O12:Bi3+/Sm3+ | 298–498 | 0.61 | 61 |
| Ca2NaMg2V3O12:Sm3+ | 303–503 | 1.889 | 62 |
| Ca2NaMg2V3O12:Eu3+ | 303–503 | 1.686 | 62 |
| Sr2NaMg2V3O12:Eu3+ | 300–500 | 1.61 | 23 |
| Sr2NaMg2V3O12:Sm3+ | 200–500 | 0.73 | This work (CTB) |
| Sr2NaMg2V3O12:Sm3+ | 300–500 | 2.01 | This work (FIR) |
 | (16) |
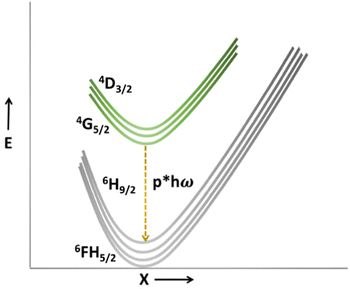
Thermal quenching of VO43− does not exhibit significant variation in the SNMV:Sm3+ with that of SNMV:Eu3+ systems. However, variation can be anticipated from the RE3+, which prefers a slow thermal quenching. The improved sensitivity of the Sm3+ based SNMV system is likely due to the lesser non-radiative transitions associated with Sm3+ than Eu3+ levels. Generally, RE3+ prefers a multi-phonon relaxation pathway for thermal quenching. Hence the relative number of phonons required for bridging the energy gap determines the likelihood of thermal quenching behaviour. The relative number of phonons required to bridge the energy gap between the lowest excited state and highest ground state can be estimated using65,66
| p = ΔE/hω | (17) |
On the contrary, the energy gap and highest phonon energy of the Eu3+ system are 12![[thin space (1/6-em)]](https://www.rsc.org/images/entities/char_2009.gif) 500 cm−1 and 844 cm−1, respectively. Due to the higher energy gap and lower phonon energy of the Sm3+ system, lesser non-radiative transitions and slow thermal quenching will be favoured. The diverse thermal response is essential for better relative temperature sensitivity in a dual emitting center-based thermographic phosphor. Since VO43− favours a rapid thermal quenching, lanthanide activator ions should favour a slow thermal quenching. The more distinct the thermal behaviour of dual emitters, the better the relative temperature sensitivity. Hence, the Sm3+ based SNMV system presents a higher relative temperature sensitivity than the Eu3+ counterpart, confirming its potentiality as a better candidate for ratiometric temperature sensing.
500 cm−1 and 844 cm−1, respectively. Due to the higher energy gap and lower phonon energy of the Sm3+ system, lesser non-radiative transitions and slow thermal quenching will be favoured. The diverse thermal response is essential for better relative temperature sensitivity in a dual emitting center-based thermographic phosphor. Since VO43− favours a rapid thermal quenching, lanthanide activator ions should favour a slow thermal quenching. The more distinct the thermal behaviour of dual emitters, the better the relative temperature sensitivity. Hence, the Sm3+ based SNMV system presents a higher relative temperature sensitivity than the Eu3+ counterpart, confirming its potentiality as a better candidate for ratiometric temperature sensing.
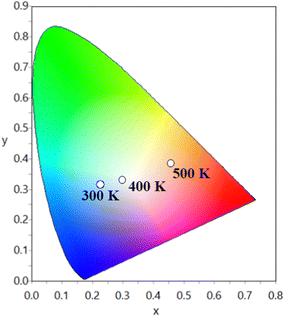
On the contrary, emission from lanthanide activator ions follows a slow thermal quenching, leading to dominant orange-red emission. In short, this favours rapidly changing emission color from cyan to the orange-red region in the Sm3+-based SNMV system.
Since distinct emission color variation is noted for a short temperature difference of 200 K, the SNMV:Sm3+ phosphor is a better thermochromic luminescent material. Hence, thermochromic luminescence of the Sm3+ activated SNMV system can be used for safety sign applications in high temperature environments. A comparison of phosphors reported for safety sign applications is given in Table S5 (ESI†). It can be noted that the Sm3+ based SNMV phosphor exhibits good performance for safety sign application.
3.6 Latent fingerprint detection
Another potential application of phosphors lies in the detection of latent fingerprints. The essential requirement a phosphor should meet for LFP detection is the ability to provide high contrast with low background interference. Based on the better luminescence properties of SNMV:RE3+, the phosphors-SNMV, SNMV:0.15Eu3+, and SNMV:0.05Sm3+, are selected to visualize latent fingerprints. As reported earlier,23 it is evident that the CIE coordinate shifts towards the red region due to the quenching of VO43− emission at higher concentrations of Eu3+ in the SNMV:Eu3+ system. Hence, SNMV:0.15Eu3+ is selected for LFP detection as it can give emission in the red region, thereby offering a good contrast from the background. The excitation maxima of SNMV systems are at 335 nm. Hence, under excitation at 365 nm with a UV lamp, the contribution from the RE3+-based red/orange-red emission is more dominant than the blue-green luminescence of the VO43− complex, which favours SNMV:0.15Eu3+ and SNMV:0.05Sm3+ to emit in the red and yellow region. The PLE and PL spectra of SNMV:0.15Sm3+ are given in Fig. S6 (ESI†). The Rietveld refinement pattern of SNMV:0.15Eu3+ is shown in Fig. S7 (ESI†). The refined unit cell parameters and crystallographic data of the Sr1.7Eu0.15Na1.15Mg2V3O12 phosphor are given in Table S6, respectively. The Rietveld refinement pattern and crystallographic parameters of the host Sr2NaMg2V3O12 are reported earlier by our group.22 Moreover, the internal quantum efficiency of SNMV:0.15Sm3+ and SNMV is 25 and 38%, respectively.The detection of latent fingerprints is carried out via the powder dusting method using a feather brush. A detailed illustration of the powder dusting method is depicted in Fig. S8 (ESI†). LFPs are imaged under 365 nm UV light. Fig. 11(a)–(c) show that LFPs on a glass substrate are highly visualized after the SNMV and SNMV:RE3+ powder treatment. The enhanced visualization of LFPs is due to the better adhesion of phosphor particles on the ridge patterns. LFPs comprise inorganic and organic materials like polypeptides, fatty acids, amino acids, and water. The adhesion of these compounds on the LFPs with these phosphors helps to image LFPs. LFP information can be generally classified into three levels.67 The first level refers to the shape of the ridge patterns, whereas the second level refer to detailed and characteristic information like whorls, islands, deltas, and bifurcations. The intra-ridge details like sweat pores and scars are obtained in the third level.2 The information on the tertiary level is microcosmic to be identified and hence can be distinguished only by enhancing the magnification; they help to get the evidence in the case of deformed fingerprints, where the relative locus of sweat pores is compared in two fingerprints.68,69 Apart from the primary level, secondary and tertiary features of the fingerprint core can also be easily distinguished using present phosphors, which are inevitable for extracting valid information regarding identity characteristics. The substructures including whorls, ridge endings, deltas, bifurcations, islands and sweat pores are clearly distinguishable from the stained LFPs without the aid of any microscopic techniques. Under 365 nm UV excitation, intense red, blue-green, and yellow emission from SNMV:0.15Eu3+, SNMV, and SNMV:0.05Sm3+ causes easier visualization of secondary and tertiary features.
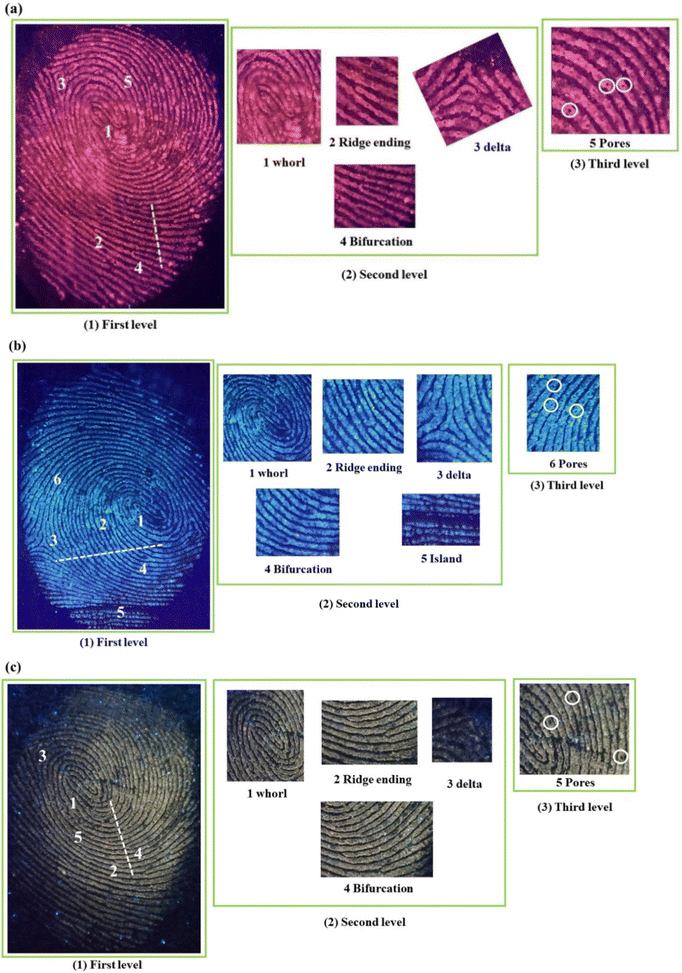 | ||
| Fig. 11 Magnified features of (a) SNMV:Eu3+, (b) SNMV and (c) SNMV:Sm3+-based LFPs on the glass slide. | ||
Moreover, it can be noted from the images that phosphor powders are attached only to the ridges, and grooves are empty. This is confirmed from the pixel profile data obtained for the fluorescent images based on the three systems, as shown in Fig. 12(a)–(c). The area taken for the pixel profile analysis was highlighted in the respective photographs. The fluctuations in the pixel values are in accordance with the profile of ridges and grooves/furrows, where the pixel value took maximum and minimum positions at ridges and grooves, respectively. This proves the excellent selectivity of the phosphor powder over the ridges and furrows of the fingerprint core essential for LFP detection.
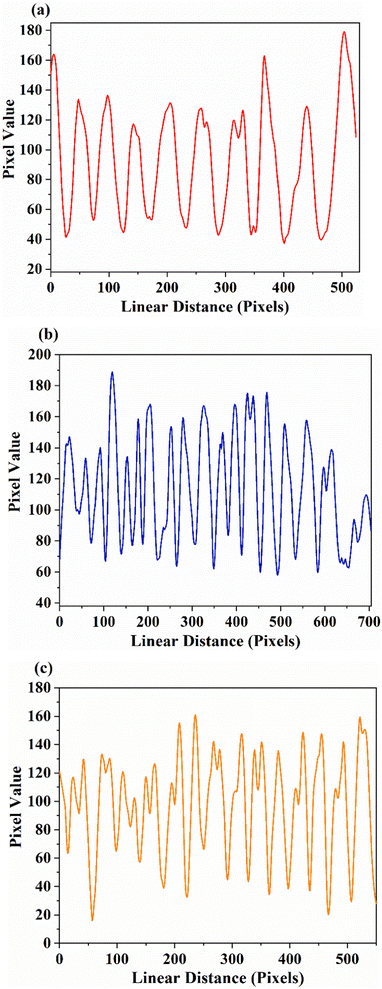 | ||
| Fig. 12 Pixel profile of the selected area of (a) SNMV:Eu3+, (b) SNMV and (c) SNMV:Sm3+-based LFPs on the glass slide. | ||
In addition, the particle size of the phosphors plays a significant role in the visualization of LFPs. The size of the phosphor particles should be smaller for the efficient detection of minute details. The size of particle aggregates and surface morphology of the synthesized phosphors are strongly connected with the luminescence properties, and a strong affinity of phosphor grains for the residues of the fingerprints is necessary for detecting latent fingerprints. For efficient detection of LFPs, the size of the phosphor particles should be smaller than the tiny ridge. On careful analysis of the microstructures of SNMV and SNMV:RE3+ phosphors, as depicted in Fig. S9 (ESI†), it is evident that the particle size of the phosphor is around 5 μm. The particle size distribution histogram of SNMV:0.15Eu3+, SNMV, and SNMV:0.05Sm3+ is shown in Fig. S10 (ESI†). In the current situation, the smaller size of the particles provides an added advantage for better visualization of the finer details up to the third level. Recently, Wang et al. studied LFP detection using microparticles of Sr2MgMoO6 phosphors having a particle size of 1–2 μm2. The average size of the narrow ridge of an adult is around 450 μm. On the other hand, the size of the sweat pore, which is part of the level 3 identification, is about 88–220 μm.70
In this context, the size of the microparticles of SNMV and SNMV:RE3+ (Eu/Sm) phosphors perfectly suits the practical application of latent fingerprint detection. Thus, the reduced size of the microparticles provides an added advantage of SNMV systems for the ease of distinguishing ridges and grooves clearly.
Considering the actual situation in fingerprint extraction, things available in daily life are also used as substrates. Fig. 13 shows the fluorescent images obtained on the Indian rupee coin based on SNMV and SNMV:RE3+ phosphors, along with the image of the stained coin under daylight. The images on the right are the enlarged views of the powder-stained fingerprints. High-definition fluorescence images can be observed along with distinguishable ridge patterns. Apart from the first level information, finer details like whorls and ridge endings can be easily identified under 365 nm UV light, confirming the potentiality of the present phosphors for latent fingerprint detection.
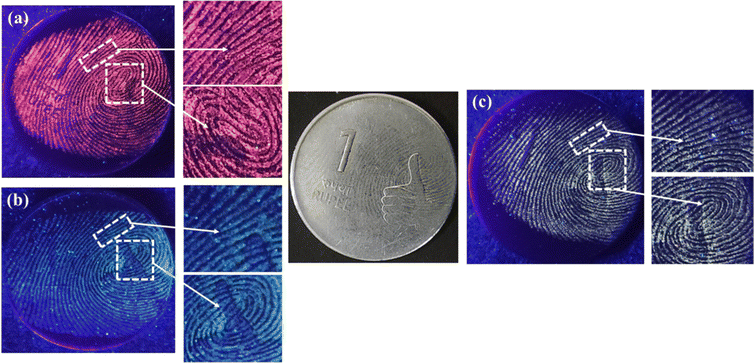 | ||
| Fig. 13 Photographs of (a) SNMV:Eu3+, (b) SNMV, and (c) SNMV:Sm3+ phosphor-stained LFPs on the Indian rupee coin. | ||
Further, applicability of phosphors is tested for various other substrates having diverse porosity, roughness, and background reflectivity. Fig. S11(a1–c4) (ESI†) includes digital photographs of stained LFPs on different substrates – highlighter pen, CD and aluminium foil, under 365 nm UV radiation and under daylight. It is obvious that stained LFPs provide easier distinguishability of ridge patterns under UV excitation compared to daylight. Thus irrespective of the substrates under testing, better visualization of LFPs can be obtained using SNMV and SNMV:RE3+ systems. This proves the potentiality of vanadate garnets in forensic applications. Moreover, the smudged fingerprints are also analysed using the present phosphors, as indicated in Fig. S12 (ESI†). In actual cases, the chances of getting clear fingerprints are less; instead, smudged fingerprints are often encountered in real situations. Hence, evaluation of smudged fingerprints is necessary.
It can be noted that even with overlapping, damaged, or incomplete fingerprints, powder-stained smudged LFPs are easier to distinguish the finer details of ridge substructures. In addition, on comparison with commercial powders such as TiO2 and Fe2O3, the present study based on luminescent powders provides better visualization through intense emission from phosphor-stained LFPs, better sensitivity, and selectivity with high contrast, and reduced background interference, implying the potentiality of the luminescent powder based approach over conventional methods in LFP detection.71,72
Considering the real situation, latent fingerprint detection and analysis can only be done after a certain time. Hence, the efficiency of powder-stained LFPs should be checked after a long duration. The fluorescent images of SNMV and SNMV:RE3+ stained LFPs are obtained after storing them in a dry environment for two months, as depicted in Fig. 14. It can be observed that visible and high-quality fluorescent images of LFPs are still obtained even after a longer duration. Even after aging, the maintenance of well-defined ridge substructures indicates the chemical stability of the phosphors under study. The second-level features, such as bifurcation and deltas, can be identified.
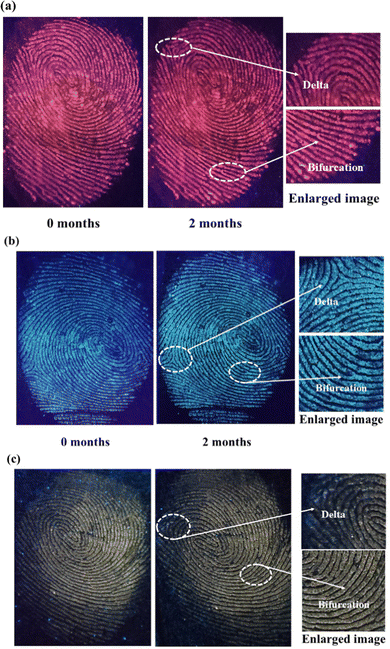 | ||
| Fig. 14 Photographs of (a) SNMV:Eu3+, (b) SNMV, and (c) SNMV:Sm3+ phosphor-stained LFPs after a long duration of storage. | ||
These observations confirm the storage stability of the developed LFPs based on the present phosphors. After a long duration, the water content evaporates from the fingerprints, and only oily substances remain. It has been reported that a detectable quantity of amino acids is present in fingerprints.73 Amino acids have a strong affinity for oxide materials; this adhesion of amino acids on oxide-based phosphors might cause clear visibility even after aging. In summary, SNMV and SNMV:Eu3+/Sm3+ based phosphors exhibit potential application in latent fingerprint detection, open new avenues, and prove that vanadate garnets have a long way ahead in the field of latent fingerprint detection.
3.7 Security inks for anticounterfeiting
In addition, SNMV, SNMV:0.15Eu3+, and SNMV:0.05Sm3+ phosphors are tested for anticounterfeiting markers via developing security inks. Counterfeiting is one of the areas where fluorescent phosphors can be employed, which helps to distinguish real from fake. Since these phosphor systems provide fluorescence only under UV excitation, they can be used for detecting counterfeiting. This is the first time that a study on anticounterfeiting inks has been reported based on vanadate garnets. The security inks are developed by dispersing the respective phosphor powders in the PVA solution. The viscosity of the security ink can be varied by varying the weight percentage of the PVA solution. The photographs of the university emblem developed using viscous inks based on the studied phosphors under 365 nm excitation and under daylight are depicted in Fig. 15. It is obvious that no fluorescence can be noted under daylight. The emblems illuminated under 365 nm UV excitation exhibit intense red, blue-green, and yellow emission corresponding to SNMV:0.15Eu3+, SNMV, and SNMV:0.05Sm3+, respectively. The strong fluorescence emission from phosphors shows the testimony of the potential application of vanadate phosphors in security inks. | ||
| Fig. 15 Emblem of the University of Kerala illuminated under UV radiation at 365 nm using (a) SNMV:Eu3+, (b) SNMV, (c) SNMV:Sm3+ phosphors, and (d) under natural light. | ||
Further, Fig. 16(a)–(d) shows the images of dip pen writing of the acronym of the University of Kerala. In this case, the ink with comparatively high fluidity is prepared by taking a low weight percentage of PVA solution. The potentiality of the developed security inks in anticounterfeiting is analysed by marking security labels on the Indian currency note, as depicted in Fig. 16(e) and (f). The distinct red, blue-green, and yellow fluorescent markings corresponding to SNMV:0.15Eu3+, SNMV, and SNMV:0.05Sm3+, respectively, can be noted under UV excitation. The markings using security inks are visible only under UV excitation, which tells the authenticity of the synthesized security inks in anticounterfeiting, and helps in safeguarding documents, and fraud detection like duplication of currency notes and documents. In this manner, the synthesized security inks can be employed in advanced secret markings or codes in currencies, products and confidential documents. Thus, security inks based on vanadate garnets can be applied for advanced strategies to restrict counterfeiting. Compared with other reported phosphors, including fluorides, lead-free halide perovskites, and carbon quantum dots for fluorescent ink applications,38–40 SNMV-based phosphors exhibit better performance. Further preparation of practical fluorescent offset printing inks will be carried out as future work. In short, these phosphors open new avenues for the class of vanadate garnets to enter into the security ink, which is essential for the modern anti-counterfeiting printing technology for the preparation of security documents.
4. Conclusions
In summary, the present work deals with the multifunctional applications of SNMV and SNMV:RE3+ (Eu3+/Sm3+) systems in latent fingerprint detection, ratiometric temperature sensing, and as security inks for anticounterfeiting for the first time. To begin with, the photoluminescence properties of the dual emitting SNMV:Sm3+ system are studied in detail. Under UV excitation at 335 nm, the dual emission from VO43− and Sm3+ is obtained. Moreover, energy transfer from the VO43− complex to Sm3+ is confirmed. The optimum concentration is found to be 0.05 mol with the CIE coordinate (0.234, 0.298) and an internal quantum efficiency of 32%. A diverse thermal quenching is observed based on the distinct thermal response of VO43− and Sm3+. The fluorescence intensity ratio method is used to investigate the temperature sensing properties. A maximum relative temperature sensitivity of 2.01%/K is obtained at 440 K, along with an average temperature uncertainty of ±1.0 K between theoretical and calculated temperatures. A high repeatability of 95% and a temperature resolution of <0.7 K are noted. Further, the mechanism of thermal quenching is comprehensively studied. A thermochromic luminescence shift from cyan (0.263, 0.352) to the orange-red (0.504, 0.408) region is observed with a rise in temperature from 300 to 500 K, necessary for safety sign applications in high-temperature environments. In addition, the prospects of SNMV, SNMV:0.15Eu3+, and SNMV:0.05Sm3+ phosphors are investigated for latent fingerprint detection via the powder dusting method, for the first time in vanadate garnets. The fluorescent images of powder-stained LFPs provide good contrast from the background. Under illumination with 365 nm UV radiation, clear visualization of ridge patterns is obtained, confirming that powders are present only on the ridges and empty grooves through pixel profile data. Apart from the first level, secondary and tertiary level details, including sweat pores, deltas, and bifurcations, can be easily obtained using the present phosphors. Further, successful detection of LFPs in things available in daily life is also carried out. In addition, the efficiency of powder-stained LFPs is verified after a long duration of storage. These indicate that phosphors – SNMV, SNMV:0.15Eu3+, and SNMV:0.05Sm3+, have great potential for latent fingerprint detection. Further, the potentiality of the above phosphors is successfully tested and verified for security ink application. The ability of developed inks to secure documents by providing better hiddenness in daylight and strong fluorescence under UV radiation necessary for anticounterfeiting labels is verified. In a nutshell, the potentiality of vanadate garnets in multifaceted applications is evident through the present study, which accelerates further research in this direction.Author contributions
The manuscript was written through contributions of all authors. All authors have given approval to the final version of the manuscript. S. G. designed the work; A. B. executed the experimental work and wrote the manuscript in discussion with S. G. and J. I. N.Conflicts of interest
There are no conflicts to declare.Acknowledgements
Amrithakrishnan Bindhu acknowledges the Department of Science and Technology (DST), Govt. of India, for the award of INSPIRE Senior Research Fellowship (DST/INSPIRE Fellowship/2017/[IF170717]). The authors also acknowledge the Central Laboratory for Instrumentation and Facilitation (CLIF) of the University of Kerala for the instrumentation support and KSCSTE KSYSA RG scheme (948/2019/KSCSTE). The authors also acknowledge the DST-PURSE program of the University of Kerala.References
- C. Wang, J. Zhou, L. Lulu and Q. Song, Part. Part. Syst. Charact., 2018, 35, 1700387 CrossRef.
- Y. Wang, Y. Ke, S. Chen, J. Luo, S. Shu, J. Gao, B. Deng and R. Yu, J. Colloid Interface Sci., 2021, 583, 89 CrossRef CAS PubMed.
- S. van Herwaarden, Sens. Mater., 1996, 8, 373 CAS.
- W. Liu and B. Yang, Sens. Rev., 2007, 27, 298 CrossRef.
- C. Y. Morassuti, L. A. O. Nunes, S. M. Lima and L. H. C. Andrade, J. Lumin., 2018, 193, 39 CrossRef CAS.
- S. Das, S. Som, C. Y. Yang, S. Chavhan and C. H. Lu, Sci. Rep., 2016, 6, 1 CrossRef PubMed.
- C. D. S. Brites, P. P. Lima, N. J. O. Silva, A. Millán, V. S. Amaral, F. Palacio and L. D. Carlos, Nanoscale, 2012, 4, 4799 RSC.
- L. H. Fischer, G. S. Harms and O. S. Wolfbeis, Angew. Chem., Int. Ed., 2011, 50, 4546 CrossRef CAS PubMed.
- M. D. Dramićanin, Methods Appl. Fluoresc., 2016, 4, 042001 CrossRef PubMed.
- X. D. Wang, O. S. Wolfbeis and R. J. Meier, Chem. Soc. Rev., 2013, 42, 7834 RSC.
- X. Shi, M. Zhang, X. Lu, Q. Mao, L. Pei, H. Yu, J. Zhang, M. Liu and J. Zhong, Mater. Today Chem., 2023, 27, 101264 CrossRef CAS.
- B. Zhao, Y. Chen, Y. Xue, Q. Mao, G. Bai, M. Liu and J. Zhong, Mater. Des., 2023, 227, 111802 CrossRef CAS.
- F. Huang and D. Chen, J. Mater. Chem. C, 2017, 5, 5176 RSC.
- D. Chen, S. Liu, Z. Wan and Z. Ji, J. Phys. Chem. C, 2016, 120, 21858 CrossRef CAS.
- S. C. Lal, J. I. Naseemabeevi and S. Ganesanpotti, J. Sci. Adv. Mater. Dev., 2023, 8, 100544 Search PubMed.
- A. K. Sreelekshmi, S. C. Lal and S. Ganesanpotti, J. Alloys Compd., 2022, 905, 164138 CrossRef CAS.
- P. Du, Y. Hua and J. S. Yu, Chem. Eng. J., 2018, 352, 352 CrossRef CAS.
- J. Xue, H. M. Noh, B. C. Choi, S. H. Park, J. H. Kim, J. H. Jeong and P. Du, Chem. Eng. J., 2020, 382, 122861 CrossRef CAS.
- E. Pavitra, G. S. R. Raju, J. Y. Park, L. Wang, B. K. Moon and J. S. Yu, Sci. Rep., 2015, 5, 1 Search PubMed.
- L. K. Bharat, S. K. Jeon, K. G. Krishna and J. S. Yu, Sci. Rep., 2017, 7, 1 CrossRef CAS PubMed.
- T. Hasegawa, Y. Abe, A. Koizumi, T. Ueda, K. Toda and M. Sato, Inorg. Chem., 2018, 57, 857 CrossRef CAS PubMed.
- A. Bindhu, J. I. Naseemabeevi and S. Ganesanpotti, Inorg. Chem., 2023, 62, 5744 CrossRef CAS PubMed.
- A. Bindhu, J. I. Naseemabeevi and S. Ganesanpotti, Adv. Photon. Res., 2022, 3, 2100159 CrossRef CAS.
- H. Xie, T. Tsuboi, W. Huang, Y. Huang, L. Qin and H. J. Seo, J. Am. Ceram. Soc., 2014, 97, 1434 CrossRef CAS.
- A. Bindhu, J. I. Naseemabeevi and S. Ganesanpotti, Crit. Rev. Solid State Mater. Sci., 2021, 47, 621 CrossRef.
- A. Bindhu, A. S. Priya, J. I. Naseemabeevi and S. Ganesanpotti, J. Alloys Compd., 2022, 893, 162246 CrossRef CAS.
- A. Bindhu, J. I. Naseemabeevi and S. Ganesanpotti, J. Sci. Adv. Mater. Dev., 2022, 7, 100444 CAS.
- J. Li, B. Liu, G. Liu, Q. Che, Y. Lu and Z. Liu, J. Rare Earths, 2022 DOI:10.1016/j.jre.2022.08.022.
- G. S. Sodhi and J. Kaur, Forensic Sci. Int., 2001, 120, 172 CrossRef CAS PubMed.
- J. Lee, M. Pyo, S. H. Lee, J. Kim, M. Ra, W. Y. Kim, B. J. Park, C. W. Lee and J. M. Kim, Nat. Commun., 2014, 5, 1 Search PubMed.
- M. Saif, M. Shebl, A. I. Nabeel, R. Shokry, H. Hafez, A. Mbarek, K. Damak, R. Maalej and M. S. A. Abdel-Mottaleb, Sens. Actuators, B, 2015, 220, 162 CrossRef CAS.
- H. C. Lee and R. Gaensslen, Advances in Fingerprint Technology. Advances in Fingerprint Technology, Second edn, 2001 Search PubMed.
- A. Sandhyarani, M. K. Kokila, G. P. Darshan, R. B. Basavaraj, B. Daruka Prasad, S. C. Sharma, T. K. S. Lakshmi and H. Nagabhushana, Chem. Eng. J., 2017, 327, 1135 CrossRef CAS.
- M. Wang, M. Li, A. Yu, J. Wu and C. Mao, ACS Appl. Mater. Interfaces, 2015, 7, 28110 CrossRef CAS PubMed.
- H. Li, H. K. Yang, B. K. Moon, B. C. Choi, J. H. Jeong, K. Jang, H. S. Lee and S. S. Yi, J. Alloys Compd., 2011, 509, 8788 CrossRef CAS.
- A. Hooda, S. P. Khatkar, A. Khatkar, R. K. Malik, M. Kumar, S. Devi and V. B. Taxak, J. Lumin., 2020, 217, 116806 CrossRef CAS.
- J. Shao, J. Yan, X. Li, S. Li and T. Hu, Dyes Pigm., 2019, 160, 555 CrossRef CAS.
- W. Xu, Y. Yang and J. Sun, Adv. Mater. Res., 2011, 174, 393 CAS.
- F. Zhang, Z. Zhao, B. Chen, H. Zheng, L. Huang, Y. Liu, Y. Wang and A. L. Rogach, Adv. Opt. Mater., 2020, 8, 1901723 CrossRef CAS.
- R. Bao, Z. Chen, Z. Zhao, X. Sun, J. Zhang, L. Hou and C. Yuan, Nanomaterials, 2018, 8, 386 CrossRef PubMed.
- J. S. Revathy, M. Abraham, G. Jagannath, D. N. Rajendran and S. Das, J. Colloid Interface Sci., 2023, 641, 1014 CrossRef CAS PubMed.
- A. Rulmont, P. Tarte and J. Choisnet, Spectrochim. Acta, Part A, 1992, 48, 921 CrossRef.
- I. L. Botto, E. J. Baran and L. L. Fournier, Anales Asoc. Quim. Argent, 1982, 70, 479 CAS.
- K. Li and D. Xue, J. Phys. Chem. A, 2006, 110, 11332 CrossRef CAS PubMed.
- A. E. Morales, Revista Mexicana de Fisica, 2007, 53, 18 CAS.
- S. P. Ghorpade, R. H. Krishna, R. M. Melavanki, V. Dubey and N. R. Patil, Optik, 2020, 208, 164533 CrossRef CAS.
- S. C. Lal, J. I. Naseemabeevi and S. Ganesanpotti, Mater. Adv., 2021, 2, 1328 RSC.
- G. Blasse, Philips Res. Rep., 1969, 24, 131 CAS.
- L. G. van Uitert and L. F. Johnson, J. Chem. Phys., 1966, 44, 3514 CrossRef CAS.
- M. D. Dramićanin, J. Appl. Phys., 2020, 128, 040902 CrossRef.
- H. Lv, P. Du, L. Luo and W. Li, Mater. Adv., 2021, 2, 2642 RSC.
- C. D. S. Brites, K. Fiaczyk, J. F. C. B. Ramalho, M. Sójka, L. D. Carlos and E. Zych, Adv. Opt. Mater., 2018, 6, 1701318 CrossRef.
- S. Zhou, C. Duan and S. Han, Dalton Trans., 2018, 47, 1599 RSC.
- D. Duan, Y. Wang, S. Jiang, L. Li, G. Xiang, X. Tang, Y. Li and X. Zhou, J. Lumin., 2019, 215, 116636 CrossRef CAS.
- X. Zhang, Z. Zhu, Z. Guo, Z. Sun and Y. Chen, Chem. Eng. J., 2019, 356, 413 CrossRef CAS.
- P. Cai, L. Qin, C. Chen, J. Wang, S. Bi, S. I. Kim, Y. Huang and H. J. Seo, Inorg. Chem., 2018, 57, 3073 CrossRef CAS PubMed.
- H. Guo, B. Devakumar, R. Vijayakumar, P. Du and X. Huang, RSC Adv., 2018, 8, 33403 RSC.
- J. Q. Chen, J. Y. Chen, W. N. Zhang, S. J. Xu, L. P. Chen and H. Guo, Ceram. Int., 2023, 49, 16252 CrossRef CAS.
- J. Fu, L. Zhou, Y. Chen, J. Lin, R. Ye, D. Deng, L. Chen and S. Xu, J. Alloys Compd., 2022, 897, 163034 CrossRef CAS.
- J. Xue, Z. Yu, H. M. Noh, B. R. Lee, B. C. Choi, S. H. Park, J. H. Jeong, P. Du and M. Song, Chem. Eng. J., 2021, 415, 128977 CrossRef CAS.
- R. Sun, X. Wei, H. Yu, P. Chen, H. Ni, J. Li, J. Huo, J. Zhou and Q. Zhang, Dalton Trans., 2023, 52, 2825 RSC.
- H. Zhou, N. Guo, X. Lü, Y. Ding, L. Wang, R. Ouyang and B. Shao, J. Lumin., 2020, 217, 116758 CrossRef CAS.
- R. Han, B. Han, D. H. Wang and C. Li, Appl. Phys. Lett., 2011, 99, 011912 CrossRef.
- S. Anand, P. Verma, K. P. Jain and S. C. Abbi, Phys. B, 1996, 226, 331 CrossRef CAS.
- M. G. Nikolić, D. J. Jovanović and M. D. Dramićanin, Appl. Opt., 2013, 52, 1716 CrossRef PubMed.
- R. P
![[a with combining cedilla]](https://www.rsc.org/images/entities/char_0061_0327.gif) zik, K. Zawisza, A. Watras, K. Maleszka-Bagińska, P. Boutinaud, R. Mahiou and P. J. Dereń, J. Mater. Chem., 2012, 22, 22651 RSC.
zik, K. Zawisza, A. Watras, K. Maleszka-Bagińska, P. Boutinaud, R. Mahiou and P. J. Dereń, J. Mater. Chem., 2012, 22, 22651 RSC. - J. Liang, Y. Wu, X. Gong and A. Vomiero, J. Mater. Chem. C, 2021, 9, 1746 RSC.
- A. Jain, Y. Chen and M. Demirkus, ICPR’06: Proceedings of the 18th International Conference on Pattern Recognition, 2006, 4, 477 Search PubMed.
- J. Lai, Z. Long, J. Qiu, D. Zhou, Q. Wang, Y. Yang, S. Hu, Z. Wang and K. Zhang, RSC Adv., 2020, 10, 8233 RSC.
- J. Y. Park, S. J. Park, M. Kwak and H. K. Yang, J. Lumin., 2018, 201, 275 CrossRef CAS.
- D. Navami, R. B. Basavaraj, S. C. Sharma, B. Daruka Prasad and H. Nagabhushana, J. Alloys Compd., 2018, 762, 763 CrossRef CAS.
- D. Muniswamy, H. Nagabhushana, R. B. Basavaraj, G. P. Darshan and D. Prasad, ACS Sustainable Chem. Eng., 2018, 6, 5214 CrossRef CAS.
- L. K. Bharat, G. S. R. Raju and J. S. Yu, Sci. Rep., 2017, 7, 1 CrossRef CAS PubMed.
Footnote |
| † Electronic supplementary information (ESI) available. See DOI: https://doi.org/10.1039/d3ma00241a |
| This journal is © The Royal Society of Chemistry 2023 |

