 Open Access Article
Water-soluble ferrous metallacage combined with oxaliplatin for a synergistic chemo/chemodynamic therapy†
Jing
He‡
,
Wei
He‡
,
Run
Wang
,
Jingjing
Jiao
 * and
Shiping
Yang
 *
*
College of Chemistry and Materials Science, Shanghai Frontiers Science Center of Biomimetic Catalysis, Shanghai Normal University, Shanghai 200234, China. E-mail: jiaojj@shnu.edu.cn; shipingy@shnu.edu.cn
First published on 31st July 2023
Abstract
We designed and synthesized a nanoplatform for chemotherapy (CT) combined with enhanced chemodynamic therapy (CDT). A self-assembly of FM@OXA-PEG was formed by a water-soluble and amphipathic ferrous metallacage (FM), hydrophilic copolymer (PEG2000-COOH) and oxaliplatin (OXA). The FM proved to be an excellent Fenton reaction catalyst and a potential CDT agent. OXA can not only act as an anti-tumor drug but also activate intracellular nicotinamide adenine dinucleotide phosphate oxidase (NOX) and superoxide dismutase (SOD) to produce H2O2, enhancing the CDT effect and realizing synergistic CT and CDT. In vitro and in vivo experimental results showed that FM@OXA-PEG had almost no toxicity to normal cells but had obvious killing capacity for tumor cells and significantly inhibited the growth of tumors.
1. Introduction
Chemodynamic therapy (CDT) catalyses the Fenton or Fenton-like reaction of hydrogen peroxide (H2O2) to produce the highly cytotoxic hydroxyl radical (˙OH) to kill tumors.1–4 Due to its advantages of high specificity, low side effects and negligible drug resistance, CDT has attracted much attention for tumor treatment. However, there are still some problems hindering the application of CDT, such as the Fenton reaction activity, H2O2 content and short lifetime of ˙OH.5–8Several materials can efficiently trigger Fenton and Fenton-like reactions, including iron9–12 or transition metal ion-based nanomaterials (Mn2+, Cu2+, Mo3+, etc.).13–18 Among these catalytic nanomaterials, iron ions are one of the essential elements for biological functions. Additional iron is injected into the body to activate the Fenton reaction and these materials include iron oxide,19–21 iron nanoclusters22 and iron-based MOFs.23–26 Iron generates inactive ferric hydroxide (Fe(OH)x) at a physiological pH before reaching acidic tumor tissues, causing loss of the iron source and subsequent weak Fenton reactions.27 On the other hand, Fe2+ presents dramatically higher catalytic activity, by several magnitudes, than Fe3+ for the Fenton reaction but may suffer from premature bio-oxidation processes.28 General iron-based inorganic catalysts comprising Fe3+ ions exhibit slow catalytic activity and need additional reductive compounds such as TA or other polyphenols.29 Thus, novel ferrous based materials with high stability in a weak alkaline environment need to be developed.30
Besides the low catalytic efficiency of Fe3+, insufficient H2O2 content in the tumor also severely limits the generation efficiency of ˙OH.31–34 Therefore, it is very important to design a CDT agent that can increase the H2O2 content.35–38 To date, many studies have focused on increasing H2O2 levels in tumors through various H2O2-producing agents such as glucose oxidase,39 β-lapachone40 and gold nanoparticles.41 Moreover, ˙OH has a rather short lifetime and can be consumed by intracellular GSH, resulting in rather weak CDT efficiency.42,43 One effective measure to deal with these problems is to combine CDT with other kinds of therapy. Platinum drugs are one of the most used chemotherapy drugs; as a CT drug, they can specifically activate nicotinamide adenine dinucleotide phosphate oxidase (NOX) in cancer cells to produce O2, which can be differentiated into H2O2 by superoxide dismutase (SOD).44 Therefore, platinum drug-mediated chemotherapy can continuously generate H2O2 for the Fenton reaction and serve as an ideal complement to CDT.
Metallacages are cage-like coordinate compounds with discrete structures and a unique cavity in which bio-molecules can be captured.45–47 Metallacages are also good ferrous ions carriers through coordinate interaction with organic ligands. Here, we synthesized water soluble tetrahedral metallacage based ferrous ions (FM). Fe2+ was six coordinatively saturated and catalysed the Fenton reaction to produce hydroxyl radicals. After assembly with PEG2000-COOH and chemotherapy drug OXA, FM was transformed into self-assembled FM@OXA-PEG with strong stability and biocompatibility. More importantly, in vivo and in vitro experimental results showed that FM@OXA-PEG has synergistic therapeutic effects and is a very promising drug for cancer treatment.
2. Experimental details
2.1. Materials and reagents
All the chemicals are commercially available and were used without further purification.2.2. Characterization
NMR experiments were carried out on an AVANCE III HD spectrometer operating at resonance frequencies of 400 MHz. All UV-vis absorption spectra were recorded on a Lambda 20 UV-vis spectrometer (PerkinElmer, Inc., USA). Mass spectra (FT-ICR MS) were recorded on a Bruker Compact spectrometer using methanol as the mobile phase. X-ray photoelectron spectroscopy was performed on a Thermo Scientific K-Alpha+. Scanning electron microscopy (SEM) images were collected on a Zeiss EVO MA 25/LS 25. Transmission electron microscopy (TEM) images and energy dispersive spectra (EDS) mapping were collected on a JEOL-2100F/F200. The dynamic hydration size and zeta potential were characterized on a Nano-ZS90. Analytical high performance liquid chromatography (HPLC) was performed on an Agilent 1260 with UV detection. An analytical Tc-C18 column (4.6 mm × 25 cm, 5 μm) from Agilent was used.2.3. Preparation of ferrous metallacage (FM)
The ligand and the ferrous metallacage were synthesized based on reported literature with slightly modified conditions. A mixture of L (19 mg, 0.04 mmol), pyridine-2-formaldehyde (8.5 mg, 0.08 mmol) and FeSO4·7H2O (17 mg, 0.06 mmol) was stirred in water (5 mL) at R.T. for 12 h. 1H NMR (D2O, 400 MHz): 8.88 (12H, s), 8.43 (12H, d), 8.24 (12H, dd), 7.56 (12H, dd), 7.27 (12H, d), 7.04 (24H, s), 6.80 (12H, s), 5.41 (24H, s), 3.80 (12H, s), 3.63 (24H, s), 3.34 (24H, s).2.4 Synthesis of FM@OXA-PEG
FM@OXA-PEG was synthesized through hydrophilic and hydrophobic interaction. PEG2000-COOH (30 mg) and oxaliplatin aqueous solution (100 μL, 1 mg mL−1) were added dropwise into FM solution (100 mL, 1 mM) successively under ultrasonic condition for 30 min. The free components were removed by centrifugation with an ultrafiltration tube (MWCO 8000) and the upper purple solution containing FM@OXA-PEG was concentrated for later use.2.5. In vitro FM and OXA release studies
We carried out the release profile by the oscillating water bath dialysis method. Briefly, FM@OXA-PEG (10 mL, 2.5 mM) was placed in a dialysis bag (MWCO 8000), immersed in 20 mL of PBS buffer (pH = 6.5) and placed on a shaker oscillator (37 °C, 100 rpm). At predetermined times (1, 3, 4, 8, 12, 24, 48 h), 2 mL solution was removed for evaluation and replenished with 2 mL fresh PBS to maintain constant conditions. The withdrawn solution was analysed by UV-vis spectrophotometer and HPLC to obtain the concentrations of the released FM and OXA, respectively, based on their standard curves. Afterward, a time-dependent drug release percentage was calculated from three repeated processes.2.6. Extracellular ˙OH detection
Terephthalic acid (TPA) was chosen as the indicator to detect ˙OH produced by FM@OXA-PEG in the solution. The fluorescence spectrum of TPA in the aqueous solution mixture (10 mM TPA, 1 mM FM and 0.8 mM H2O2) was detected every 10 min.The generation of ˙OH was also detected by ESR spectroscopy with DMPO (0.2 mM) as a spin collector. The experiment was divided into five groups: H2O2, FM@PEG, FM@OXA-PEG, FM@PEG + H2O2, and FM@OXA-PEG + H2O2.
2.7. Cytotoxicity
The toxicity of FM@OXA-PEG was determined by MTT assay on 3T3 and 4T1 cells. The cells were seeded into 96-well plates (4000 cells per well) and cultured at 37 °C with CO2 for 24 h. The experiment was divided into four groups: 3T3 cells + FM@OXA-PEG (0, 0.0625, 0.125, 0.25, 0.5, 1 mM), 4T1 cells + FM@PEG (0, 0.0625, 0.125, 0.25, 0.5, 1 mM), 4T1 cells + OXA (0, 0.875, 1.75, 3.5, 7, 14 μg mL−1), and 4T1 cells + FM@OXA-PEG (0, 0.0625, 0.125, 0.25, 0.5, 1 mM). The culture was continued with MTT for another 4 h; after that, the reductant MTT was sucked out, DMSO was added, and the absorbance was tested with a microplate reader.2.8. Calcein-AM/PI staining
After 4T1 cells and FM@PEG (1 mM), OXA (14 μg mL−1) or FM@OXA-PEG (1 mM) were incubated together for 24 h, the culture medium was removed and fresh culture medium was supplemented. Then, the 4T1 cells were stained with Calcein-AM/PI for 30 min and confocal laser scanning images were collected. ImageJ software was used for the average fluorescence intensity analysis.2.9. Intracellular ˙OH production
The experiment was divided into four groups: PBS, FM@PEG (1 mM), OXA (14 μg mL−1) and FM@OXA-PEG (1 mM). At the end of incubation (12 h), the culture medium was removed and the cells were washed with cold PBS. Then, 2′,7′-dichlorodihydrofluorescein diacetate (DCFH-DA, 10 μM) was added and the confocal laser scanning images of each group were collected.2.10. Increasement of intracellular H2O2
Intracellular H2O2 concentration was studied by hydrogen peroxide detection kit. The 4T1 cells were incubated with OXA (14 μg mL−1) for 0, 3, 6, 8, 10, and 12 h. Samples at each time point were washed with PBS, treated with cell lysate (200 μL) and centrifuged (12![[thin space (1/6-em)]](https://www.rsc.org/images/entities/char_2009.gif) 000 rpm min−1) for 5 min at 4 °C. The supernatant was divided into a 96-well plate (50 μL per well) and hydrogen peroxide detection kit (150 μL) was added to each well. After incubation for 30 min at room temperature, the H2O2 concentration was determined by measuring the absorbance (l = 560 nm) according to the standard curve.
000 rpm min−1) for 5 min at 4 °C. The supernatant was divided into a 96-well plate (50 μL per well) and hydrogen peroxide detection kit (150 μL) was added to each well. After incubation for 30 min at room temperature, the H2O2 concentration was determined by measuring the absorbance (l = 560 nm) according to the standard curve.
2.11. Mitochondrial membrane potential
After incubation with FM@OXA-PEG for 24 h, 4T1 cells were incubated with 5,5′,6,6′-tetrachloro-1,1′,3,3′-tetraethylbenzimidazolylcarbocyanine iodide (JC-1) for 30 min. Then the culture medium was removed, the cells were washed with buffer twice, and the images were observed using CLSM.2.12. Pharmacokinetics of FM@OXA-PEG
To determine the in vivo pharmacokinetics of FM@OXA-PEG, mice received FM@OXA-PEG (0.28 mg kg−1 body weight for FM) by tail vein injection (n = 3). Blood was collected and kept in heparinized tubes. The amount of Fe in the plasma was determined by ICP-MS. The distribution of Fe was calculated by the percentage of injected dose per gram (% ID g−1).2.13. In vivo inhibition on 4T1 solid tumor
Mice were purchased from Shanghai JieSiJie Laboratory Animal Co., Ltd and used strictly in line with the standards of the Animal Protection and Use Committee, as approved by the Animal Ethics Committee of Shanghai Normal University. The tumor-bearing mice were randomly divided into 4 groups: PBS, FM@PEG, OXA and FM@OXA-PEG. The mice were treated by tail vein injection of different materials (0.28 mg kg−1 for FM, 0.07 mg kg−1 for OXA) twice, on the first day and the 7th day. During the 14 day treatment, the tumor volume and body weight of the mice in each group were measured every other day. The relative tumor volume was calculated as V/V0, in which V0 is the initial tumor volume for each mouse.3. Results and discussions
3.1. Synthesis and characterization of FM@OXA-PEG
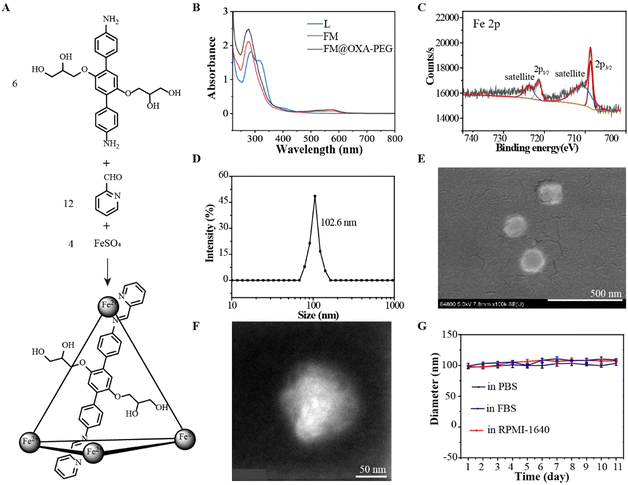
Diaminoterphenylene (L) was synthesized from 1,4-dimethoxy-benzene through a five step reaction according to a reference (Fig. S1–S5, ESI†).48 The ferrous metallacage (FM) was built from L, 2-formylpyridine and FeSO4 in a 6![[thin space (1/6-em)]](https://www.rsc.org/images/entities/char_2009.gif) :
:![[thin space (1/6-em)]](https://www.rsc.org/images/entities/char_2009.gif) 12
12![[thin space (1/6-em)]](https://www.rsc.org/images/entities/char_2009.gif) :
:![[thin space (1/6-em)]](https://www.rsc.org/images/entities/char_2009.gif) 4 molar ratio (Fig. 1(A)). The successful formulation of FM was supported by 1H nuclear magnetic resonance (NMR), Fourier transform ion cyclotron resonance mass spectrometry (FT-ICR MS) and UV-vis spectroscopy. The discrete metallacage was proved by a single set of 1H NMR resonances (Fig. S6, ESI†); the expected isotopic pattern at 823.41 belonged to [Fe4L6SO4·5H2O–H+]5+ and that at 1085.64 belonged to [Fe4L6(SO4)2·12H2O]4+ (Fig. S7, ESI†). The absorbance near 550 nm in the UV-vis absorption spectra of FM was assigned to the d–d electronic transition (Fig. 1(B)), indicating the formation of a Fe–N coordination bond. The iron ion in FM was in the +2-oxidation state, as suggested by the Fe 2p3/2 and Fe 2p1/2 peaks at around 709 eV and 721 eV, respectively, in the XPS spectra (Fig. 1(C)). Due to the hanging propylene glycol group on the ligand and the hydrophilic counterion (SO42−), FM had good water solubility.
4 molar ratio (Fig. 1(A)). The successful formulation of FM was supported by 1H nuclear magnetic resonance (NMR), Fourier transform ion cyclotron resonance mass spectrometry (FT-ICR MS) and UV-vis spectroscopy. The discrete metallacage was proved by a single set of 1H NMR resonances (Fig. S6, ESI†); the expected isotopic pattern at 823.41 belonged to [Fe4L6SO4·5H2O–H+]5+ and that at 1085.64 belonged to [Fe4L6(SO4)2·12H2O]4+ (Fig. S7, ESI†). The absorbance near 550 nm in the UV-vis absorption spectra of FM was assigned to the d–d electronic transition (Fig. 1(B)), indicating the formation of a Fe–N coordination bond. The iron ion in FM was in the +2-oxidation state, as suggested by the Fe 2p3/2 and Fe 2p1/2 peaks at around 709 eV and 721 eV, respectively, in the XPS spectra (Fig. 1(C)). Due to the hanging propylene glycol group on the ligand and the hydrophilic counterion (SO42−), FM had good water solubility.
To improve the stability of FM in the physiological environment and obtain a tumor therapeutic agent with multi-modality, FM@OXA-PEG was formed through hydrophilic interaction between FM with PEG2000-COOH and hydrophobic interaction between FM with OXA (Scheme 1). EDS mapping results showed that the elements C, O, Fe and Pt were distributed uniformly in the NP, indicating that both ferrous ions and OXA distributed homogeneously in the nanoplatform (Fig. S8, ESI†). The absorbance at 572 nm observed in the UV-vis spectrum of FM@OXA-PEG further proved that the assembled FM@OXA-PEG was obtained successfully and the structure of FM remained intact (Fig. 1(B)). The morphology and size were evaluated by dynamic light scattering (DLS), scanning electron microscopy (SEM), and transmission electron microscopy (TEM) (Fig. 1(D)–(F)). The results show that FM@OXA-PEG was a nearly spherical particle with an average hydration diameter of 102.6 ± 3.5 nm. The surface charge of FM@OXA-PEG had a −3.7 ± 0.58 mV potential as evaluated by the zeta potential (Fig. S9, ESI†), which is beneficial to biological applications. The zeta potential changed from a positive value (19.6 ± 2.6 mV of FM) to the negative value after assembly, indicating the formation of FM@OXA-PEG. The molar ratio of iron to platinum in the assembly was 28![[thin space (1/6-em)]](https://www.rsc.org/images/entities/char_2009.gif) :
:![[thin space (1/6-em)]](https://www.rsc.org/images/entities/char_2009.gif) 1 as determined by inductively coupled plasma mass spectrometry (ICP-MS). The amount of OXA was relatively lower than that of PM but was enough to kill tumor cells through chemotherapy.
1 as determined by inductively coupled plasma mass spectrometry (ICP-MS). The amount of OXA was relatively lower than that of PM but was enough to kill tumor cells through chemotherapy.
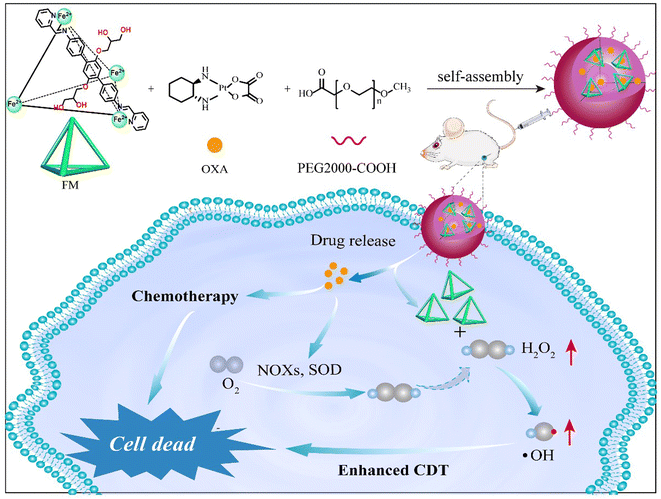 | ||
| Scheme 1 Schematic illustration of FM@OXA-PEG for chemotherapy combined with enhanced chemodynamic therapy. | ||
The stability of a material under biophysical conditions is vital for application as a diagnostic and therapeutic agent. The hydrodynamic diameter of FM@OXA-PEG had no obvious change after incubation in PBS, fetal bovine serum (FBS) or 1640 medium for 11 days, indicating that the assembly was able to retain its supramolecular structure in a physiological environment (Fig. 1(G) and Fig. S10, ESI†). UV-vis absorbance position and intensity are evidence for the structural stability of coordination compounds.49 The individual structure of FM in FM@OXA-PEG under the above conditions and different pH conditions (5.3, 6.5, 7.4) was estimated with this method. The unchanged spectral shape and up to 0.8 A/A0 value at 572 nm proved that FM maintained its cage-like structure (Fig. S11 and S12, ESI†). All in all, the assembly has excellent water solubility and stability under biological conditions which are conductive to therapeutic application in vivo. The leakage of OXA and FM were studied by HPLC and UV-vis absorption spectrometry, respectively (Fig. S13, ESI†). OXA and FM released slowly from FM@OXA-PEG and nearly 83.0% OXA and 87.3% FM were released from the assembly after 50 hours in the absence of H2O2 (Fig. S14, ESI†).
3.2. ROS production ability of FM@OXA-PEG
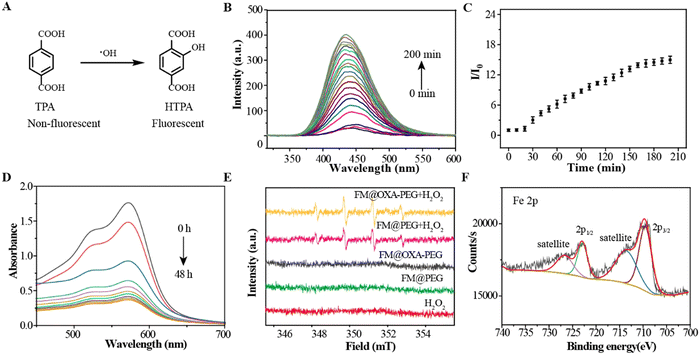
Terephthalic acid (TPA) was chosen as the ˙OH-detecting agent because it can be oxidized by ˙OH into hydroxyterephthalic acid (hTPA) which shows a fluorescence emission at 435 nm (Fig. 2(A)). The fluorescence emission intensity gradually increased with the incubation time of FM@OXA-PEG with H2O2, suggesting that ˙OH was produced via a Fenton-like reaction (Fig. 2(B) and (C)). To make sure of the Fenton reaction catalytical component in FM@OXA-PEG, control experiments were carried out. As seen in Fig. S15 (ESI†), the fluorescence emission intensity of TPA increased in the FM group and had no obvious change in the presence of OXA, indicating that FM played the role of Fenton reaction catalyst here. A standard four-fold peak of 1![[thin space (1/6-em)]](https://www.rsc.org/images/entities/char_2009.gif) :
:![[thin space (1/6-em)]](https://www.rsc.org/images/entities/char_2009.gif) 2
2![[thin space (1/6-em)]](https://www.rsc.org/images/entities/char_2009.gif) :
:![[thin space (1/6-em)]](https://www.rsc.org/images/entities/char_2009.gif) 2
2![[thin space (1/6-em)]](https://www.rsc.org/images/entities/char_2009.gif) :
:![[thin space (1/6-em)]](https://www.rsc.org/images/entities/char_2009.gif) 1 electron cyclone resonance of the ˙OH radical was observed in the groups FM@PEG + H2O2 and FM@OXA-PEG + H2O2 (Fig. 2(E)). Distinctly, no signal was observed under identical experimental conditions for the blank (H2O2) and control groups (FM@PEG and FM@OXA-PEG). Therefore, FM@OXA-PEG with H2O2 could produce ˙OH radicals, showing potential for cancer treatment as a CDT agent.
1 electron cyclone resonance of the ˙OH radical was observed in the groups FM@PEG + H2O2 and FM@OXA-PEG + H2O2 (Fig. 2(E)). Distinctly, no signal was observed under identical experimental conditions for the blank (H2O2) and control groups (FM@PEG and FM@OXA-PEG). Therefore, FM@OXA-PEG with H2O2 could produce ˙OH radicals, showing potential for cancer treatment as a CDT agent.
This result showed that the coordinate cage based on Fe2+ had obvious Fenton reaction catalytic activity. Besides the catalytic performance, we were also interested in and further explored the catalytic mechanism.
As the vertex of the tetrahedral cage, the Fe2+ ions participated in a redox reaction resulting in Fe2+ (Fe 2p3/2 = 709 eV, Fe 2p1/2 = 721 eV) being oxidized to Fe3+ (Fe 2p3/2 = 710 eV, Fe 2p1/2 = 723 eV) by H2O2. The valence state change of iron was verified by XPS (Fig. 2(F)). Also, the UV-vis absorbance of FM at 572 nm disappearing suggested that the cage structure collapsed (Fig. 2(D)). In addition, FM showed no apparent T1-weighted MRI capability due to the low spin Fe2+ having no single electron. However, the longitudinal relaxativity of FM was greatly enhanced, from r1 = 0.012 mM−1 s−1 to r1 = 0.24 mM−1 s−1, after ˙OH production. Unfortunately, the enhanced relaxativity was still too low to shorten the relaxation time of water, though this phenomenon gave us an idea about designing MRI contrast agents responsive to pH or H2O2.
3.3. Anti-tumor performance of FM@OXA-PEG in vitro
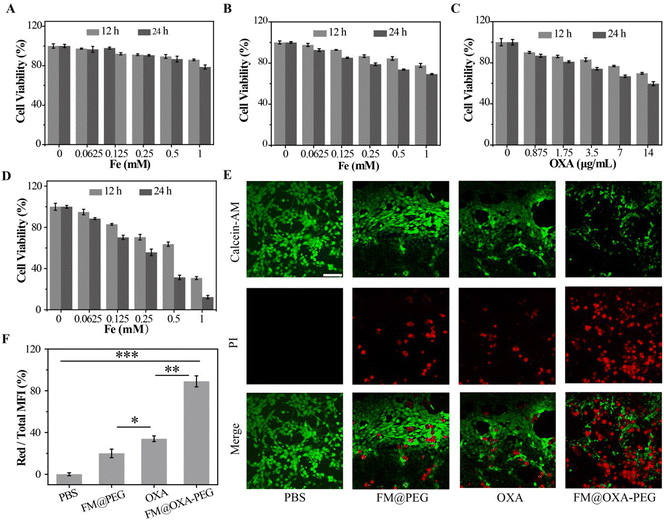
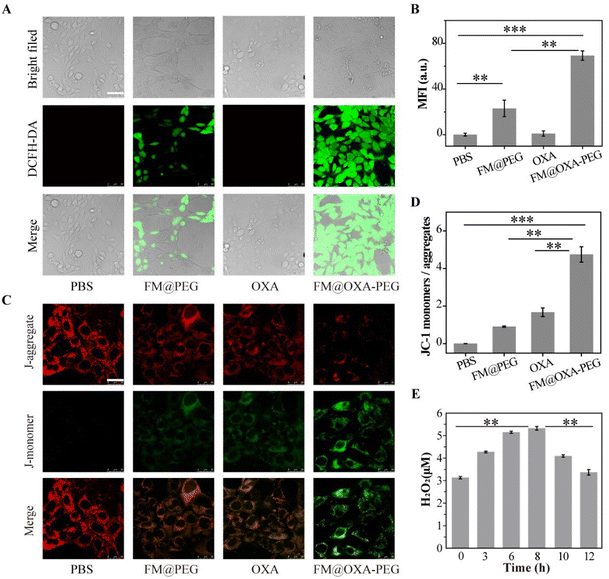
As good biocompatibility is of great significance for the biological application of nanoparticles, the cell viability was evaluated by MTT method. Embryonic fibroblast cells (3T3) were incubated with different concentrations of FM@OXA-PEG (calculated by Fe concentration) for 12 h and 24 h. As shown in Fig. 3(A), the cell viability was above 80%, indicating its good bio-compatibility and proving that the cell killing capacity of FM@OXA-PEG was triggered by the tumor microenvironment and it is friendly to normal cells. Meanwhile, the toxicity and side effects of the chemotherapeutic drug OXA were lowered after its assembly into FM@OXA-PEG.The 4T1 cell viability decreased to 69.2% and 59.6% after treatment with FM@PEG (cFe = 1 mM) and OXA (14 μg mL−1) for 24 h. (Fig. 3(B) and (C)). The unsatisfactory CDT performance of FM@PEG may be attributed to the limitation of intracellular H2O2 content. Besides, as a chemotherapy drug, OXA can activate nicotinamide adenine dinucleotide phosphate oxidase (NOX) and peroxide dismutase (SOD) to produce H2O2, providing raw materials for the Fenton reaction and further enhancing the therapeutic effect of CDT. The killing capability of FM@OXA-PEG through the combined effect of CDT and chemotherapy was also estimated with the MTT method. As shown in Fig. 3(D), the viability of 4T1 cells treated with FM@OXA-PEG (cFe = 1 mM, cOXA = 14 μg mL−1) was only 12.3%. The 87.7% cytotoxicity of FM@OXA-PEG was much larger than the sum cytotoxicity of FM@PEG (30.8%) and OXA (40.4%), meaning that there was a synergistic chemodynamic/chemotherapeutic effect after the combination of FM and OXA. The increased intracellular H2O2 concentration after incubation with OXA was estimated by CLSM with a hydrogen peroxide detection kit as the probe. As shown in Fig. 4(E) and Fig. S16 (ESI†), the H2O2 concentration increased to nearly 2 times the beginning concentration.
The synergistic effect of chemo/chemodynamic therapy of FM@OXA-PEG was also estimated by CLSM. 4T1 tumor cells were stained by Calcein-AM/PI (propidium iodide) after incubation with different materials (PBS, FM@PEG, OXA and FM@OXA-PEG). CLSM shows the live and dead cells. As can be seen from Fig. 3(E), strong green and no red fluorescence was detected in the PBS group, suggesting that the cells were alive under this condition. In the FM@PEG and OXA groups, red fluorescence appeared, suggesting some tumor cells died. The red fluorescence intensity was enhanced in the FM@OXA-PEG group, indicating more tumor cells died. Subsequently, we quantitatively analysed the fluorescence intensity using the ImageJ program. As shown in Fig. 3(F), only 11% of 4T1 cells survived after incubation with FM@OXA-PEG (cFe = 1 mM, cOXA = 14 μg mL−1), while the survival rates were 80% and 66% for the FM@PEG (cFe = 1 mM) and OXA groups (cOXA = 14 μg mL−1). As can be seen, the CLSM results corresponded with the MTT arrays, further indicating that a synergistic enhancement effect existed in FM@OXA-PEG.
Moreover, to validate the enhanced CDT by OXA, we investigated the intracellular ˙OH radicals on 4T1 tumor cells using DCFH-DA (green fluorescence) as the probe. After cellular incubation with FM@PEG or FM@OXA-PEG and DCFH-DA, in order to exclude interference, control PBS and OXA groups were used. The generation of intracellular ˙OH was monitored in real time by recording the fluorescence of the probe. Obviously, the PBS and OXA groups had no green fluorescence and the green fluorescence was much brighter in the presence of FM@OXA-PEG than FM@PEG (Fig. 4(A)). Quantitative results showed that the green fluorescence intensity of the FM@OXA-PEG group was 3 times as much as that of FM@PEG due to the extra H2O2 generated by OXA in the tumor cells (Fig. 4(B)). All these results revealed that the cell killing ability of FM@OXA-PEG depended on the enhanced ˙OH generation and chemotherapy.
Mitochondrial membrane potential (MNP) is an important marker of mitochondrial membrane structure disruption and cell apoptosis. The present study measured the mitochondrial membrane potential by using JC-1 as a fluorescent probe with the CLSM method. The ratio of green JC-1 monomers to red JC-1 aggregates indicated the state of the mitochondria (Fig. 4(C)). Compared to the PBS group, the statistical ratios of JC-1 green/red fluorescence for the FM@PEG and OXA groups were 90.8% and 167.5%, respectively, indicating that ˙OH produced by both CDT and OXA could induce mitochondrial damage (Fig. 4(D)). Moreover, the JC-1 green/red fluorescence ratio of FM@OXA-PEG was 5.22 and 2.82 times as much as those of FM@PEG and OXA, respectively, due to the synergistic therapeutic effect.
3.4. Anti-tumor performance of FM@OXA-PEG in vivo
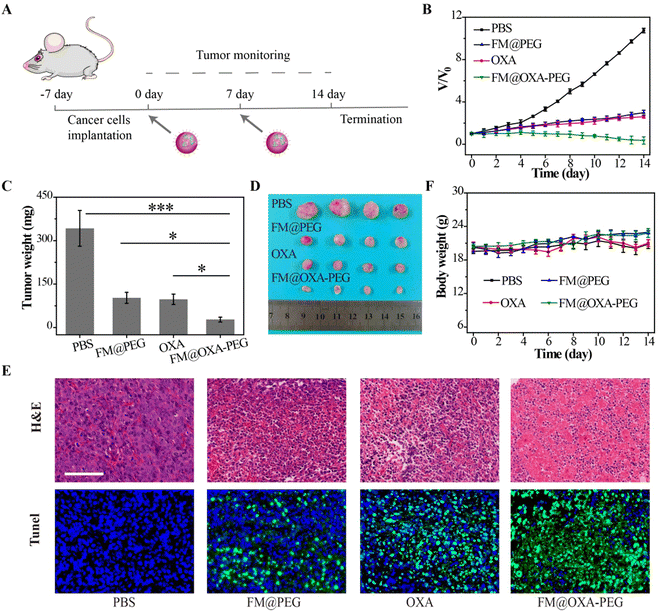
We estimated the in vivo pharmacokinetics of FM@OXA-PEG in mice after intravenous injection. As seen in Fig. S17 (ESI†), the metabolism of iron ions was nearly complete at 24 h after intravenous injection and the iron ion concentration in blood decreased to the normal level (2.3% ID g−1), indicating the good biocompatibility of FM@OXA-PEG. The first (t1/2(α)) and second half-life times (t1/2(β)) of FM@OXA-PEG were 2.72 ± 0.21 h and 21.42 ± 8.84 h, respectively, calculated using a double-compartment model fitting curve. Inspired by the excellent therapeutic efficacy of FM@OXA-PEG in vitro, the synergistic CDT performance in vivo on tumor-bearing mice (4T1) was investigated. The mice were randomly divided into 4 groups (PBS, FM@PEG, OXA and FM@OXA-PEG) and injected with a solution of materials (0.28 mg kg−1 body weight for FM, 0.07 mg kg−1 body weight for OXA) via tail vein two times, on days 0 and 7 (Fig. 5(A)).Tumor volume changes were recorded daily during the 14 day treatment (Fig. 5(B) and Fig. S18, ESI†). The tumor volumes for the PBS, FM@PEG and OXA groups at the end of treatment had increased greatly, e.g. 10.7, 3.0 and 2.6 times the original volumes, respectively. A slight decrease (0.3 fold) was measured after treatment by FM@OXA-PEG, suggesting the assembly could inhibit tumor growth with high efficiency. After the end of treatment 14 days later, the tumors of each group were dissected and weighed (Fig. 5(C) and (D)). Similar to the tumor volume change results, the tumor weights of the FM@OXA-PEG group were much less than those of the other groups, at only 27%, 29% and 8% of the control groups (FM@PEG, OXA) and blank group (PBS), respectively.
After treatment, H&E staining and Tunel immunofluorescence staining were performed on tumor slices of each group and the results showed that the tumor of the treatment group (FM@OXA-PEG) had the most notable tissue damage (Fig. 5(E)). In the other groups, no notable effect or only partial damage was observed. The different therapeutic results between FM@OXA-PEG and FM@PEG or OXA were mainly attributed to the synergistic effect of enhanced CT and CDT.
In addition, the body weight of the mice was also monitored during the treatment period (Fig. 5(F)). There was no significant weight loss in any group except the OXA group and the large body weight fluctuation of the OXA group might be attributed to the toxicity and side effects of traditional chemotherapy. H&E staining of heart, liver, spleen, lung, and kidney of FM@OXA-PEG and PBS group mice showed no obvious tissue damage (Fig. S19, ESI†). The above results indicated that FM@OXA-PEG was bio-safe, had no systemic toxicity and was a potential drug for treating tumors.
4. Conclusions
In summary, we built the novel tumor therapeutic platform FM@OXA-PEG based on a water soluble ferrous metallacage. The ferrous metallacage played not only the role of ferrous iron carrier but also chemotherapy drug delivery. In this work, we appropriately utilized the characteristics of FM and OXA to assemble a synergistic anticancer drug. In vitro and in vivo anti-tumor experimental results showed that FM@OXA-PEG had low toxicity to normal tissues and high efficiency for killing tumor cells with CT and enhanced CDT. FM kept its structural stability and ferrous valence state in the physiological environment, showing a potential application prospect as a CDT agent.Author contributions
Jing He, Wei He and Run Wang carried out the experiments. Jing He and Jingjing Jiao disposed experimental data and wrote manuscript. Jingjing Jiao and Shiping Yang designed and directed the research.Conflicts of interest
There are no conflicts to declare.Acknowledgements
This work was partially supported by the National Natural Science Foundation of China (22271190), Shanghai Rising Star Project (22QA1407000). Shanghai Engineering Research Center of Green Energy Chemical Engineering (18DZ2254200).Notes and references
- J. Lu, Z. Jiang, J. Ren, W. Zhang, P. Li, Z. Chen, W. Zhang, H. Wang and B. Tang, Angew. Chem., Int. Ed., 2022, 61, e202114373 CAS.
- Y. Chen, J. Zan, Y. Liu, P. Kuang, C. Guo, C. Xie, W. Huang and Q. Fan, J. Mater. Chem. B, 2022, 10, 1403–1409 RSC.
- N. Wang, C. Liu, W. Yao, H. Zhou, S. Yu, H. Chen and W. Qiao, Adv. Funct. Mater., 2021, 31, 2101432 CrossRef CAS.
- S. Li, P. Jiang, F. Jiang and Y. Liu, Adv. Funct. Mater., 2021, 31, 2100243 CrossRef CAS.
- X. Wang, X. Zhong, Z. Liu and L. Cheng, Nano Today, 2020, 35, 100946 CrossRef CAS.
- W. Wang, Y. Jin, Z. Xu, X. Liu, S. Bajwa, W. S. Khan and H. Yu, Wiley Interdiscip. Rev.: Nanomed. Nanobiotechnol., 2020, e1614 Search PubMed.
- Y. Huang, Y. Jiang, Z. Xiao, Y. Shen, L. Huang, X. Xu, G. Wei, C. Xu and C. Zhao, Chem. Eng. J., 2020, 380, 122369 CrossRef CAS.
- Z. Tang, H. Zhang, Y. Liu, D. Ni, H. Zhang, J. Zhang, Z. Yao, M. He, J. Shi and W. Bu, Adv. Mater., 2017, 29, 1701683 CrossRef PubMed.
- Y. Liu, S. Zhai, X. Jiang, Y. Liu, K. Wang, C. Wang, M. Zhang, X. Liu and W. Bu, Adv. Funct. Mater., 2021, 31, 2010390 CrossRef CAS.
- F. Wu, Q. Zhang, M. Zhang, B. Sun, Z. She, M. Ge, T. Lu, X. Chu, Y. Wang, J. Wang, N. Zhou and A. Li, ACS Appl. Mater. Interfaces, 2020, 12, 10142–10155 CrossRef CAS PubMed.
- S. Dong, J. Xu, T. Jia, M. Xu, C. Zhong, G. Yang, J. Li, D. Yang, F. He, S. Gai, P. Yang and J. Lin, Chem. Sci., 2019, 10, 4259–4271 RSC.
- L. Zhang, S. Wan, X. Li, C. Xu, H. Cheng and X. Zhang, Nano Lett., 2018, 18, 7609–7618 CrossRef CAS PubMed.
- J. Yan, W. Meng, H. Shan, X. Zhang, L. Zou, L. Wang, J. Shi and X. Kong, ACS Appl. Nano Mater., 2021, 4(2), 1351–1363 CrossRef CAS.
- Z. Wang, Q. Sun, B. Liu, Y. Kuang, A. Gulzar, F. He, S. Gai, P. Yang and J. Lin, Coord. Chem. Rev., 2021, 439, 213945 CrossRef CAS.
- C. Li, J. Ye, X. Yang, S. Liu, Z. Zhang, J. Wang, K. Zhang, J. Xu, Y. Fu and P. Yang, ACS Nano, 2022, 16, 18143–18156 CrossRef CAS PubMed.
- X. Li, D. Xi, M. Yang, W. Sun, X. Peng and J. Fan, Adv. Healthcare Mater., 2021, 10, 2101008 CrossRef CAS PubMed.
- Y. Tian, W. Yi, Q. Shao, M. Ma, L. Bai, R. Song, P. Zhang, J. Si, X. Hou and J. Fan, Chem. Eng. J., 2023, 462, 142156 CrossRef CAS.
- M. Qian, Z. Cheng, G. Luo, M. Galluzzi, Y. Shen, Z. Li, H. Yang and X. Yu, Adv. Sci., 2022, 9, 2101527 CrossRef CAS PubMed.
- M. Li, L. Huo, J. Zeng, G. Zhu, S. Shi, X. Liu, X. Zhu, G. Huang, D. Qiu, J. Jia, K. Ni and Z. Zhao, Chem. Eng. J., 2022, 440, 135966 CrossRef CAS.
- X. Tang, Z. Wang, Y. Zhu, H. Xiao, Y. Xiao, S. Cui, B. Lin, K. Yang and H. Liu, J. Controlled Release, 2020, 328, 100–111 CrossRef CAS PubMed.
- H. Liu, J. Wang, C. Song, K. Zhou, B. Yu, J. Jiang, J. Qian, X. Zhang and H. Wang, ACS Appl. Mater. Interfaces, 2022, 14, 29650–29658 CrossRef CAS PubMed.
- Q. Chen, J. Zhou, Z. Chen, Q. Luo, J. Xu and G. Song, ACS Appl. Mater. Interfaces, 2019, 11, 30551–30565 CrossRef CAS PubMed.
- H. Deng, J. Zhang, Y. Yang, J. Yang, Y. Wei, S. Ma and Q. Shen, ACS Appl. Mater. Interfaces, 2022, 14, 24089–24101 CrossRef CAS PubMed.
- Y. Zhao, J. Wang, X. Cai, P. Ding, H. Lv and R. Pei, ACS Appl. Mater. Interfaces, 2020, 12, 23697–23706 CrossRef CAS PubMed.
- L. Zhao, Z. Li, J. Wei, Y. Xiao, Y. She, Q. Su, T. Zhao, J. Li and J. Shao, Chem. Eng. J., 2022, 430, 133057 CrossRef CAS.
- H. Ji, C. Kim, C. Min, J. Han, S. Kim, C. Lee and Y. Choy, Bioeng. Transl. Med., 2023, 8, e10477 CrossRef CAS PubMed.
- L. Zhang, C. Li, S. Wan and X. Zhang, Adv. Healthcare Mater., 2022, 11, 2101971 CrossRef CAS PubMed.
- M. Song, Y. Cheng, Y. Tian, C. Chu, C. Zhang, Z. Lu, X. Chen, X. Pang and G. Liu, Adv. Funct. Mater., 2020, 30, 2003587 CrossRef CAS.
- J. Liu, Y. Jin, Z. Song, L. Xu, Y. Yang, X. Zhao, B. Wang, W. Liu, K. Zhang, Z. Zhang and J. Shi, Chem. Eng. J., 2021, 411, 128440 CrossRef CAS.
- Y. Sang, F. Cao, W. Li, L. Zhang, Y. You, Q. Deng, K. Dong, J. Ren and X. Qu, J. Am. Chem. Soc., 2020, 142, 5177–5183 CrossRef CAS PubMed.
- Z. Xiao, W. Zuo, L. Chen, L. Wu, N. Liu, J. Liu, Q. Jin, Y. Zhao and X. Zhu, ACS Appl. Mater. Interfaces, 2021, 13, 43925–43936 CrossRef CAS PubMed.
- Y. He, S. Guo, Y. Zhang, Y. Liu and H. Ju, Biomaterials, 2021, 275, 120962 CrossRef CAS PubMed.
- L. Lin, T. Huang, J. Song, X. Ou, Z. Wang, H. Deng, R. Tian, Y. Liu, J. Wang, Y. Liu, G. Yu, Z. Zhou, S. Wang, G. Niu, H. Yang and X. Chen, J. Am. Chem. Soc., 2019, 141, 9937–9945 CrossRef CAS PubMed.
- R. Cao, W. Sun, Z. Zhang, X. Li, J. Du, J. Fan and X. Peng, Chin. Chem. Lett., 2020, 31, 3127–3130 CrossRef CAS.
- X. Feng, T. Lin, D. Chen, Z. Li, Q. Yang, H. Tian, Y. Xiao, M. Lin, M. Liang, W. Guo, P. Zhao and Z. Guo, Acta Biomater., 2023, 160, 211–224 CrossRef CAS PubMed.
- Y. Han, J. Ouyang, Y. Li, F. Wang and J. Jiang, ACS Appl. Mater. Interfaces, 2020, 12, 288–297 CrossRef CAS PubMed.
- C. Zhang, J. Huang, X. Guo, X. Da, Z. Dai, M. Hassan, Y. Yu, X. Wang and Q. Zhou, Nano Today, 2023, 50, 101824 CrossRef CAS.
- M. Su, Y. Zhu, J. Chen, B. Zhang, C. Sun, M. Chen and X. Yang, Chem. Eng. J., 2022, 435, 134926 CrossRef CAS.
- K. Cheng, C. Ling, D. Gu, Z. Gao, Y. Li, P. An, Y. Zhang, C. You, R. Zhang and B. Sun, New J. Chem., 2020, 44, 1524–1536 RSC.
- Q. Chen, J. Zhou, Z. Chen, Q. Luo, J. Xu and G. Song, ACS Appl. Mater. Interfaces, 2019, 11, 30551–30565 CrossRef CAS PubMed.
- Y. Ding, H. Xu, C. Xu, Z. Tong, S. Zhang, Y. Bai, Y. Chen, Q. Xu, L. Zhou, H. Ding, Z. Sun, S. Yan, Z. Mao and W. Wang, Adv. Sci., 2020, 7, 2001060 CrossRef CAS PubMed.
- Y. Bai, Q. Shang, J. Wu, H. Zhang, C. Liu and K. Liu, ACS Appl. Mater. Interfaces, 2022, 14, 37424–37435 CrossRef CAS PubMed.
- X. Zhong, X. Wang, L. Cheng, Y. A. Tang, G. Zhan, F. Gong, R. Zhang, J. Hu, Z. Liu and X. Yang, Adv. Funct. Mater., 2020, 30, 1907954 CrossRef CAS.
- K. Yang, G. Yu, Z. Yang, L. Yue, X. Zhang, C. Sun, J. Wei, L. Rao, X. Chen and R. Wang, Angew. Chem., Int. Ed., 2021, 60, 17570–17578 CrossRef CAS PubMed.
- W. Tuo, Y. Xu, Y. Fan, J. Li, M. Qiu, X. Xiong, X. Li and Y. Sun, Coord. Chem. Rev., 2021, 443, 214017 CrossRef CAS.
- Y. Hou, Z. Zhang, S. Lu, J. Yuan, Q. Zhu, W. Chen, S. Ling, X. Li, Y. Zheng, K. Zhu and M. Zhang, J. Am. Chem. Soc., 2020, 142, 18763–18768 CrossRef CAS PubMed.
- L. Zhang, H. Liu, G. Yuan and Y. Han, Chin. J. Chem., 2021, 39, 2273–2286 CrossRef CAS.
- J. Bolliger, A. Belenguer and J. Nitschke, Angew. Chem., Int. Ed., 2013, 52, 7958–7962 CrossRef CAS PubMed.
- R. Wang, L. An, J. He, M. Li, J. Jiao and S. Yang, J. Mater. Chem. B, 2021, 9, 1787–1791 RSC.
Footnotes |
| † Electronic supplementary information (ESI) available. See DOI: https://doi.org/10.1039/d3ma00264k |
| ‡ These authors contributed equally to this work. |
| This journal is © The Royal Society of Chemistry 2023 |

