
Rational design of bimetallic Rh0.6Ru0.4 nanoalloys for enhanced nitrogen reduction electrocatalysis under mild conditions†
Lei
Zhao‡
abc,
Xuejing
Liu‡
ab,
Shen
Zhang
d,
Jie
Zhao
d,
Xiaolong
Xu
ab,
Yu
Du
c,
Xu
Sun
ab,
Nuo
Zhang
 ab,
Yong
Zhang
abc,
Xiang
Ren
*abc and
Qin
Wei
*abc
ab,
Yong
Zhang
abc,
Xiang
Ren
*abc and
Qin
Wei
*abc
aKey Laboratory of Interfacial Reaction & Sensing Analysis, University of Shandong, Jinan 250022, Shandong, China. E-mail: chem_renx@163.com; sdjndxwq@163.com
bSchool of Chemistry and Chemical Engineering, University of Jinan, Jinan 250022, Shandong, China
cCollaborative Innovation Center for Green Chemical Manufacturing and Accurate Detection, Jinan 250022, Shandong, China
dShandong Huankeyuan Environmental Engineering Co., Ltd., Jinan, Shandong, China
First published on 7th December 2020
Abstract
As a carbon-free reaction process, the electrocatalytic nitrogen reduction reaction (eNRR) under mild conditions has broad prospects for green and sustainable NH3 production. In this work, bimetallic RhRu nanoalloys (NAs) with cross-linked curly nanosheets were successfully prepared and exhibited exciting results in the eNRR process. Furthermore, the composition effect of RhRu NAs on eNRR activity was studied systematically, and the results showed that Rh0.6Ru0.4 NAs/CP exhibited the highest NH3 yield rate of 57.75 μg h−1 mgcat.−1 and faradaic efficiency of 3.39%. As an eNRR catalyst with great potential, Rh0.6Ru0.4 NAs extend the possibility of alloy-nanomaterials in the eNRR field and further provide an idea for the precise structure of more effective and stable electrocatalysts.
Ammonia (NH3) is one of the irreplaceable inorganic compounds in the world, and is widely used in the manufacture of inorganic fertilizers, dyes, explosives, pharmaceuticals and various industrial chemicals.1–4 In addition, NH3 is regarded as an ideal carbon-free energy carrier due to its high energy density (4.32 kW h L−1) and hydrogen content (17.8 wt%).5–7 Therefore, the synthetic NH3 industry is of great significance to national economy and social development. At present, the industrial synthesis of NH3 still relies on the Haber–Bosch method. However, this scheme is often accompanied by a large amount of energy consumption and greenhouse gas emissions.8–10 Hence, seeking a green and sustainable alternative has become an urgent scientific challenge, especially in achieving high efficiency, low energy consumption, and low emissions of synthetic NH3 under mild conditions. Several alternative methods have been developed to produce NH3 under mild conditions or using renewable energy sources, including biological nitrogen reduction reactions,11,12 photocatalytic nitrogen reduction reactions13,14 and the electrocatalytic nitrogen reduction reaction (eNRR).15–18 Among them, the eNRR can be performed at room temperature and pressure, utilizing electricity generated from sustainable energy (such as solar and wind energy) sources, and the eNRR only requires water and nitrogen as raw materials. Therefore, the eNRR is a neoteric green and sustainable pathway for NH3 synthesis, and has great potential for large-scale NH3 production in the near future.
However, the troublesome problem is the high energy barrier of N![[triple bond, length as m-dash]](https://www.rsc.org/images/entities/char_e002.gif) N bond cleavage in N2 molecules. This means that the activation of inert N2 requires an effective and stable electrocatalyst to trigger it.19,20 Hence, a reasonable design of an electrocatalyst is essential to excitation of the inner NN bond for eNRR improvement. Precious metal materials (such as Ag,21 Au,22 and Pd23-based catalysts) have been proven to be good electrocatalysts for the eNRR because the precious metal surface can adsorb reactants more easily than other materials and the adsorption strength is moderate, which facilitates the formation of intermediate “active compounds”.24–26 Previous theoretical predictions have shown that rhodium (Rh) and ruthenium (Ru), located at the top of the Skulason volcano map, have the most active eNRR surfaces among various metals.27 Surprisingly and interestingly, there have been only a handful of reports about this potential eNRR catalyst up to now. It is worth pointing out that element alloying is an effective method for catalytic activity improvement. Changes in the geometry and electronic structure of the single metal components in an alloy can contribute to adjusting the binding configuration of important intermediate species, thereby realizing the enhancement of catalytic performance.28–30 Hence, it is highly desired to develop alloy catalysts for the eNRR, but it still remains a challenge.
N bond cleavage in N2 molecules. This means that the activation of inert N2 requires an effective and stable electrocatalyst to trigger it.19,20 Hence, a reasonable design of an electrocatalyst is essential to excitation of the inner NN bond for eNRR improvement. Precious metal materials (such as Ag,21 Au,22 and Pd23-based catalysts) have been proven to be good electrocatalysts for the eNRR because the precious metal surface can adsorb reactants more easily than other materials and the adsorption strength is moderate, which facilitates the formation of intermediate “active compounds”.24–26 Previous theoretical predictions have shown that rhodium (Rh) and ruthenium (Ru), located at the top of the Skulason volcano map, have the most active eNRR surfaces among various metals.27 Surprisingly and interestingly, there have been only a handful of reports about this potential eNRR catalyst up to now. It is worth pointing out that element alloying is an effective method for catalytic activity improvement. Changes in the geometry and electronic structure of the single metal components in an alloy can contribute to adjusting the binding configuration of important intermediate species, thereby realizing the enhancement of catalytic performance.28–30 Hence, it is highly desired to develop alloy catalysts for the eNRR, but it still remains a challenge.
Here, RhRu nanoalloys (NAs) were introduced into high-efficiency eNRR catalysts under mild conditions for the first time, and the composition-dependent eNRR activity was also investigated. Due to the abundant active sites of the cross-linked frizzy nanosheet structure and the electronic structure with synergistic effects between alloy components, the synthesized RhRu NAs had high catalytic activity and excellent selectivity for the eNRR. Among the as-synthesized catalysts, Rh0.6Ru0.4 NAs exhibited the best NH3 yield rate (RNH3) as high as 57.75 μg h−1 mgcat.−1 with a faradaic efficiency (FE) of 3.39% in 0.1 M N2-saturated Na2SO4 solution at −0.2 V (vs. RHE). In addition, the catalyst also showed high selectivity and electrochemical stability throughout the eNRR process. Density functional theory (DFT) calculations were performed to further understand the eNRR catalytic mechanism on Rh0.6Ru0.4 NAs.
Rh0.6Ru0.4 NAs for the eNRR test were synthesized by one-step co-reduction of Rh and Ru salt solutions using formaldehyde solution as the reducing agent. For better comparison, the RhRu NAs with different Rh/Ru ratios were synthesized by the same method except for the amount of Rh and Ru salts (see the ESI† for preparative details). Fig. 1a and S1† show the X-ray diffraction (XRD) patterns of four samples with different compositions. Obviously, the XRD patterns of these four samples all display three good diffraction peaks corresponding to (111), (200) and (220) originating from a single face-centered cubic (fcc) lattice. Note that there is no obvious peak shift with the composition change in the RhRu NA system, which is due to the atomic radius of Rh and Ru being 125 pm.31 The X-ray photoelectron spectroscopy (XPS) survey spectrum of Rh0.6Ru0.4 NAs is shown in Fig. S2† where the peaks of Rh 3d, Ru 3d and Ru 3p can be clearly observed. In the Rh 3d region (Fig. 1b), the binding energies (BEs) at 314.97 and 310.23 eV are matched well with Rh 3d3/2 and Rh 3d5/2 in Rh0.6Ru0.4 NAs. The two peaks with binding energies at 314.90 eV and 310.20 eV are assigned to metallic Rh, and the other two peaks at 316.24 eV and 311.52 eV are attributed to oxidized Rh(III).32 In Fig. 1c, the BEs of Ru 3p1/2 and Ru 3p3/2 at 486.76 eV and 464.59 eV are consistent with Ru(0), in keeping with the reported Ru.33 As shown in the scanning electron microscope (SEM) image (Fig. 1d) and the enlarged SEM image in Fig. 1e, the cross-linked frizzy nanosheets of Rh0.6Ru0.4 NAs can be clearly observed, and can provide an abundant specific surface area to facilitate the reaction. For better comparison, the SEM images of other Rh/Ru ratio catalysts display various nanosheet structures (Fig. S3†), indicating the similar surface structure of RhRu alloys. The transmission electron microscope (TEM) image (Fig. 1f) of Rh0.6Ru0.4 NAs further proves their interlinked nanosheet structure. In addition, the high-resolution TEM (HRTEM) image in Fig. 1g shows the clear lattice fringes with d = 0.219 nm, well-indexed to the (111) d-spacing from the Rietveld refinement, d111 = 0.22 nm. Similarly, the fringe with a lattice spacing of 0.192 nm can be indexed to the (200) plane of the fcc RhRu alloys.31 Also, the distinct diffraction ring is clearly assigned to the (111) facet of the fcc RhRu alloys in the selected area electron diffraction (SAED) pattern (Fig. S4†), which further reveals the polycrystalline character of the RhRu alloy. Meanwhile, the energy-dispersive X-ray (EDX) spectroscopy elemental mapping (Fig. 1h) further reveals the uniform distribution of Rh and Ru elements in the crosslinked nanosheet structure of Rh0.6Ru0.4 NAs, further indicating the formation of RhRu alloys.
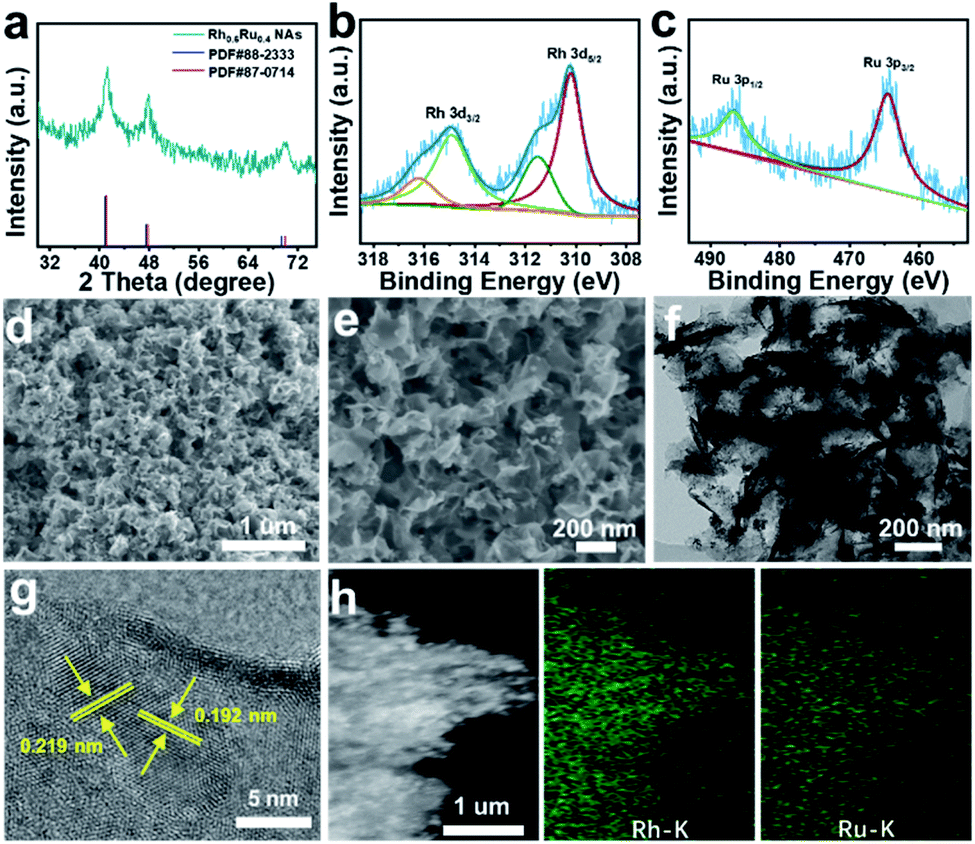 | ||
| Fig. 1 (a) XRD patterns of the obtained Rh0.6Ru0.4 NAs. The high-resolution XPS spectra of (b) Rh 3d and (c) Ru 3p electrons for Rh0.6Ru0.4 NAs. (d) SEM image and (e) enlarged SEM image for Rh0.6Ru0.4 NAs. (f) TEM image and (g) HRTEM image taken from Rh0.6Ru0.4 NAs. (h) SEM image and corresponding EDX elemental mapping images for Rh0.6Ru0.4 NAs. | ||
Fig. 2a displays the diagrammatic drawing of the electrolyzer adapted in the eNRR process, and the specific optical photograph is shown in Fig. S5 and S6.† The H-shaped electrolytic cell used for the eNRR is separated by a Nafion 211 membrane, which allows the transfer of protons but rejects the transfer of products. Before the experiment, Na2SO4 as a neutral electrolyte was subjected to high-temperature annealing in advance and the Nafion 211 membrane was also pre-treated to eliminate the interference of nitrogen-containing pollutants. Importantly, N2 was bubbled into 0.1 M Na2SO4 for 30 minutes and aeration was maintained during the eNRR test to keep the electrolyte saturated with N2. The NH3 concentration quantification scheme adopted the indophenol method34 and the possible by-product N2H4 was detected by Watt and Chrisp methods.35 The calibration curves are given in Fig. S7 and S8.† Linear sweep voltammetry (LSV) curves derived from Rh0.6Ru0.4 NAs/CP (Fig. S9†) reveal a clear current density difference between the N2- and Ar-saturated electrolyte from 0 to −0.5![[thin space (1/6-em)]](https://www.rsc.org/images/entities/char_2009.gif) V (vs. RHE), indicating the existence of the eNRR activity of Rh0.6Ru0.4 NAs/CP in 0.1 M Na2SO4 solution. Then, the RNH3 and FE of Rh0.6Ru0.4 NAs/CP were evaluated from time-dependent current density curves in 2 hours (Fig. 2b). The electrolyte solutions after the eNRR test at various potentials were mixed with the indophenol indicator for 2 hours and the ultraviolet-visible (UV-Vis) absorption spectrum is plotted in Fig. S10.† The electrolyte solution obtained at −0.2 V (vs. RHE) exhibits the highest absorbance compared with electrolyte solutions under other conditions, indicating the highest eNRR efficiency at −0.2 V (vs. RHE). The RNH3 and corresponding FE of Rh0.6Ru0.4 NAs/CP at different potentials further obtained from calibration curves are shown in Fig. 2c. The highest RNH3 of 57.75 μg h−1 mgcat.−1 with a FE of 3.39% in 0.1 M N2-saturated Na2SO4 solution is observed at −0.2 V (vs. RHE). The RNH3 of Rh0.6Ru0.4 NAs/CP is superior to that of many electrocatalysts recently reported, such as R–WO3 nanosheets,36 Ti3C2Tx nanosheets,37 and Rh nanosheets,38 and Table S1† reveals more comparative information about eNRR performance under mild conditions, proving that the Rh0.6Ru0.4 NAs/CP is indeed an ideal eNRR catalyst. The results shown in Fig. 2d and the corresponding UV-Vis absorption spectrum (Fig. S11†) show that there is a significant difference in NH3 production between Rh0.6Ru0.4 NAs/CP and bare CP after 2 hours of electrolysis at −0.2 V, which strongly proves the effective eNRR activity of Rh0.6Ru0.4 NAs/CP. What's more, negligible N2H4 was detected in the electrolytes after 2 hours of the eNRR process at various potentials as presented in Fig. S12,† indicating the outstanding selectivity of Rh0.6Ru0.4 NAs/CP for the eNRR process.
V (vs. RHE), indicating the existence of the eNRR activity of Rh0.6Ru0.4 NAs/CP in 0.1 M Na2SO4 solution. Then, the RNH3 and FE of Rh0.6Ru0.4 NAs/CP were evaluated from time-dependent current density curves in 2 hours (Fig. 2b). The electrolyte solutions after the eNRR test at various potentials were mixed with the indophenol indicator for 2 hours and the ultraviolet-visible (UV-Vis) absorption spectrum is plotted in Fig. S10.† The electrolyte solution obtained at −0.2 V (vs. RHE) exhibits the highest absorbance compared with electrolyte solutions under other conditions, indicating the highest eNRR efficiency at −0.2 V (vs. RHE). The RNH3 and corresponding FE of Rh0.6Ru0.4 NAs/CP at different potentials further obtained from calibration curves are shown in Fig. 2c. The highest RNH3 of 57.75 μg h−1 mgcat.−1 with a FE of 3.39% in 0.1 M N2-saturated Na2SO4 solution is observed at −0.2 V (vs. RHE). The RNH3 of Rh0.6Ru0.4 NAs/CP is superior to that of many electrocatalysts recently reported, such as R–WO3 nanosheets,36 Ti3C2Tx nanosheets,37 and Rh nanosheets,38 and Table S1† reveals more comparative information about eNRR performance under mild conditions, proving that the Rh0.6Ru0.4 NAs/CP is indeed an ideal eNRR catalyst. The results shown in Fig. 2d and the corresponding UV-Vis absorption spectrum (Fig. S11†) show that there is a significant difference in NH3 production between Rh0.6Ru0.4 NAs/CP and bare CP after 2 hours of electrolysis at −0.2 V, which strongly proves the effective eNRR activity of Rh0.6Ru0.4 NAs/CP. What's more, negligible N2H4 was detected in the electrolytes after 2 hours of the eNRR process at various potentials as presented in Fig. S12,† indicating the outstanding selectivity of Rh0.6Ru0.4 NAs/CP for the eNRR process.
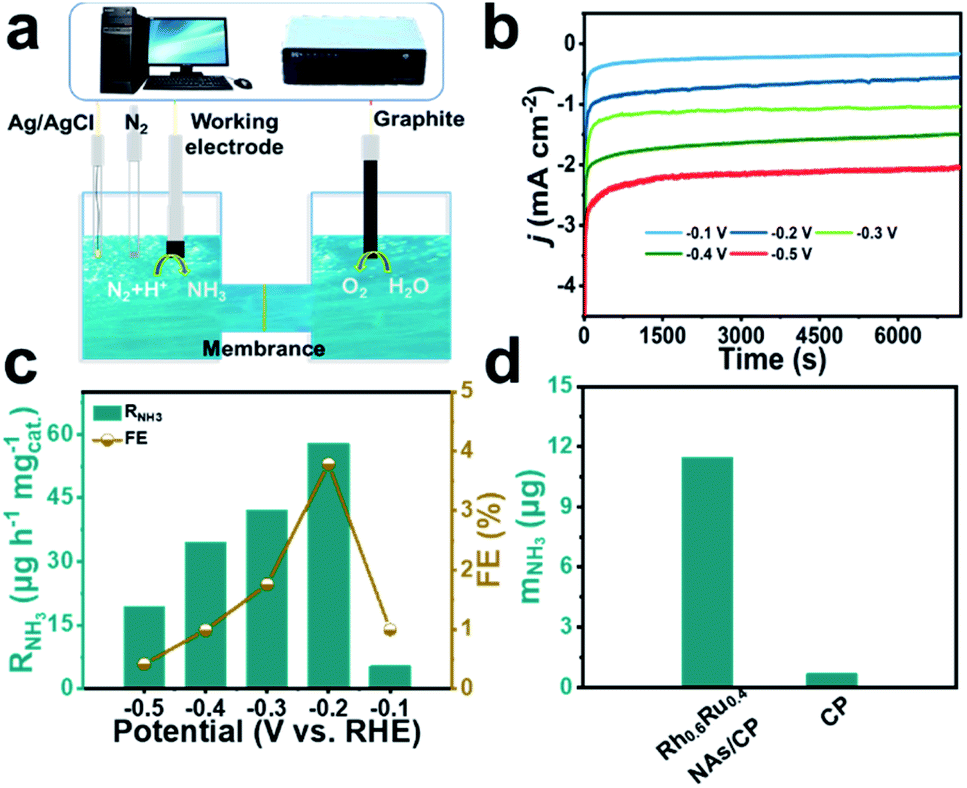 | ||
| Fig. 2 (a) Schematic diagram depicting the electrocatalytic setup for the eNRR test. (b) Chronoamperometry tests of Rh0.6Ru0.4 NAs/CP for the eNRR at different potentials. (c) RNH3 and FE of Rh0.6Ru0.4 NAs/CP for the eNRR test at different potentials. (d) mNH3 of Rh0.6Ru0.4 NAs/CP and bare CP for the eNRR test at −0.2 V (vs. RHE). | ||
The effect of the alloy composition on its eNRR catalytic activity was investigated and compared. We studied the eNRR activity of alloy catalysts with different Rh/Ru ratios in 0.1 M N2-saturated Na2SO4 electrolyte at −0.2 V (vs. RHE). Fig. S13† shows the UV-Vis absorption spectrum of the four catalysts with different Rh/Ru ratios, from which the corresponding RNH3 and FE can be further deduced. It can be seen that the alloy catalysts of all components have high RNH3 and FE (Fig. 3a), which proves that the alloy catalysts have excellent average eNRR activity. Specifically, the alloy catalysts exhibit a high eNRR activity with the increase of the Ru content. The Rh0.6Ru0.4 NAs/CP shows the largest RNH3 (57.75 μg h−1 mgcat.−1) and FE (3.39%) among all the tested catalysts. In order to confirm that the detected NH3 originated from the eNRR on Rh0.6Ru0.4 NAs/CP, three sets of control experiments were carried out under the variables of open circuit potential, Ar-saturated electrolyte, and N2-saturated electrolyte. Fig. 3b shows the RNH3 and FE under different electrochemical conditions and the corresponding UV-Vis absorption spectra of the electrolyte solutions are given in Fig. S14.† It can be seen that only a trace amount of NH3 was detected under the conditions of open circuit potential and the Ar-saturated electrolyte, which may come from the inevitable pollution sources (for example, environment, equipment and membranes). For the alternating cycle electrolysis experiment of the N2-/Ar-saturated electrolyte solution, NH3 was only detected in the N2-saturated electrolytes (Fig. 3c). Moreover, an isotope labeling experiment was carried out to track the source of nitrogen using the Rh0.6Ru0.4 NAs/CP electrode at a potential of −0.2 V (vs. RHE) by feeding 15N2, from which the double coupling peaks corresponding to the 15NH4+ standard can be seen (Fig. S15†). It is strongly proved that ammonia was produced by the eNRR process through the Rh0.6Ru0.4 NAs/CP electrode. In summary, the Rh0.6Ru0.4 NAs/CP has reliable eNRR activity under reasonable potential and N2-saturated electrolyte solution conditions. Fig. 3d shows that the Rh0.6Ru0.4 NAs/CP after long-term electrolysis can still afford the catalytic performance as before, proving its good catalytic stability, and Fig. S16† shows the corresponding time–current density curve. As shown in Fig. 3e, the consecutive six cycles of electrolysis do not lead to obvious changes in the RNH3 and FE, thus reconfirming its good electrocatalytic stability. After the eNRR test, the XRD analysis (Fig. S17†) illustrates that the catalyst is still Rh0.6Ru0.4 NAs, and the SEM image (Fig. S18†) proves that the rich nanosheet structure is well preserved. All results confirm the excellent electrochemical stability of the Rh0.6Ru0.4 NAs/CP electrode. In addition, Fig. 3f illustrates the negligible NH3 yield and FE changes, proving that the diffusion of N2 was a non-rate determining step.
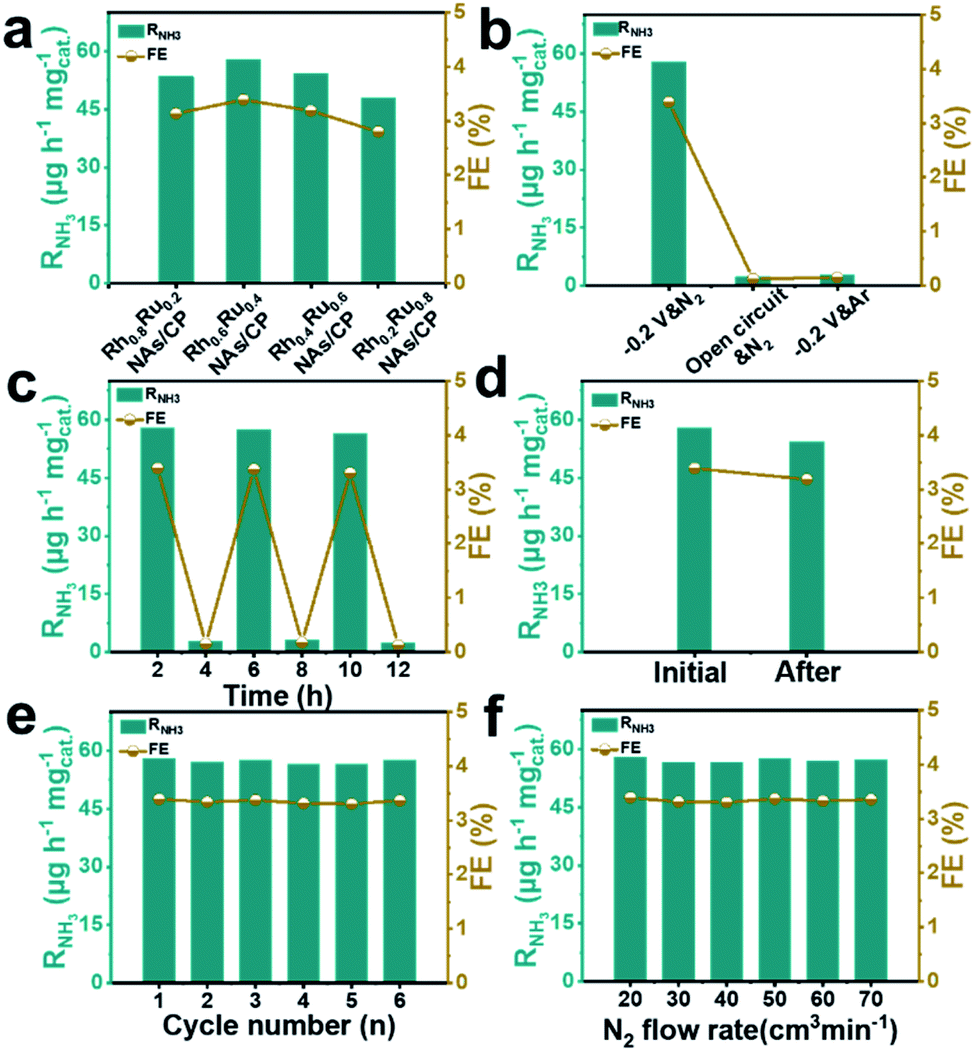 | ||
| Fig. 3 (a) RNH3 and FE for the eNRR test at −0.2 V (vs. RHE) and various Rh/Ru ratios. (b) RNH3 and FE for the eNRR test under different conditions. (c) RNH3 and FE for Rh0.6Ru0.4 NAs/CP with alternating 2 hour cycles between Ar- and N2-saturated electrolytes. (d) RNH3 and FE at −0.2 V (vs. RHE) for 2 hours of initial Rh0.6Ru0.4 NAs/CP and Rh0.6Ru0.4 NAs/CP for 12 hours of electrocatalysis. (e) Recycling stability tests on Rh0.6Ru0.4 NAs/CP at −0.2 V (vs. RHE) for 6 cycles. (f) RNH3 and FE of Rh0.6Ru0.4 NAs/CP for the eNRR test at different N2 flow rates. | ||
To gain atomistic insight into the origin of electrochemical activity of N2 reduction on RhRu nanoalloys, we employed DFT calculations to investigate the catalytic NRR mechanism on the RhRu(111) with a Rh:Ru atom ratio of 1:1, Rh(111) and Ru(111) surfaces. By comparing the adsorption of N2 at the top, bridge and the hollow sites first, it's found that the vertical adsorption of N2 at the top sites of the RhRu(111), Rh(111) and Ru(111) surfaces is the most stable and the Gibbs free energy changes (ΔG) are −0.48 eV, −0.31 eV, and −0.38 eV, respectively (Fig. 4a and S19†). Thus, the RhRu(111) surface has a stronger interaction with N2 with an elongated length of 1.134 Å and can easily adsorb N2 molecules. Furthermore, Bader charge transfer analysis demonstrated that about 0.06e is transferred from the Ru atom to the nearest neighboring atoms. The difference charge density of *N2 (Fig. 4b) clearly illustrated the charge transfer from N2 to positively charged Ru, resulting in the enhanced N2 adsorption activity. As shown in Fig. 4c, the RhRu(111) surface is easier to reduce N2 into *NNH along the distal pathway and the reduction of *N2 to adsorbed *NNH is the potential-determining step (PDS) with a lower energy barrier of 0.95 eV. The subsequent reduction processes are exergonic steps except for the reduction of *N (*NH) into *NH (*NH2) and release of the NH3 molecule with uphill free energy changes of 0.08 eV (0.31 eV) and 0.73 eV. The *N2 and *NH3 species are stably adsorbed on the top site while the *NH2 species has a stable adsorption on the bridge site (Fig. 4d). Our simulation results provided a reasonable explanation on the origin of the enhanced NRR activity for the RhRu nanoalloy that the synergy between Ru and Rh could ensure the stronger N2 adsorption and a lower energy barrier of the PDS.
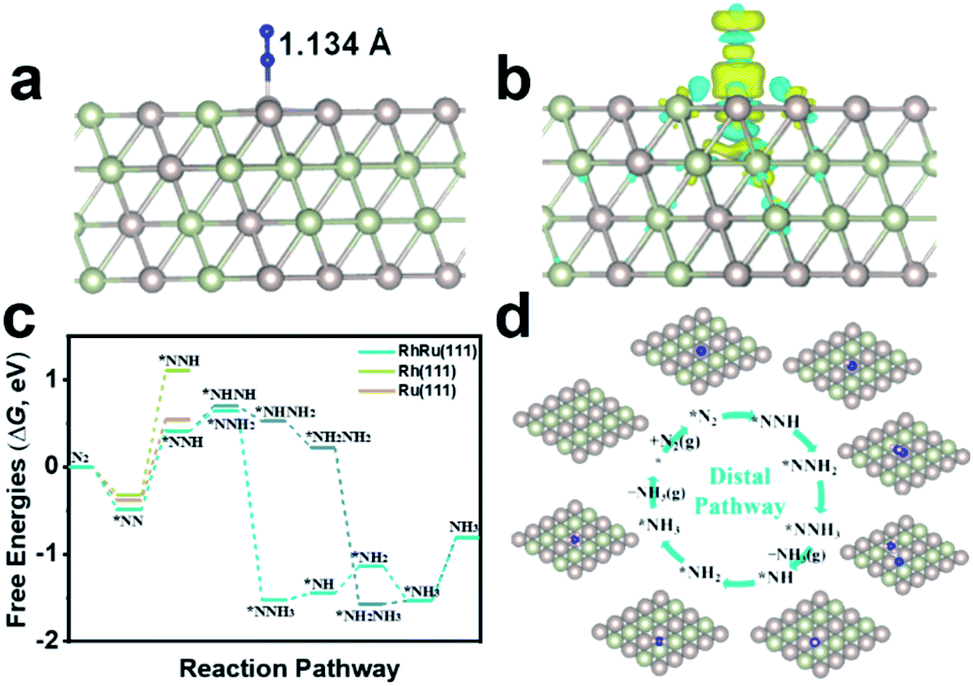 | ||
| Fig. 4 (a) The optimized structure of N2 adsorbed vertically on the Ru top site of the RhRu(111) surface in side view. (b) Difference charge density of N2 adsorption on the RhRu(111) surface with a Rh:Ru atom ratio of 1:1. The yellow and cyan regions represent electron accumulation and depletion, respectively, and the isosurface value is 0.0012 e bohr−3. (c) Calculated free energy diagrams for N2 electroreduction on the RhRu(111) surface with a Rh:Ru atom ratio of 1:1 in a 4 × 4 supercell. (d) The optimized intermediates by the distal pathway in top view. The adsorption site is denoted by an asterisk (*) and the H, N, Rh and Ru atoms are shown in pink, blue, yellow and brown colors, respectively. | ||
In short, the cross-linked frizzy nanosheet structure of Rh0.6Ru0.4 NAs was successfully prepared through a one-step co-reduction strategy and acted as an efficient electrocatalyst for N2 fixation to NH3 under environmental conditions. Thanks to the electronic interaction, geometric effects between the bimetals, and the abundant specific surface area, the RhRu NAs exhibit satisfactory eNRR activity. Further studies on the relationship between the activity and composition showed that Rh0.6Ru0.4 NAs/CP exhibited the highest RNH3 of 57.75 μg h−1 mgcat.−1 and FE of 3.39%, respectively. This research not only provides an efficient alloy nanocatalyst toward electrocatalytic N2 fixation, but also opens up a new way to the rational design and development of alloy-based effective electrocatalysts for artificial NH3 synthesis.
Conflicts of interest
There are no conflicts to declare.Acknowledgements
This study was supported by the National Key Scientific Instrument and Equipment Development Project of China (No. 21627809), Jinan Scientific Research Leader Workshop Project (2018GXRC024 and 2018GXRC021), the Innovation Team Project of Colleges and Universities in Jinan (No. 2019GXRC027), and Special Foundation for Taishan Scholar Professorship of Shandong Province.References
- K. Chu, Y. Liu, Y. Li, Y. Guo and Y. Tian, ACS Appl. Mater. Interfaces, 2020, 12, 7081–7090 CrossRef CAS PubMed.
- X. Zhu, S. Mou, Q. Peng, Q. Liu, Y. Luo, G. Chen, S. Gao and X. Sun, J. Mater. Chem. A, 2020, 8, 1545–1556 RSC.
- T. Wu, W. Kong, Y. Zhang, Z. Xing, J. Zhao, T. Wang, X. Shi, Y. Luo and X. Sun, Small Methods, 2019, 3, 8 Search PubMed.
- T. Wu, H. Zhao, X. Zhu, Z. Xing, Q. Liu, T. Liu, S. Gao, S. Lu, G. Chen, A. M. Asiri, Y. Zhang and X. Sun, Adv. Mater., 2020, 32, 2000299 CrossRef CAS PubMed.
- H. Jin, L. Li, X. Liu, C. Tang, W. Xu, S. Chen, L. Song, Y. Zheng and S. Qiao, Adv. Mater., 2019, 31, 8 Search PubMed.
- L. Li, C. Tang, B. Xia, H. Jin, Y. Zheng and S. Qiao, ACS Catal., 2019, 9, 2902–2908 CrossRef CAS.
- M. Nazemi, P. Ou, A. Alabbady, L. Soule, A. Liu, J. Song, T. A. Sulchek, M. Liu and M. A. El-Sayed, ACS Catal., 2020, 10, 10197–10206 CrossRef CAS.
- X. Ren, G. Cui, L. Chen, F. Xie, Q. Wei, Z. Tian and X. Sun, Chem. Commun., 2018, 54, 8474–8477 RSC.
- X. Zhu, Z. Liu, H. Wang, R. Zhao, H. Chen, T. Wang, F. Wang, Y. Luo, Y. Wu and X. Sun, Chem. Commun., 2019, 55, 3987–3990 RSC.
- X. Lv, F. Wang, J. Du, Q. Liu, Y. Luo, S. Lu, G. Chen, S. Gao, B. Zheng and X. Sun, Sustainable Energy Fuels, 2020, 4, 4469–4472 RSC.
- J. Kim and D. C. Rees, Biochemistry, 1994, 33, 389–397 CrossRef CAS PubMed.
- F. Mus, A. B. Alleman, N. Pence, L. C. Seefeldt and J. W. Peters, Metallomics, 2018, 10, 523–538 CrossRef CAS PubMed.
- P. Xing, S. Wu, Y. Chen, P. Chen, X. Hu, H. Lin, L. Zhao and Y. He, ACS Sustainable Chem. Eng., 2019, 7, 12408–12418 CAS.
- Y. Liao, J. Qian, G. Xie, Q. Han, W. Dang, Y. Wang, L. Lv, S. Zhao, L. Luo, W. Zhang, H. Jiang and J. Tang, Appl. Catal., B, 2020, 273, 119054 CrossRef CAS.
- L. Zhao, J. Zhao, J. Zhao, L. Zhang, D. Wu, H. Wang, J. Li, X. Ren and Q. Wei, Nanotechnology, 2020, 31, 29LT01 CrossRef CAS PubMed.
- F. Wang, X. Lv, X. Zhu, J. Du, S. Lu, A. A. Alshehri, K. A. Alzahrani, B. Zheng and X. Sun, Chem. Commun., 2020, 56, 2107–2110 RSC.
- B. Liu, Y. Zheng, H. Peng, B. Ji, Y. Yang, Y. Tang, C. Lee and W. Zhang, ACS Energy Lett., 2020, 5, 2590–2596 CrossRef CAS.
- Y. Liu, Y. Luo, Q. Li, J. Wang and K. Chu, Chem. Commun., 2020, 56, 10227–10230 RSC.
- X. Cui, C. Tang and Q. Zhang, Adv. Energy Mater., 2018, 8, 1800369 CrossRef.
- M. Nazemi, S. R. Panikkanvalappil and M. A. El-Sayed, Nano Energy, 2018, 49, 316–323 CrossRef CAS.
- H. Huang, L. Xia, X. Shi, A. M. Asiri and X. Sun, Chem. Commun., 2018, 54, 11427–11430 RSC.
- K. Zhang, R. Guo, F. Pang, J. He and W. Zhang, ACS Sustainable Chem. Eng., 2019, 7, 10214–10220 CrossRef CAS.
- G. Deng, T. Wang, A. A. Alshehri, K. A. Alzahrani, Y. Wang, H. Ye, Y. Luo and X. Sun, J. Mater. Chem. A, 2019, 7, 21674–21677 RSC.
- Y. Chen, R. Guo, X. Peng, X. Wang, X. Liu, J. Ren, J. He, L. Zhuo, J. Sun, Y. Liu, Y. Wu and J. Luo, ACS Nano, 2020, 14, 6938–6946 CrossRef CAS PubMed.
- Z. Wang, Y. Li, H. Yu, Y. Xu, H. Xue, X. Li, H. Wang and L. Wang, ChemSusChem, 2018, 11, 3480–3485 CrossRef CAS PubMed.
- J. Wang, L. Yu, L. Hu, G. Chen, H. Xin and X. Feng, Nat. Commun., 2018, 9, 1795 CrossRef PubMed.
- E. Skúlason, T. Bligaard, S. Gudmundsdóttir, F. Studt, J. Rossmeisl, F. Abild-Pedersen, T. Vegge, H. Jónsson and J. K. Nørskov, Phys. Chem. Chem. Phys., 2012, 14, 1235–1245 RSC.
- H. Jiang and Q. Xu, J. Mater. Chem., 2011, 21, 13705–13725 RSC.
- Y. Liu, L. Huang, X. Zhu, Y. Fang and S. Dong, Nanoscale, 2020, 12, 1811–1816 RSC.
- Q. Zhang, Y. Shen, Y. Hou, L. Yang, B. Chen, Z. Lei and W. Zhang, Electrochim. Acta, 2019, 321, 134691 CrossRef CAS.
- M. Bondesgaard, N. L. N. Broge, A. Mamakhel, M. Bremholm and B. B. Iversen, Adv. Funct. Mater., 2019, 29, 1905933 CrossRef CAS.
- Z. Ding, K. Wang, Z. Mai, G. He, Z. Liu and Z. Tang, Int. J. Hydrogen Energy, 2019, 44, 24680–24689 CrossRef CAS.
- M. Rakap, J. Alloys Compd., 2015, 649, 1025–1030 CrossRef CAS.
- X. Li, T. Li, Y. Ma, Q. Wei, W. Qiu, H. Guo, X. Shi, P. Zhang, A. M. Asiri, L. Chen, B. Tang and X. Sun, Adv. Energy Mater., 2018, 8, 1801357 CrossRef.
- G. W. Watt and J. D. Chrisp, Anal. Chem., 1952, 24, 2006–2008 CrossRef CAS.
- W. Kong, R. Zhang, X. Zhang, L. Ji, G. Yu, T. Wang, Y. Luo, X. Shi, Y. Xu and X. Sun, Nanoscale, 2019, 11, 19274–19277 RSC.
- J. Zhao, L. Zhang, X. Xie, X. Li, Y. Ma, Q. Liu, W. Fang, X. Shi, G. Cui and X. Sun, J. Mater. Chem. A, 2018, 6, 24031–24035 RSC.
- H. Liu, S. Han, Y. Zhao, Y. Zhu, X. Tian, J. Zeng, J. Jiang, B. Y. Xia and Y. Chen, J. Mater. Chem. A, 2018, 6, 3211–3217 RSC.
Footnotes |
| † Electronic supplementary information (ESI) available: Experimental section and figures. See DOI: 10.1039/d0ta09099a |
| ‡ Lei Zhao and Xuejing Liu contributed equally to this work. |
| This journal is © The Royal Society of Chemistry 2021 |