 Open Access Article
Molecular mobility in cellulose and paper
Björn
Kuttich
*a,
Ann-Kathrin
Grefe
a,
Henri
Kröling
b,
Samuel
Schabel
b and
Bernd
Stühn
a
aExperimental Condensed Matter Physics, TU Darmstadt, Germany. E-mail: b.kuttich@fkp.physik.tu-darmstadt.de; Tel: +49 6151 16 2584
bFachgebiet Papierfabrikation und Mechanische Verfahrenstechnik, TU Darmstadt, Germany
First published on 31st March 2016
Abstract
We study the dielectric relaxation in paper of different density and in microcrystalline cellulose in a temperature range between 150 K and 350 K. Qualitatively the spectra display the same relaxations α, β, γ. An additional relaxation, βwet, is found in humidified samples. The adsorption of water is determined and related to the humidity of the surrounding. Two adsorption processes are identified as primary and secondary adsorption at the hydroxyl groups in the amorphous domains of the cellulose. The γ process in the dielectric spectrum is found to be directly related to the amount of water adsorbed in the sample. While qualitatively the differences to unprocessed, microcrystalline cellulose are negligible, quantitatively the less localised β-relaxation shows an increased relaxation strength induced by the geometrical confinement and orientation effects due to the processing into cellulose fibres. While the manufacturing process leads to paper with different density and porosity there is no significant change in water uptake, structure or dynamics.
1 Introduction
With over 50 weight percent cellulose represents the main part of plant cells and is therefore the most common organic compound in the world. As a consequence of its wide distribution and its availability, cellulose and cellulose based materials are used in many applications like fuel, construction material or in paper. From the point of view of soft matter physics it is a rather complex polymer with a crystallinity of typically more than 70%.1 Cellulose does not dissolve in water, but due to the hydroxy groups in its monomer it displays hygroscopic behaviour which is a relevant property for various applications. Even small amounts of water may lead to drastic modifications of the properties.2–4 It is therefore of great interest to study the impact of water on the molecular dynamics of cellulose and to determine the distribution of water in a humidified sample. It is to be expected that adsorbed water will be present at the cellulose on molecular scale. Considering the porous structure of paper starting with fibrils consisting of amorphous and crystalline cellulose which form fibres with thickness on the scale of micrometers this material offers a range of adsorption sites for water.5,6Water in confinement is known to differ significantly in its thermodynamic properties from bulk water.7 The dynamics of water in confining geometries or close to binding macromolecules is found to be slowed down. In paper the dynamics of adsorbed water may therefore be influenced by confinement effects on a wide range of length scales.
On the side of fundamental research moisturized cellulose is of special interest because on one hand the biopolymer provides a molecular confinement to the adsorbed water molecules on the other hand cellulose itself can easily be brought into a confining geometry by processing it into paper. In doing so two different confinements, for the different molecules on different length scales can be established and need to be considered.
A well suited experimental method to determine the influence of water adsorption on the molecular dynamics of a material is broadband dielectric spectroscopy.8–13 The temperature dependent reorientation of dipole moments in the sample due to an alternating external electric field provides a deep insight into the underlying molecular dynamics.14 In comparison to most polymers water has a strong dipole moment of 1.85 Debye. The presence of water will therefore lead to pronounced changes of the dielectric spectrum like the occurrence of new relaxation processes or the modification of already existing ones.8,13 Even the impact of water on the glass transition can be monitored by dielectric spectroscopy by studying the cooperative α-relaxation.9,10
Being such a powerful technique dielectric spectroscopy has already been used intensively to study the relaxation dynamics of cellulose in its crystalline or amorphous form, in the dry as well as in a humidified state.2,3,15,16 Furthermore, investigations with differential scanning calorimetry and quasielastic neutron scattering were performed, in order do identify especially the water dynamics.17,18 Combining the results from all these techniques three different types of water can be found when dealing with humidified cellulose.2,19 Besides free bulk like water two different types of bound water, freezable and non-freezable, are identified.2,17–19 Together with the intrinsic dynamics of the cellulose these give rise to four observable dielectric relaxations in the frequency range below 107 Hz.16 They are identified as the cooperative α-relaxation due to the dynamic glass transition, two more localised relaxations called β and βwet originating from the glycosidic bond of cellulose and combined polymer water dynamics.
The fastest and most localised mode is the γ-relaxation which is attributed to side group dynamics of glycosidic rings, especially the hydroxy groups.16 All these four relaxations are found to be sensitive to the presence of water in the sample.
First investigations of a cellulose based material, in particular paper, were also performed. They focus on charge transport at low frequency and do not systematically analyse the influence of water on relaxation behaviour.20 In addition to water induced changes of dielectric relaxations, the fabrication process of paper as well as its final properties like porosity or density, should be considered as well. In order to investigate all these influences on cellulose dynamics this work studies three differently processed types of paper in the dry and in the humidified state. The water content is varied up to 17 weight percent. All dielectric measurements were accompanied by precise weighing experiments to monitor the water content of the sample. Additional wide angle X-ray measurements were performed in order to investigate structural differences between the different paper samples and microcrystalline cellulose.
2 Experimental details
2.1 Sample preparation
Three different paper samples and one microcrystalline powder sample were used. The microcrystalline cellulose was purchased from Acros Organics with an average particle size of 90 μm. The paper samples were made from bleached eucalyptus pulp that is normally used for the production of graphical paper and consists of short cellulose fibres that were beaten or not beaten. The acronym SFUB here denotes short fibre unbeaten while SFHB means short fibre highly beaten. A detailed description of the fabrication process of these papers can be found elsewhere.21 The third investigated sample SFHB-Cal also consists of short highly beaten fibres but this sample was finally calendered between two cold steel rollers at a line load of 140 N mm−1 to achieve a further compression of the fibres. All three paper samples are purely cellulose based, no additives or fillers were added during the sheet forming. The main difference between the samples is their density and porosity due to the fabrication process as given in Table 1.| Sample | Porosity | Density/g cm−3 |
|---|---|---|
| Cellulose | — | 1.5 |
| SFUB | 0.63 | 0.6 |
| SFHB | 0.44 | 0.8 |
| SFHB-Cal | 0.22 | 1.2 |
For the dielectric spectroscopy measurements on the paper samples a circular piece of paper with a diameter of 25 mm was cut from the larger paper sheets and put in between two gold plated brass electrodes. Weighing experiments were performed on a paper sheet prepared in the same way. Sample size was about four times larger in order to improve the accuracy of the weighing. For the microcrystalline sample the cellulose powder was compressed between the electrodes to form a thin disc.
To dry the samples they were stored for 24 hours in a vacuum oven at 40 °C and around 10 mbar. Hydration was performed in a custom-built humidity chamber, a box made of PMMA in which the samples were stored at room temperature over 24 hours together with selected salts and a digital hygrometer (Testo 174H, ΔT = ±0.1 K, Δrelative humidity = ±3 percentage points). The relative humidity over a saturated salt solution is in general lower than 100%, because water molecules are bound by the salt. The precise equilibrium value depends only weakly on temperature but obviously on the specific type of salt. Using potassium hydroxide, calcium chloride, magnesium nitrate, sodium chloride and pure water it was possible to obtain relative humidities in the chamber between 10% and 99%. Before humidification samples were completely dried as described above.
The drying and humidification was done simultaneously for the samples used in dielectric and weighing experiments to ensure the same storing conditions and thus the same water content for both samples.
2.2 Wide angle X-ray scattering
With wide angle X-ray scattering (WAXS) the crystal structure and orientation as well as the crystallinity ϕc of the different paper samples can be investigated. The crystal structure of cellulose was already determined in 1937 by Meyer and Misch, while Wakelin et al. in the late 50 s proposed a method for the determination of the crystallinity of semicrystalline cellulose samples.1,22 The crystal structure was found to be monoclinic and suggested to be stabilised by inter and intra chain hydrogen bonds between the hydroxy groups.22–24WAXS experiments were performed with a Siemens D500 diffractometer operating on the copper Kα-line with a wavelength of λ = 1.54 Å. The X-ray beam is two times slit collimated before hitting the sample. A monochromator crystal is placed directly in front of the scintillation counter. The WAXS spectra were recorded in θ/2θ mode in a range of scattering angles 2θ between 10° and 40° with at step width of 0.02°. The resolution of the instrumental set-up was determined by measuring a monocrystalline palladium sample to be Δ2θ = 0.12°. WAXS experiments were performed under ambient conditions without special drying or humidification of the samples.
2.3 Weighing experiments
A fairly simple and direct way to determine the water content of a sample are weighing experiments. With a micro balance the weight changes between a completely dry sample and a hydrated sample can be monitored and the water content can be calculated. The weighing experiments were performed with a Sartorius R200D micro balance with an accuracy of ±20 μg. The variation of weight with time was measured in steps of 10 s by connecting a computer to the serial port of the balance. All weighing experiments were performed under ambient conditions. The balance was placed close to the vacuum oven and the humidification chamber thus transferring the samples from their storing conditions to the balance took less than 10 s.In a time resolved weighing experiment we can determine the typical times required for a humidified sample to reach its equilibrium at ambient conditions. Fig. 1 displays the results of this experiment for the example of SFHB-Cal. Starting from different relative humidities as applied in the humidity chamber the measured weight relaxes due to evaporation or adsorption. The typical time scale to reach equilibrium is of the order of 10 minutes and thus clearly shorter than the 24 hours allowed for equilibration in the humidity chamber.
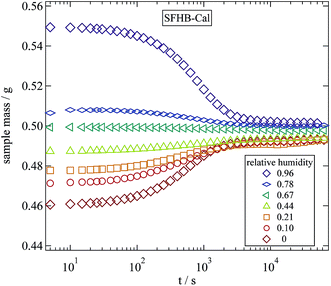 | ||
| Fig. 1 Variation of sample mass over time during a weighing experiment following a 24 hour storage at the given relative humidities. | ||
2.4 Dielectric spectroscopy
For dielectric spectroscopy experiments a Novocontrol Alpha-N High Resolution Dielectric Analyzer was used operating in a frequency range from 10−2 Hz to 107 Hz. Relative uncertainties of the investigated complex permittivity during one measurement are below one percent, however the errors of the absolute values of ε′ and ε′′ are mainly given by the uncertainties of the capacitor geometry and are estimated to be about 2%. Sample temperature was controlled by a Novocontrol Quatro Cryosystem with heated nitrogen gas flow. Temperature stability is better than ±0.1 K while an absolute accuracy of ±0.5 K is reached.Measured dielectric functions were analysed by a sum of phenomenological Cole–Cole functions for the β-, βwet- and γ-relaxation
 | (1) |
Temperature variation of the fitted relaxation times for the β-, βwet- and γ-relaxation was finally described by Arrhenius functions
 | (2) |
3 Results and discussion
3.1 Wide angle X-ray scattering
We start by comparing the crystalline structure of the paper samples with that of microcrystalline cellulose powder. WAXS spectra of the three investigated paper samples as well as microcrystalline cellulose are depicted in Fig. 2. The assignment of the different peaks is done according to Meyer and Misch.22 In their definition of the unit cell the backbone of the cellulose polymer is oriented along the b-axis while the glycosidic rings are lying in the bc-plane. Thus the (040) peak gives information about the length of a monomeric unit and the (002) peak about the inter chain distance in the plane of the glycosidic rings. Obviously all peak positions are almost identical for all samples and correspond well with the literature.22 The small shoulder at 2θ ≈ 12° is due to background scattering from the brass sample holder.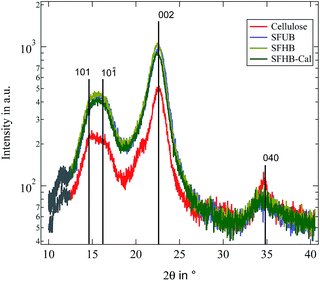 | ||
| Fig. 2 Recorded WAXS patterns for all investigated paper samples as well as microcrystalline cellulose. Black lines indicate expected peak positions.22 Grey part of the curves is due to background scattering from the sample holder. | ||
In contrast to the peak position we find the relative peak intensities to be strongly dependent on the paper processing. While the intensity of the first three peaks is enhanced in the paper samples the (040) peak is reduced. This is possibly due to an orientation of the cellulose fibres in the paper. With the WAXS experiment measuring in a reflecting geometry the sample structure can only be probed in the direction orthogonal to the surface. For microcrystalline cellulose this is not important because a powder average is measured and thus crystallites in any orientation should be present. For the paper samples this might not be the case because they are not isotropic and as a consequence scattering from structures parallel to the paper surface contribute less to the scattering profile. The reduced intensity of the (040) peak while the other peaks show an enhanced scattering intensity is thus indicating that the cellulose crystallites and thus the backbone of the cellulose polymer is partially oriented in parallel to the paper surface and not isotropically distributed. In order to quantify this degree of orientation we performed a rocking scan around the (040) peak position and calculated the Herman orientation factor in relation to the normal of the paper surface.25 It turned out to be f = −0.42. Thus the backbone of the cellulose polymer is highly oriented along the paper surface.
Finally it is possible to determine the crystallinity of the samples by decomposing the profiles into an amorphous and a crystalline signal as proposed by Wakelin et al.1 Obviously this procedure is not fully correct for the paper samples because of the existing orientation discussed above, but it nevertheless provides a good estimate. The resulting crystallinities are found to be ϕc = 85% for the microcrystalline cellulose and ϕc = 92% for the paper samples.
3.2 Humidity chamber and weighing experiments
The development of relative humidity and temperature around the sample in the humidity chamber were logged every minute by the digital hygrometer. A detailed description of the set-up of the humidity chamber is given elsewhere.8 The weighing experiments were performed on all three paper samples and on microcrystalline cellulose. From the completely dried samples the pure weight of the paper was determined and thus the relative amount of water in the humidificated samples could be calculated. The results are depicted in Fig. 3.
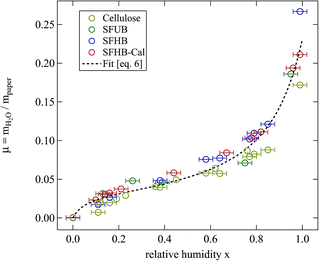 | ||
| Fig. 3 Relative mass of water adsorbed at room temperature by the different paper samples and cellulose while stored for 24 h at the given relative humidity. The dashed line is a fit of eqn (6) to all the data points. | ||
Fig. 3 clearly shows that independent of the type of paper and its porosity data fall on a universal curve. In particular pore size does not play a significant role. However, data for microcrystalline cellulose are systematically lower than those for the paper samples. All samples show a maximum amount of adsorbed water around μ = 0.23 when stored for 24 h at 99% relative humidity.
The second interesting point is the non-linear dependence of water uptake on humidity. Following an intermediate level of μ ≈ 0.04 the relative mass of adsorbed water increases sharply at larger values of humidity. This points at the presence of two adsorption mechanisms.
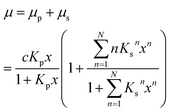
For a quantitative analysis of water uptake of the samples in dependence on relative humidity during the storing procedure the different processes of water adsorption have to be discussed. Water uptake μ is given by the mass of adsorbed water mH2O divided by the mass ms of the dry sample. The first process to be considered is the binding of water molecules via hydrogen bonds to primary binding sites, the hydroxyl groups, of the cellulose monomers.16 This can be described by the following Langmuir type equation:26–28
 | (3) |
 | (4) |
A third possible process of water adsorption is capillary condensation since the investigated samples are porous materials with typical mean pore sizes of about several μm.5,6 The critical pore radius rc for capillary condensation can be derived from the Kelvin equation and is given by:28
 | (5) |
 | (6) |
Up to relative humidities around 50% water uptake is dominated by the binding of water molecules to the primary binding sites of the cellulose monomer. For higher humidities the slope of the function increases drastically due to the secondary adsorption process. The dashed line shown in Fig. 3 is a fit of eqn (6) which obviously describes the data very well. The number of molecules adsorbed in the secondary process is treated as a fit parameter.
The primary binding site concentration c resulting from the fit is c = 0.6 binding sites per cellulose monomer. This value is surprisingly low compared to the six hydroxyl groups of the monomer. Considering that WAXS determined the crystallinity of the samples to be ≈90% the result is very plausible. The hydroxyl groups in the crystalline part already form hydrogen bonds to stabilize the crystal and therefore cannot act as primary binding sites for the adsorption of water molecules. Thus only the hydroxyl groups located in the 10% amorphous parts of the samples will contribute to water adsorption.
The equilibrium constant for the primary adsorption process turns out to be Kp = 17.4, so the adsorption is much faster than the desorption process. Looking at the parameters of the secondary adsorption process the equilibrium constant is fitted to Ks = 0.87 and the number of secondarily adsorbed water molecules turns out to be N = 34. This accounts for the strongly increasing water uptake at relative humidities above x = 0.8. In conclusion the water adsorption of the different samples can be quantified with a model of primary and secondary adsorption processes an the resulting parameters can now be used for the interpretation of the dielectric spectra.
3.3 Dielectric spectroscopy
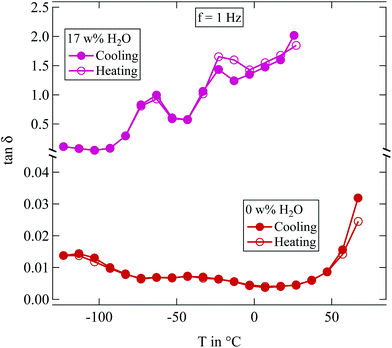 | ||
Fig. 4 Loss tangent tan![[thin space (1/6-em)]](https://www.rsc.org/images/entities/char_2009.gif) δ measured at 1 Hz of two differently humidified SFHB-Cal samples. Measurements started at the highest temperature shown, down to 150 K and up again. δ measured at 1 Hz of two differently humidified SFHB-Cal samples. Measurements started at the highest temperature shown, down to 150 K and up again. | ||
In view of the results shown in Section 2.3 this may seem surprising as it was shown there that water content of the samples changes on the time scale one hour. However, the sample in the dielectric experiment is contained between capacitor plates and there is only a negligible surface area available for evaporation. Samples are effectively sealed within the capacitor and therefore the experiments provide data at constant water content.
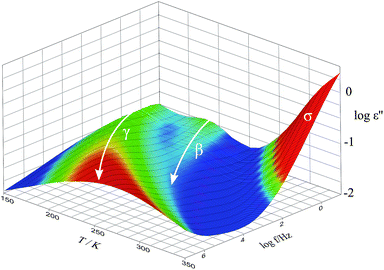 | ||
| Fig. 5 Imaginary part ε′′ of the dielectric function of the SFHB-Cal paper sample in the completely dried state. | ||
In order to compare the dynamics of the different paper samples Fig. 6 depicts the loss tangent tan![[thin space (1/6-em)]](https://www.rsc.org/images/entities/char_2009.gif) δ at a frequency of f = 1 Hz in its variation with temperature. All dry paper samples, as well as the microcrystalline cellulose, show two well distinguishable relaxations which were already seen in Fig. 5 for the SFHB-Cal sample. The loss tangent for both “H” type samples and the cellulose is larger than that of the “U” type paper. The variation with temperature, however, is similar for all three paper types and for the cellulose.16 The difference in the absolute values of the loss tangent might be due to the orientation of cellulose fibres in the paper samples as seen in the WAXS experiments. While the microcrystalline powder should be isotropic this holds no longer true in the paper sample. Indeed investigations by Ek et al. measuring the dielectric spectra of cellulose based paper in and out of the paper plane indicate at f = 1 Hz a higher loss tangent for out of plane measurements by roughly a factor of two.20
δ at a frequency of f = 1 Hz in its variation with temperature. All dry paper samples, as well as the microcrystalline cellulose, show two well distinguishable relaxations which were already seen in Fig. 5 for the SFHB-Cal sample. The loss tangent for both “H” type samples and the cellulose is larger than that of the “U” type paper. The variation with temperature, however, is similar for all three paper types and for the cellulose.16 The difference in the absolute values of the loss tangent might be due to the orientation of cellulose fibres in the paper samples as seen in the WAXS experiments. While the microcrystalline powder should be isotropic this holds no longer true in the paper sample. Indeed investigations by Ek et al. measuring the dielectric spectra of cellulose based paper in and out of the paper plane indicate at f = 1 Hz a higher loss tangent for out of plane measurements by roughly a factor of two.20
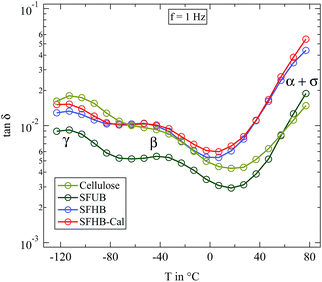 | ||
Fig. 6 Loss tangent tan![[thin space (1/6-em)]](https://www.rsc.org/images/entities/char_2009.gif) δ measured at 1 Hz for completely dried paper samples in comparison with microcrystalline cellulose. δ measured at 1 Hz for completely dried paper samples in comparison with microcrystalline cellulose. | ||
The principal features of the dielectric relaxation in dry cellulose can also be found in the processed form as paper. The local relaxations β and γ are clearly visible, the former even stronger than in pure cellulose. On first glance there is no clear difference in the dielectric data due to the processing type. In particular the porosity of the paper does seemingly not influence the observed dielectric relaxations. In the following we will discuss the dielectric spectra in more detail.
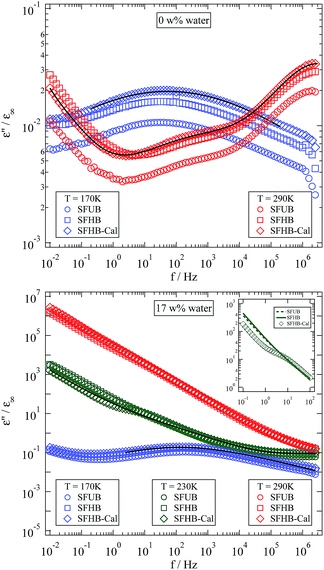
The most apparent change in the spectra caused by adsorbed water is emphasized in the inset of Fig. 7. An additional relaxation appears in between the β- and the α-relaxation.2–4,16 This new relaxation is usually addressed as βwet-relaxation since it can only be observed in humidified samples and is attributed to the dynamics of polymer–water complexes.2,4,16
At both humidities the dielectric spectra at 170 K show one pronounced relaxation with a relaxation time that is the same for all samples. The relaxation strength, however, displays a clear dependency on the manufacturing process. The sample with the highest porosity displayed the lowest relaxation strength. Looking at 290 K where a second relaxation has entered the frequency window for the dry samples the same situation is observed. Analysing the system with a high water level becomes difficult at elevated temperatures because of a strong dc conductivity contribution.
Focussing on a slightly lower temperature conductivity is weak enough for the βwet-relaxation to become visible again. Surprisingly this only works for the calendered sample as it is shown in the inset of the lower tile of Fig. 7. A close inspection of this inset reveals, that the visibility of the βwet-relaxation in this sample is not due to a higher relaxation strength but to a lower dc conductivity of the calendered sample. Since at higher temperatures, like 290 K for example, the SFHB-Cal sample shows the highest conductivity, the question arises what is the cause for the seemingly reduced conductivity at 230 K in comparison to the other samples. A possible explanation might be the emergence of the α-relaxation. According to Roig et al. the glass transition temperature Tg is strongly reduced by the presence of water, which might lead to a Tg around room temperature for the humidified samples shown here.16 Thus the power law like increase of the dielectric loss at low frequencies might not only be caused by the dc conductivity (leading to a ε′′(f) ∝ f−ν behaviour, with ν = 1) but also by the increasing contribution of the α-relaxation. A clear distinction between both contributions could only be found in the frequency range below 10−2 Hz which is not accessible in our experiment. A supporting observation for this speculation is the fact that for the SFUB and the SFHB sample the power law exponent ν is not one but significantly less (around ν = 0.9).
Comparison of the dielectric function obtained for three differently processed paper samples shows a clear variation of the absolute value of the dielectric loss. It is higher for the less porous paper. Accordingly the relaxation strength of the βwet-relaxation and probably the α-relaxation as well are stronger in the sample with the lowest porosity, thus both are affected by calendering the sample. The relaxation times of the observable dielectric relaxations, however, are not influenced by the manufacturing process. For further analysis of the influence of water on the dielectric properties of cellulose based paper we will therefore focus on the SFHB-Cal sample. It displays a pronounced βwet-relaxation which can be determined with high accuracy.
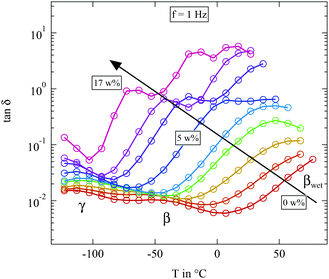 | ||
Fig. 8 Loss tangent tan![[thin space (1/6-em)]](https://www.rsc.org/images/entities/char_2009.gif) δ measured at 1 Hz of the differently humidified SFHB-Cal sample. Arrow indicates increasing weight percent of water. δ measured at 1 Hz of the differently humidified SFHB-Cal sample. Arrow indicates increasing weight percent of water. | ||
The most striking feature seen in the figure is the evolution of the βwet-relaxation with increasing humidity. For the completely dried sample it cannot be distinguished from dc conductivity. But it is clearly present at higher water content. With increasing humidity the relaxation shifts from above 80 °C to −70 °C as shown by the arrow in Fig. 8. The addition of water has a strong plasticizer effect which has also been observed in pure cellulose.16
As opposed to this very direct observation the influence of water on the β- and γ-relaxation is more difficult to see. Fig. 9 gives a detailed view of the temperature range in which these two relaxations can be observed.
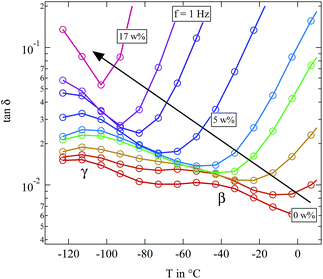 | ||
Fig. 9 Detailed view of loss tangent tan![[thin space (1/6-em)]](https://www.rsc.org/images/entities/char_2009.gif) δ of the differently humidified SFHB-Cal sample. Arrow indicates increasing weight percent of water. δ of the differently humidified SFHB-Cal sample. Arrow indicates increasing weight percent of water. | ||
In microcrystalline cellulose the γ-relaxation displays a relaxation time which is unaffected by water. Only for high hydration levels it moves to lower temperatures.16 The β-relaxation in contrast shows a strong increase in the loss tangent with rising water content and becomes significantly faster.16 The situation is not so clear for the paper sample. The β-relaxation seems to be stronger at low water contents than it is found in the microcrystalline cellulose. But for higher water fractions of around 3 weight percent the β-relaxation completely merges with the γ-relaxation and both become indistinguishable. If even more water is present, the whole spectrum becomes dominated by the βwet-relaxation and in contrast to literature absolutely no β-relaxation is observable. In order to clarify if these differences in the loss tangent between the paper sample and the microcrystalline cellulose are due to preferred orientations of the cellulose fibres in the paper, we also had a closer look on the dielectric features of microcrystalline cellulose.
The equivalent representation of the loss tangent at f = 1 Hz for the microcrystalline cellulose for different levels of humidification is shown in Fig. 10. While the results fit quite well with our findings on cellulose based paper some significant differences to the literature can be seen.16 Due to the higher number of investigated humidities it becomes clear that the relaxation slightly below −50 °C at the highest humidification level is not the β-relaxation but has to be assigned to the βwet-relaxation instead. The β-relaxation itself shows the same behaviour as in paper. It accelerates significantly already at very low hydration levels and merges for water contents below 3 weight percent indistinguishably with the γ-relaxation, just as we observed in the paper. Thus the additional relaxation which can be seen at the highest hydration levels around 0 °C can not be attributed as the βwet-relaxation but has to be the upcoming α-relaxation. In conclusion almost no differences in the loss tangent can be found between microcrystalline cellulose and cellulose processed into paper.
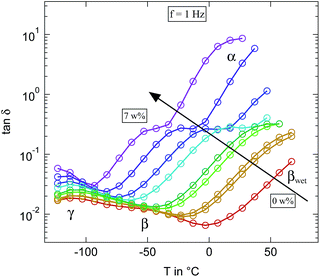 | ||
Fig. 10 Loss tangent tan![[thin space (1/6-em)]](https://www.rsc.org/images/entities/char_2009.gif) δ measured at 1 Hz of the differently humidified microcrystalline cellulose sample. Arrow indicates increasing weight percent of water. δ measured at 1 Hz of the differently humidified microcrystalline cellulose sample. Arrow indicates increasing weight percent of water. | ||
To get a deeper insight in the correlation between water adsorption and dielectric relaxation in the paper sample we closely analysed the dielectric spectra at specified water fraction and temperature. We use the sum of three Cole–Cole functions as given in Section 2.4 and shown in Fig. 7 to describe γ-, βwet- and β-relaxation. As can be seen for selected curves in Fig. 7 the fitting model is well capable to describe all the important features of the dielectric spectra with satisfying accuracy.
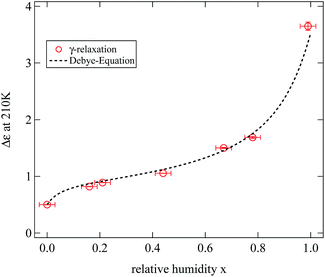
As a first interesting parameter we focus on the relaxation strength Δε of the γ-relaxation. Fig. 11 displays the results obtained at a fixed temperature of 210 K for the full range of humidities. The resulting dependence is obviously similar to the variation of the water mass fraction determined in the sample for the same humidities. This leads to the conclusion that the strength of the γ-relaxation is directly proportional to the mass fraction of water in the sample. In crystalline cellulose this relaxation is indeed assigned to local dynamics of the hydroxyl groups.2,16 In the discussion of the location of adsorbed water we had assumed these groups to be the primary adsorption sites and thus described the results of the weighing experiments.
The strength of the dielectric relaxation caused by a dipole moment p is in its most simple form given by the Debye equation:
 | (7) |
In this expression thermal energy is given by kBT and N/V is the number density of dipoles. Taking the relaxation strength of Δε = 0.5 of the γ-relaxation at 210 K in the completely dried state, and assuming a dipole moment for the hydroxyl groups equivalent to the one of ethanol of p = 1.7 Debye, the number density of dipole moments can be calculated to be 5.3 dipoles per cellulose monomer.30 This value is quite close to the six hydroxyl groups of each monomer and thus fits well to the molecular origin of the γ-relaxation proposed by Einfeldt.2
To describe the relaxation strength of the humidified samples we calculated the number density of water molecules based on our weighing experiments, again used the Debye equation and added the result to the relaxation strength of the dried sample. The dipole moment of water molecules adsorbed at the hydroxyl group pw was treated as a fitting parameter. The total calculated relaxation strength is shown in Fig. 11 as a dashed line and describes nicely the experimental data. This supports the picture of the dielectric γ-relaxation to be the combined relaxation of the hydroxyl groups with adsorbed water molecules.
The dipole moment pw obtained from the fit is pw = 4.7 Debye. This value is clearly too large to be associated with the dipole moment of a free water molecule. We note that the simple expression 7 does not include a Kirkwood correlation factor which would have to be known in order to relate the relaxation strength to the molecular dipole moment.14
If our conclusions on the origin of the γ-relaxation and how it is influenced by water are correct, then the same behaviour which is seen in paper should also be present in the microcrystalline cellulose. Indeed the weighing experiments have shown (see Fig. 3) that there was no qualitative difference in the water uptake between paper and microcrystalline cellulose. In order to demonstrate that this also holds true for the relaxation strength of the γ-relaxation Fig. 12 depicts the normalised relaxation strength Δε/ε∞ for the SFHB-Cal paper sample and the microcrystalline cellulose plotted against the weight percentage of adsorbed water. Here ε∞ was determined for each sample individually from the real part of the dielectric function at 1 MHz. The normalisation was again performed to remove uncertainties in the geometry of the different sample cells. Fig. 12 shows very clearly that the normalised dielectric relaxation strength of the γ-relaxation increases linearly with the amount of adsorbed water and is independent of the investigated samples. Thus the interpretation of the γ-relaxation originating from hydroxyl group dynamics in combination with adsorbed water is consistent.
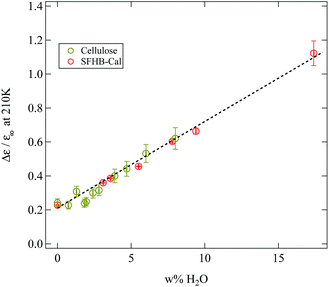 | ||
| Fig. 12 Normalised relaxation strength of the γ-relaxation at 210 K plotted against the mass fraction of water present in the sample. A linear dependency independent from the sample type can be seen. | ||
The effects of water uptake on the other two relaxations are difficult to analyse due the strong changes in relaxation times. Focusing on the βwet-relaxation as seen in the tan![[thin space (1/6-em)]](https://www.rsc.org/images/entities/char_2009.gif) δ representation in Fig. 8 an increase in the loss tangent of this relaxation can be seen, up to a water content of approximately five weight percent. Higher water contents only lead to a strong decrease in relaxation time but not to a further increase in tan
δ representation in Fig. 8 an increase in the loss tangent of this relaxation can be seen, up to a water content of approximately five weight percent. Higher water contents only lead to a strong decrease in relaxation time but not to a further increase in tan![[thin space (1/6-em)]](https://www.rsc.org/images/entities/char_2009.gif) δ. From a comparison with the weighing results in Fig. 3 we find five weight percent of water to be the plateau value at which the water adsorption at the primary binding sides saturates. Therefore one might conclude that the βwet-relaxation is related to this primarily bound water and its dynamics. According to Einfeldt et al. and Roig et al. the origin of this relaxation in cellulose is related to conformational changes of molecular confined water.4,16 Surprisingly Roig et al. see a strong enhancement of the βwet-relaxation also for water contents beyond five weight percent, which might be due to their assignment of the different relaxations. Einfeldt et al. in contrast find a saturation similar to our observations for most of their samples. In conclusion the βwet-relaxation clearly relies on the presence of water in the sample but the details of the molecular dynamics are still under discussion.
δ. From a comparison with the weighing results in Fig. 3 we find five weight percent of water to be the plateau value at which the water adsorption at the primary binding sides saturates. Therefore one might conclude that the βwet-relaxation is related to this primarily bound water and its dynamics. According to Einfeldt et al. and Roig et al. the origin of this relaxation in cellulose is related to conformational changes of molecular confined water.4,16 Surprisingly Roig et al. see a strong enhancement of the βwet-relaxation also for water contents beyond five weight percent, which might be due to their assignment of the different relaxations. Einfeldt et al. in contrast find a saturation similar to our observations for most of their samples. In conclusion the βwet-relaxation clearly relies on the presence of water in the sample but the details of the molecular dynamics are still under discussion.
We now turn to a discussion of the relaxation times for the three processes found in dielectric spectroscopy and their variation with temperature and water content. The mean relaxation times obtained from Cole–Cole fits are presented in an Arrhenius representation in Fig. 13. Since β- and βwet-relaxation are strongly overlapping for different water contents, they are displayed separately in the upper and lower tile of Fig. 13. In both tiles the same γ-relaxation is included for better comparison.
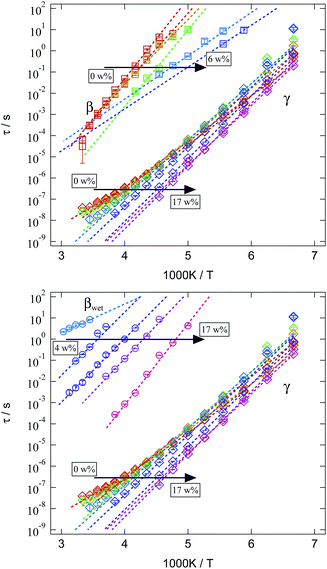 | ||
| Fig. 13 Arrhenius representation of the mean relaxation times of the three analysed relaxations for different water contents in the SFHB-Cal sample. For clarification β- and βwet-relaxation are given separately, while the γ-relaxation is the same in both tiles. Colour code is identical to Fig. 8. | ||
All relaxations display a pronounced Arrhenius behaviour in their variation with temperature. Relaxation times decrease with rising water content. Whereas this is a general observation for all relaxations this effect is rather weak for the γ-relaxation and strongly pronounced for the β- and βwet-relaxation. In order to quantify these differences the mean relaxation times are fitted by an Arrhenius law (eqn (2)) and the activation energy EA is given in Fig. 14.
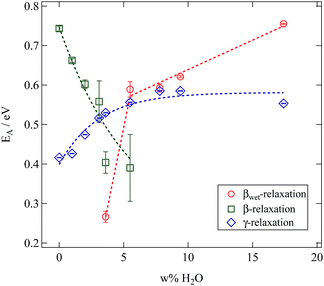 | ||
| Fig. 14 Results of fitting an Arrhenius function to the mean relaxation times of the SFHB-Cal sample depending on the water fraction in the sample. | ||
The βwet- and the γ-relaxation both show the same behaviour with rising water contents, their activation energies are increasing. This indicates a reduced mobility. As both relaxations are related to the water content it seems reasonable to see the origin for this change in mobility in a growing hydrogen bond network between cellulose and water molecules.16 In case of the γ-relaxation this affects cellulose side group dynamics, for the βwet-relaxation molecular confined water might be the cause.4,16,31
The activation energies of the γ-relaxation increase from slightly below EA = 0.5 eV. This value corresponds to the energy required to break two hydrogen bonds.32 Above a water content of five weight percent the activation energy is constant. This supports our conclusion drawn from the relaxation strength. Additional water adsorbs on secondary sites and does not modify the relaxation mechanism.
The activation energy of the βwet-relaxation can not be determined for low water content. It jumps from a value close to the dissociation energy of one hydrogen bond to that of two bonds at a water content of 5%.
The β-relaxation displays a significantly different behaviour. As is seen in Fig. 14 for this relaxation the activation energy drops with increasing water content. Results at larger water content contain a significantly larger error. Thus water works as a plasticiser for this relaxation. The cellulose chain mobility is enhanced by the presence of water. As already seen in the loss tangent representation in Fig. 10 the β-relaxation is weaker in the microcrystalline cellulose sample than in the paper sample making it impossible to obtain reliable activation energies in the former case.
4 Conclusions
The adsorption of water by differently processed paper and microcrystalline cellulose from a humid atmosphere follows the same basic principles. It is governed by a primary adsorption process linking water to hydroxyl groups in the cellulose. A secondary process continues the adsorption with more water molecules adding to the already adsorbed water. This mechanism is consistently observed by following the change of sample mass with humidity and the determination of the dielectric relaxation strength of the γ process in cellulose. Paper samples as well as microcrystalline cellulose display the same behaviour. The capillary condensation of water in the fibrous structure of paper does not play a significant role. The maximum of 17 weight percent of adsorbed water was achieved in an atmosphere of 99% relative humidity. This value is large in comparison with other polymers.8,10 The density of primary binding sites was found to be 0.6 per monomeric unit. This fits well with the number of hydroxyl groups in the amorphous part of the cellulose.A detailed investigation of the dielectric relaxation in paper and cellulose revealed no significant influence of the manufacturing process of the paper. Differences in the absolute values of the loss tangent are explained by the orientation of cellulose crystallites in the paper samples. The dielectric spectrum displays a β-, βwet- and a γ-relaxation. Their relaxation times are the same in the paper samples as in cellulose. The βwet-relaxation is slightly more pronounced in the calendered sample. This is thought to be caused by the weaker contribution of the α-relaxation or its shift to lower frequency. This slowest process is difficult to observe as it is masked by dc conductivity.
The strength of the γ-relaxation was found to be directly related to the amount of adsorbed water in the sample. Microscopically it is related to the localized dynamics of hydroxyl side groups to the glycosidic rings.2 This is nicely supported by our results. The observed activation energy is close to the energy required to break two hydrogen bonds. It increases with hydration.
For the β-relaxation we find a slightly increased relaxation strength in the paper samples. Its activation energy decreases with the amount of adsorbed water pointing at a plasticizing effect of water. The βwet-relaxation, however, appears rather abruptly at low water content and displays an activation energy that increases with addition of water.
In summary the dielectric relaxation in paper and cellulose is very similar and displays the same relaxation mechanisms. The adsorption of water and its effect on the relaxation behaviour allows to characterise the local dynamics of the cellulose chain. Especially the process of water adsorption is very important for many applications like printing or dyeing of fibrous materials. The α-relaxation itself would furthermore reflect the backbone dynamics. However, it is not accessible in the dielectric experiments.
Acknowledgements
Financial support by the “Deutsche Forschungsgemeinschaft” DFG through the “DFG-Forschergruppe 1583”, project STU191/6-1, is thankfully acknowledged.References
- J. H. Wakelin, H. S. Virgin and E. Crystal, J. Appl. Phys., 1959, 30, 1654–1662 CrossRef CAS.
- J. Einfeldt, D. Meißner and A. Kwasniewski, Macromol. Chem. Phys., 2000, 201, 1969–1975 CrossRef.
- J. Einfeldt, D. Meißner, A. Kwasniewski and L. Einfeldt, Polymer, 2001, 42, 7049–7062 CrossRef CAS.
- J. Einfeldt and A. Kwasniewski, Cellulose, 2002, 9, 225–238 CrossRef CAS.
- C. Dodson, A. Handley, Y. Oba and W. Sampson, Appita J., 2003, 56, 275–280 Search PubMed.
- S. Roberts and W. Sampson, Appita J., 2003, 56, 281–283 Search PubMed.
- M. Chaplin, Adsorption and Phase Behaviour in Nanochannels and Nanotubes, Springer, Netherlands, 2010, pp. 241–255 Search PubMed.
- B. Kuttich, C. Lederle and B. Stühn, J. Chem. Phys., 2013, 139, 244907 CrossRef CAS PubMed.
- R. Puffr and J. Sebenda, J. Polym. Sci., Part C: Polym. Symp., 1967, 16, 79–93 CrossRef.
- E. Laredo and M. Hernández, J. Polym. Sci., Part B: Polym. Phys., 1997, 35, 2879–2888 CrossRef CAS.
- E. Laredo, M. Grimau, F. Sánchez and A. Bello, Macromolecules, 2003, 36, 9840–9850 CrossRef CAS.
- D. Sauer, B. Schuster, M. Rosenstihl, S. Schneider, V. Talluto, T. Walther, T. Blochowicz, B. Stühn and M. Vogel, J. Chem. Phys., 2014, 140, 114503 CrossRef CAS PubMed.
- J. Sjöström, J. Mattsson, R. Bergman, E. Johansson, K. Josefsson, D. Svantesson and J. Swenson, Phys. Chem. Chem. Phys., 2010, 12, 10452–10456 RSC.
- F. Kremer and A. Schönhals, Broadband Dielectric Spectroscopy, Springer-Verlag, 2003 Search PubMed.
- K. Kaminski, E. Kaminska, K. L. Ngai, M. Paluch, P. Wlodarczyk, A. Kasprzycka and W. Szeja, J. Phys. Chem. B, 2009, 113, 10088–10096 CrossRef CAS PubMed.
- F. Roig, E. Dantras, J. Dandurand and C. Lacabanne, J. Phys. D: Appl. Phys., 2011, 44, 045403 CrossRef.
- H. Hatakeyama and T. Hatakeyama, Thermochim. Acta, 1998, 308, 3–22 CrossRef CAS.
- C. Czihak, M. Müller, H. Schober, L. Heux and G. Vogl, Phys. B, 1999, 266, 87–91 CrossRef CAS.
- V. J. McBrierty, C. M. Keely, F. M. Coyle, H. Xu and J. K. Vij, Faraday Discuss., 1996, 103, 255–268 RSC.
- R. Ek, R. Hill and J. Newton, J. Mater. Sci., 1997, 32, 4807–4814 CrossRef CAS.
- H. Kröling, S. Mehlhase, J. Fleckenstein, N. Nubbo, A. Endres, S. Schabel and F. Miletzky, 19th International Conference on Composite Matreials: Engineering and Modeling of the Tensile Strength of Paper-Thermoset Composites, 2013, pp. 5280–5292 Search PubMed.
- K. H. Meyer and L. Misch, Helv. Chim. Acta, 1937, 20, 232–244 CrossRef CAS.
- A. Frey-Wyssling, Biochim. Biophys. Acta, 1955, 18, 166–168 CrossRef CAS.
- Y. Nishiyama, J. Sugiyama, H. Chanzy and P. Langan, J. Am. Chem. Soc., 2003, 125, 14300–14306 CrossRef CAS PubMed.
- R. S. Stein, J. Polym. Sci., 1958, 31, 327–334 CrossRef CAS.
- L. Cossarutto, T. Zimny, J. Kaczmarczyk, T. Siemieniewska, J. Bimer and J. Weber, Carbon, 2001, 39, 2239–2346 CrossRef.
- S. Furmaniak, P. Gauden, A. Terzyk, G. Rychlicki, R. Wesolowski and P. Kowalczyk, J. Colloid Interface Sci., 2005, 290, 1–13 CrossRef CAS PubMed.
- T. Mashio, K. Sato and A. Ohma, Electrochim. Acta, 2014, 140, 238–249 CrossRef CAS.
- D. Gómez-Díaz and J. Navaza, J. Chem. Eng. Data, 2004, 49, 1406–1409 CrossRef.
- T. Sato and R. Buchner, J. Mol. Liq., 2005, 117, 23–31 CrossRef CAS.
- J. Banys, M. Kinka, J. Macutkevic, G. Völkel, W. Böhlmann, V. Umamaheswari, M. Hartmann and A. Pöppl, J. Phys.: Condens. Matter, 2005, 17, 2843–2857 CrossRef CAS.
- C. Gainaru, A. Fillmer and R. Böhmer, J. Phys. Chem. B, 2009, 113, 12628–12631 CrossRef CAS PubMed.
| This journal is © The Royal Society of Chemistry 2016 |

