Lu
Tian
ab,
Jialin
Shen
c,
Tian
Xu
a,
Lixi
Wang
a,
Le
Zhang
d,
Jing
Zhang
c and
Qitu
Zhang
*a
aCollege of Materials Science and Engineering, Nanjing Tech University, Nanjing 210009, China. E-mail: ngdzqt@163.com
bJiangsu Collaborative Innovation Center for Advanced Inorganic Function Composites, China
cNanjing Center, China Geological Survey, Nanjing 210016, China
dJiangsu Key Laboratory of Advanced Laser Materials and Devices, School of Physics and Electronic Engineering, Jiangsu Normal University, Xuzhou 221116, China
First published on 24th March 2016
A series of (Gd1−xYx)2.94−yAl5O12: 0.06Dy3+,yBi3+(x = 0.3, 0.4, 0.5, 0.6, 0.7, 0.8, 0.9, y = 0.000, 0.015, 0.030, 0.045, 0.060) phosphors has been prepared by a sol–gel combustion method. X-ray diffraction (XRD), scanning electron microscopy (SEM), photoluminescence (PL), diffuse reflection, fluorescence decay curves, temperature-dependent photoluminescence and CIE color coordinates were used to characterize the prepared phosphors. The emission intensity of Dy3+ was greatly improved by co-doping the sensitizer of Bi3+ ions and changing the composition of the matrix via replacing gadolinium with Y3+ ions. The influence of different Y3+ and Bi3+ concentrations on the properties of the phosphor were discussed. The optimized composition was determined to be (Gd0.2Y0.8)2.835Al5O12: 0.06Dy3+,0.045Bi3+. Its intensity is almost double the intensity in YAG: Dy3+,Bi3+, four times stronger than that of GAG: Dy3+,Bi3+ and 15 times stronger than that of YGAG: Dy3+. The band gap and decay curves of the phosphors were investigated to explore the relationship between the intensity and the content of Y3+. In addition, good thermal stability of (Gd0.2Y0.8)2.835Al5O12: 0.06Dy3+,0.045Bi3+ was observed according to the temperature-dependent PL spectra. The enhanced luminescence intensity and good thermal stability of the phosphor are conducive to improved application in the field of white light-emitting diodes (W-LEDs).
In addition, the composition of the matrix crystal has a great influence on the luminescent properties of the phosphor.15 Rare-earth aluminates garnets (Ln3Al5O12, Ln: lanthanide and Y3+, hereafter referred to as LnAG) has exhibited superiorities in terms of high-optical transparency, high threshold for optical damage, and high chemical and radiation stability.16,17 Therefore, LnAG might be the best-known compound and has been proved to be one of the best hosts for the incorporation of rare earth activators.16 Diverse luminescent properties of phosphors can be obtained by replacing the Ln ions with suitable trivalent rare earth ions and the solid solubility is still good.
From the two aspects above, better luminescence of Dy3+ in the garnet matrix was expected through the synergistic effect via co-doping sensitizer while optimizing the composition of the host in this paper. Considering that in both Y3Al5O12 and Gd3Al5O12 host, the emission intensity of Dy3+ had been improved greatly by co-doping Bi3+, (Gd1−xYx)2.94−yAl5O12: 0.06Dy3+,yBi3+(x = 0.3, 0.4, 0.5, 0.6, 0.7, 0.8, 0.9, y = 0.000, 0.015, 0.030, 0.045, 0.060) phosphors were synthesized by sol–gel low temperature combustion method in this work. Their photoluminescence properties were systematically studied. The phenomenon that luminescence of Dy3+ in (Y,Gd)AG is better than in YAG and GAG lattice was demonstrated in this paper. The thermal stability of the optimum composition was also demonstrated. The improved luminescent properties have laid a foundation for better application in the W-LED fields.
![]() | ||
Fig. 1 (a) X-ray diffraction patterns of (Gd1−xYx)2.895Al5O12: 0.06Dy3+,0.045Bi3+(x = 0.3, 0.4, 0.5, 0.6, 0.7, 0.8, 0.9), (b) enlarged view of (420) peak. |
![]() | ||
Fig. 2 Rietveld refinement of the observed XRD patterns for (Gd1−xYx)2.895Al5O12: 0.06Dy3+,0.045Bi3+ phosphors (a) x = 0.3, (b) x = 0.7, (c) x = 0.8, (d) x = 0.9. |
Parameters | x = 0.3 | x = 0.7 | x = 0.8 | x = 0.9 |
Space group |
Ia![]() |
Ia![]() |
Ia![]() |
Ia![]() |
Phase | Cubic | Cubic | Cubic | Cubic |
Lattice parameters a (Å) | 12.0925 | 12.0495 | 12.0328 | 12.0191 |
Cell volume (Å3) | 1768.29 | 1749.47 | 1742.21 | 1736.28 |
R p (%) | 3.03 | 2.74 | 2.76 | 3.05 |
R wp (%) | 5.50 | 4.47 | 4.05 | 4.18 |
The crystal structure of LnAG and ball-stick model of environmental coordination of Ln and Al atoms are shown in Fig. 3(a) and (b), respectively. The garnet structure can be viewed as a framework built up via corner sharing of the Al–O tetrahedral (24d sites) and Al–O octahedron (16a sites), with the Ln (24c sites) residing in dodecahedral interstices.18 The morphology and composition of YGAG: Dy3+,Bi3+ phosphor were investigated by SEM and EDS, as shown in Fig. 3(c) and (d), respectively. It can be seen that the shape of the particles look like quasi-sphere. Since the sample was limited and packaged by the network “cage” formed by citric acid cross-linked before the decomposition of gel, there was certain agglomeration between the particles.9 The EDS pattern provides the chemical position of the product, containing Y, Gd, Al, O, Dy and Bi. Combined with the XRD patterns, the samples are further proved to be YGAG.
![]() | ||
Fig. 3 Crystal structure of (a) Ln3Al5O12, (b) ball-stick model of environmental coordination of Ln and Al atoms, (c) the SEM image and (d) EDS pattern of YGAG: Dy3+,Bi3+ phosphor. |
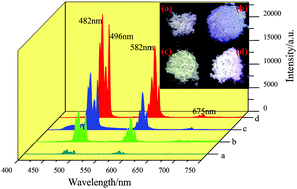
In particular, a comparison of emission spectra of Dy3+ single-doped YGAG and Dy3+, Bi3+ co-doped YAG, GAG and YGAG is exhibited in Fig. 5. To be clearly, the obtained emission intensity of Dy3+ in Dy3+–Bi3+ co-doped YGAG was strongest, the second was in YAG, and in the GAG, the intensity was weakest. Meanwhile, the intensity of Dy3+ was greatly enhanced with Bi3+ co-doping in YGAG. Specifically, the intensity in YGAG: Dy3+,Bi3+ is almost double the intensity in YAG: Dy3+,Bi3+, four times stronger than GAG: Dy3+,Bi3+ and 15 times stronger than YGAG: Dy3+. To the naked eye, it can clearly see from the illustration that the sample of “d” as the YGAG: Dy3+,Bi3+ phosphor shows the brightest light under the UV lamp. Similarly as YAG and GAG, the incorporation of Bi3+ well improved the emission intensity of Dy3+ through effective energy transfer from Bi3+ to Dy3+.9 The energy transfer diagram is shown in Fig. 6. When excited by the UV light, the energy could be absorbed by Bi3+ ions via Bi3+: 1S0 → 3P1 transition. Then the absorbed energy could be transferred to the 4F9/2 level of Dy3+. Finally, the characteristic emissions from 4F9/2 to 6HJ (J = 15/2, 13/2 and 11/2) occurred. For higher concentration of Bi3+ ions, Bin3+ aggregates might be formed which acted as trapping centers and dissipated the absorbed energy nonradioactive, instead of transferring it to the activator ions of Dy3+.22 Therefore, higher emission intensity of Dy3+ could be obtained by co-doping appropriate amount of Bi3+ in garnet substrate phosphors.
In addition, the UV-vis diffuse reflectance spectra of (Gd1−xYx)2.895Al5O12: 0.06Dy3+,0.045Bi3+(x = 0.3, 0.4, 0.5, 0.6, 0.7, 0.8, 0.9) were measured as shown in Fig. 7. In the diffuse reflectance spectra, a broad band around 280 nm attributed to the transition from 1S0 to 3P1 of Bi3+ was observed for all samples. But it's noteworthy that the lowest absorption band showed a visibly blue shift when the content of Y3+ increased to 60%. Meanwhile, the relative diffuse reflectivity presented a trend of increasing first and then decreasing with a maximum when x = 0.8. However, as seen from Fig. 4, the luminous intensity increased with the increasing of Y3+ content which means that the phosphor has the strongest excitation intensity whereas the absorption is lowest. It is consistent with the previously reported Ce3+ doped (Y1−xGdx)3Al5O12 phosphors. In that system, the absorption intensity increased whereas the luminous intensity decreased with the increased content of Gd3+. The intensity of PL reflects the comprehensive effects of energy absorption and energy transfer in the phosphor. At higher concentration of Gd3+, the phosphor has a strong ability to absorb incident photons, but only a fraction of them convert to visible light.17 That is, the increase of (Gd1−xYx)2.895Al5O12: 0.06Dy3+,0.045Bi3+(x = 0.3, 0.4, 0.5, 0.6, 0.7, 0.8, 0.9) luminescence upon Y3+ doping is not caused by the increased absorption.
In order to show the absorption of the sample more directly, the relationship between the wavelength and the reflectivity is converted into the relationship between the absorbance and the wavelength as shown in Fig. 8 In addition, to further clarify the relationship between the intensity and the content of Y3+, different contents of Y3+(x = 0.3, 0.5, 0.7, 0.8, 0.9) were taken to be investigated to estimate the optical band gap energy (Eg). Firstly, F(R) was obtained by the Kubelka–Munk equation:23
![]() | (1) |
Then the Tauc theory was used to calculate the optical band using the DR spectra. The relationship between the optical band gap with the absorbance and photon energy can be given by the following function:23
[F(R)hν]2 = C2(hν − Eg)n | (2) |
As shown in the inset of Fig. 8, the obtained Eg values were slightly varies with the increased content of Y3+ ions. The values of Eg increased to the maximum at x = 0.8. Previous report had discussed the effect of different Gd3+ content on YAG: Ce3+ phosphor.17 It was generally consistent with this work. That is, with more and more Gd3+ doped into YAG, the band gap narrows. Meanwhile, the phenomenon that the luminous intensity decreased with the increasing content of Gd3+ was also observed in that paper. The author attributed the reason to the energy loss caused by the auto-ionization of electrons from excited state orbit to conduction band and the thermal delocalization of electrons from crystal defects to conduction band. In other words, the absorption enhanced but the energy loss also increased at the same time. Therefore, there might be two reasons for the results of this work. On the one hand, with the increasing content of Y3+, the band gap becomes wider and the crystal field strength increases which led to the increase of energy barrier between excited states to conduction band. On the other hand, it would naturally give rise to a substantial number of vacant sites in oxygen ion when the position of Gd3+ was occupied by Y3+ with smaller radius, and then increase the depth of the crystal defects with the increasing concentration of Y3+.17,24 It may reduce the probability of the self ionization electron and thermal ionization of electrons.17 Finally, the luminous energy loss decreases and the luminous intensity increases gradually. When the content of Y3+ is 80.0%, the band gap is widest and the loss of energy is the least, which may lead to the maximum emission intensity.
Meanwhile, the decay curves of (Gd1−xYx)2.895Al5O12: 0.06Dy3+,0.045Bi3+(x = 0.3, 0.5, 0.7, 0.8, 0.9) phosphors under excitation at 280 nm and monitored at 482 nm were also investigated as shown in Fig. 9. The fitted lifetimes were also given in the figure and all the decay curves can be well fitted to a double-exponential function as follows:25,26
I(τ) = A + B1![]() ![]() | (3) |
![]() | (4) |
![]() | ||
Fig. 9 Decay times obtained for (Gd1−xYx)2.895Al5O12: 0.06Dy3+,0.045Bi3+(x = 0.3, 0.5, 0.7, 0.8, 0.9) detected at an excitation wavelength of 280 nm, while monitoring at 482 nm. |
Samples | A | τ 1 (μs) | B 1 | τ 2 (μs) | B 2 | τ avg (μs) |
---|---|---|---|---|---|---|
x = 0.3 | 0.237 | 188.3677 | 388.395 | 808.3646 | 546.120 | 720.2355 |
x = 0.5 | 0.256 | 228.8441 | 317.432 | 815.7814 | 528.726 | 731.1796 |
x = 0.7 | 0.284 | 233.0223 | 391.681 | 824.9655 | 592.538 | 731.8307 |
x = 0.8 | 0.032 | 338.0215 | 411.537 | 893.5707 | 578.101 | 775.7064 |
x = 0.9 | 0.232 | 628.7451 | 285.902 | 996.7856 | 477.570 | 895.9022 |
Additionally, the thermal stability of phosphor is important for the potential application in W-LEDs. To investigate the influence of temperature on the luminescence properties, Fig. 10(a) shows the PL spectra of (Gd0.2Y0.8)2.895Al5O12: 0.06Dy3+,0.045Bi3+ phosphor excited at 280 nm under different temperatures in the range of 30–200 °C. The inset shows the enlarged images of emission spectra from 470–500 nm. No obvious shifts were observed and the luminescence decreases slowly with the increasing temperature. The variations in the normalized emission intensity of (Gd0.2Y0.8)2.895Al5O12: 0.06Dy3+,0.045Bi3+ phosphor is exhibited in Fig. 10(b). The intensity at 150 °C is about 81% of the initial value at 30 °C, which means the phosphor has good thermal stability. To better understand the thermal quenching phenomena, the activation energy (ΔE) was obtained according to the modified Arrhenius equation:25–29
![]() | (5) |
Finally, the Commission Internationale de L'Eclairage (CIE) color coordinates (x, y) of Dy3+ singly doped YGAG, and Dy3+–Bi3+ co-doped LnAG (Ln = Y, YGd, Gd) samples are calculated and displayed in Fig. 11. The chromaticity coordinate shifted from blue edge area to green edge area when the Ln ions change from Y to Y/Gd to Gd. The value of color coordinates were listed in the insert table which was (0.2645, 0.2976), (0.2952, 0.3288), (0.308, 0.3401) and (0.3069, 0.372) for a, b, c and d, respectively.
![]() | ||
Fig. 11 The CIE diagram of (a) YAG: 0.06Dy3+,0.045Bi3+, (b) YGAG: 0.06Dy3+,0.045Bi3+, (c) YGAG: 0.06Dy3+ and (d) GAG: 0.06Dy3+,0.045Bi3+. |
This journal is © The Royal Society of Chemistry 2016 |