Properties of CB7CB-D4 as derived from 129Xe and 2H NMR experiments and computations
Received
2nd June 2025
, Accepted 13th November 2025
First published on 14th November 2025
Abstract
Twist-bend nematic liquid crystal phases are fundamentally interesting as chiral macroscopic structures arising from achiral molecules, as well as from the perspectives of photonics and switching applications. Conical angle and orientational order are the key properties of the twist-bend nematic phase. In the present case, we investigate the conical angle in 1″,7″-bis(4-cyanobiphenyl-4′-yl)heptane (CB7CB), which displays ordinary nematic (N) and twist-bend nematic (NTB) phases, utilizing 129Xe shielding and 2H quadrupole splitting in CB7CB-D4. When applying the 129Xe shielding, measured with respect to an external gaseous xenon sample, the bulk susceptibility effect must be considered. For this purpose, the diamagnetic susceptibility tensor was computed. The analysis of the 2H NMR data necessitates the knowledge of the 2H quadrupole coupling tensor element along the C–D bond. Computations and data analyses show that the commonly used value of 168 kHz is slightly underestimated. Another property investigated is the temperature dependence of the 129Xe linewidth (ν1/2). It reveals two things: (i) when approaching the phase transitions from the high-temperature side, ν1/2 increases abruptly, but decays, after the transition, exponentially toward the values in the isotropic phase, and (ii) upon cooling under ca. 355 K in the NTB phase, ν1/2 increases exponentially. Subtraction of the linewidth distributions at the phase transitions reveals that ν1/2 remains independent of temperature in the isotropic and nematic phases, and partially also in the twist-bend nematic phase. The assumption that the 129Xe linewidth reveals the T2 relaxation rate, 1/T2, leads to the conclusion that the rate is independent of temperature in the isotropic and nematic phases and partially also in the twist-bend nematic phase.
Introduction
The discovery and experimental verification of the twist-bend nematic (NTB) phase are some of the most important developments in the field of liquid crystals. It reveals the fundamental physics of liquid crystals, provides insight into molecular self-organization, and opens technological opportunities in fast electro-optic and photonic applications. As described by Dunmur,1 this led about 15 years ago to great interest among liquid crystal scientists. The most studied compound, displaying the conventional nematic (N) phase and the twist-bend nematic phase, is 1″,7″-bis(4-cyanobiphenyl-4′-yl)heptane (CB7CB). Although the properties of the twist-bend nematic phase in CB7CB have been extensively investigated, there remains uncertainty about the temperature dependence of the conical angle between the helical axis and the liquid crystal director.
129Xe NMR of dissolved xenon gas has appeared as a powerful method for the determination of various properties of liquid crystals. Xenon has two NMR active isotopes, 129Xe and 131Xe. The former possesses a spin of 1/2 while the latter has a spin of 3/2, i.e., it is quadrupolar. Both isotopes have a relatively high natural abundance, which in this respect is quite favourable for NMR studies. However, detection of 131Xe NMR is demanding because of its short T2 relaxation time, resulting in a broad linewidth. Furthermore, the spectral intensity is distributed between three lines in the solid and liquid crystal phases. In the case where experiments are successful in these phases, 131Xe NMR spectra reveal a property not available via129Xe NMR, which is the electric field gradient (EFG) at the nuclear site created by the environment and deformation of the electron distribution of the atom.2 Comparison of 129Xe and 131Xe shielding in the same liquid crystalline environment reveals the biaxiality of the environment.3–5 This is based on the second-order quadrupole shift (SOQS) in the 131Xe spectra. 129Xe NMR of a liquid crystal solution can be used to extract a lot of versatile information such as temperature dependence of the orientational order parameter,6 phase transitions,7 temperature dependence of the solvent density (isobaric thermal expansion coefficient),8 the sign of the diamagnetic anisotropy,9 the occurrence of induced smectic phases,10 the anisotropy of the 129Xe shielding tensor due to the deformation of the electron cloud,8 and the temperature dependence of the conical (tilt) angle in chiral smectic and twist-bend nematic phases.6 The conical angle and the orientational order parameter are the key properties of the twist-bend nematic phase in CB7CB. Therefore, it is most important that these properties are known as accurately as possible. Earlier investigations have reported a large scatter of the conical angle values, applying different methods.11,12
In the present work, we first concentrate on the methods based on 129Xe NMR of xenon dissolved in CB7CB-D4 on the one hand, and on the utilization of the 2H quadrupolar splitting in the determination of the conical angle, on the other hand. Moreover, we discuss another property of 129Xe NMR which reveals valuable information about the liquid crystal used as the solvent. This property is the linewidth, full width at half height, for which ν1/2 will be used as a symbol, detected as a function of temperature.
Experimental
129Xe NMR experiments were performed in CB7CB-D4 (see Fig. 1). The solubility of xenon in CB7CB is not known but utilizing typical values one can estimate that the mole concentration of Xe in CB7CB is ca. 1 mol%. The transition temperatures for CB7CB doped with xenon are 387.1 ± 0.5 K and 374.4 ± 0.5 K for the N–I and NTB–N transitions, respectively; these are 2.2 and 2.3 K lower than those for the pure compound, where there is no xenon.
 |
| | Fig. 1 Structure of CB7CB-D4 (left) and 5CB (right). For CB7CB, the two dihedral angles ϕ1 and ϕ2, used in rotational averaging of the quantum-chemically calculated diamagnetic susceptibility tensor, are indicated. | |
Details of the synthesis and NMR measurements are described, for example, in ref. 6. The 129Xe shielding in CB7CB-D4 was referenced to the value of external gaseous 129Xe, which was considered independent of the temperature. However, when experiments are carried out in different environments, it is necessary to consider the difference in the diamagnetic susceptibilities of the environments. This will be discussed in the next section. The 2H NMR data were originally reported in ref. 12 and were used in ref. 6, as well.
Computations
In the present case, the 129Xe NMR shielding was measured relative to the respective signal of an external gaseous sample. In such a case, the effect of bulk susceptibility must be considered. This, however, requires the knowledge of the diamagnetic susceptibility tensor (DST) of CB7CB, and that of the xenon gas. Unfortunately, no information on the full DST could be found in the literature. The diamagnetic properties of CB7CB are often claimed to be similar to those of 5CB.14 The calculations carried out here do not quite agree with this.
Quantum-chemical calculations were carried out using density-functional theory (DFT) for DST and 2H quadrupole coupling constant of the CB7CB molecule. The first two properties were, for comparison, also calculated for the Xe atom and for the 5CB molecule. First, the geometries of the CB7CB and 5CB molecules were optimised in vacuo, in an all-trans configuration, using the PBE0 exchange–correlation functional15 and the def2-TZVP basis set16 on the Turbomole software.17 The semiempirical D4 dispersion correction18 was applied. The optimised geometries are provided in the SI. The 2H quadrupole coupling constants were obtained for the –CD2 groups next to the innermost phenyl rings, in the optimised geometry, using similar methodology to that applied for optimising the geometry. Additionally, a locally dense basis set with the def2-QZVPPD basis set19 was applied on these groups, while the rest of the system was treated with the def2-TZVP basis set.
The DST calculations were done on all the three systems at the optimised geometry at the PBE0/def2-TZVP level on the Gaussian 16 programme.20
The results of the molecular property calculations are given in Table 1. In fact, instead of DST, the related single-molecular property which is calculated is the molecular magnetizability ξ, from which an estimate of the susceptibility of a medium consisting of such molecules can be obtained as χ = μ0NAξ.22 The DST is typically well-reproduced by DFT with the present, triple-zeta level basis set, and the data should be representative of a molecule in vacuo, at the equilibrium geometry. It can be noted that, as an extensive molecular property, the isotropic susceptibility χiso = −3.83 × 10⁻⁹ m3 mol−1 is roughly doubled in value in CB7CB as compared to 5CB, which is in line with the molecular structures in question.
Table 1 Quantum-chemically calculated molar magnetic susceptibility and 2H nuclear quadrupole coupling constant. The PBE0/def2-TZVP level of theory was used, unless otherwise specified
| Property |
Symbol and unit |
System |
| Xe |
5CB |
CB7CB |
|
Anisotropies in the principal axis frame of the moment of inertia tensor I, ΔP = P33 − (P11 + P22)/2, where the tensor component P33 is aligned with the long axis of I.
Extrapolated value taking into account conformational averaging according to eqn (1).
An estimate of the molar susceptibility of the medium is obtained from the calculated single-molecular magnetizability, assuming simple scaling with the number density of the medium.
Experimental value from ref. 23.
Experimental value from ref. 21.
Average over the four CD2-group deuteron nuclei. Figures in parentheses with the locally dense basis set applied on the groups in question (see the text).
|
| Magnetizability |
ξ
iso (10−30 J T−2) |
−824 |
−2870 |
−5060 |
| Magnetizability anisotropya |
Δξ (10−30 J T−2) |
— |
674 |
13.3 |
| Magnetizabilityb |
ξ
iso (10−30 J T−2) |
— |
— |
−5110 |
| Magnetizability anisotropya,b |
Δξ (10−30 J T−2) |
— |
— |
520 |
| Molar susceptibilityc |
χ
iso (10−9 m3 mol−1) |
−0.62 |
−2.17 |
−3.83 |
| Molar susceptibility anisotropya,c |
Δχ (10−9 m3 mol−1) |
— |
0.57 (0.53d) |
0.01 |
| Molar susceptibilityb |
χ
iso (10−9 m3 mol−1) |
— |
— |
−3.86 |
| Molar susceptibility anisotropya,b |
Δχ (10−9 m3 mol−1) |
— |
— |
0.39 (0.86e) |
|
2H electric field gradientf |
2H Vzz (a.u.) |
— |
— |
−0.291 (−0.275) |
|
2H quadrupole coupling constante |
2H qCD (kHz) |
— |
— |
−195 (−185) |
The value of the susceptibility anisotropy Δχ = χcc − (χaa − χbb) depends on the molecular frame (a, b, c) that is chosen to represent the tensor. The 5CB molecule forms uniaxial liquid crystal phases and, in the case of a positive susceptibility anisotropy such as in the present case, the relevant reference direction c is aligned with the mechanical long axis of the molecule, i.e., the principal axis of the moment of inertia I tensor that corresponds to the minimum eigenvalue of I. In 5CB, this coincides well with the direction from the terminal N atom on one end of the molecule with the carbon atom of the terminal –CH3 group, at the other end. This direction is aligned with the principal axis corresponding to the middle eigenvalue of the χ tensor, χcc = −1.79 × 10⁻⁹ m3 mol−1, with the two other eigenvalues equal to χaa = −3.01 × 10⁻⁹ and χbb = −1.71 × 10⁻⁹ in the same units. Even though I is nearly cylindrically symmetric in 5CB, the molar susceptibility tensor is noted to have a substantial asymmetry. The reason is the very strong axiality of the local DST tensors of the two phenyl groups of 5CB, each with unique axes that are perpendicular to the plane of the phenyl groups, residing perpendicular also to the long axis of the entire 5CB molecule. The normal vectors of the two phenyl groups are at an angle of about 37 degrees in the optimised molecular geometry, hence their susceptibilities reinforce each other and produce the strong asymmetry of χ. However, the molecules are expected to undergo, in the NMR time scale, rapid rotation around the long axis of I, which renders the time average susceptibility cylindrically symmetric around that axis. The presently calculated anisotropy resulting for 5CB from this choice of coordinate frame, Δχ = 0.57 × 10⁻⁹ m3 mol−1, is in excellent agreement with the experimental value of 0.53 × 10⁻⁹ m3 mol−1 from ref. 23. This success serves as a sanity check of both (1) the underlying DFT methodology applied at the single-molecular level and (2) the assumption that the DST, a material property, additively consists of the single-molecular properties.
The situation is more complicated for the V-shaped CB7CB molecule. There is a clearly defined cylindrical axis of I also in this case, coinciding with the internuclear axis between the terminal nitrogen atoms in the optimised geometry. Calculating Δχ using the mechanical long axis of the molecule as the reference direction gives practically a zero result at the equilibrium geometry, which would imply vanishing orientational bias and contradicts the existence of the N phase with the director aligned with the external magnetic field. However, the value of Δχ is very sensitive to the molecular conformation. Referenced to the optimised structure, a metastable conformer at +0.93 kcal mol−1 can be reached by rotating one of the biphenyl moieties by 90 degrees around the bond joining the inner phenyl group with respect to the first –CH2 group. In this metastable conformer, using the mechanical long axis of the molecule as the reference direction, one obtains the result Δχ = 0.63 × 10⁻⁹ m3 mol−1.
It is apparent that, to obtain meaningful data for the analysis of experiments, one must perform conformational averaging in the case of CB7CB. To this end, we carried out a relaxed two-dimensional scan over the two dihedral angles, marked in Fig. 1, that join the two biphenyl moieties to the aliphatic chain at the centre of the molecule. This scan was carried out on the ORCA software,24 using DFT with the PBE exchange–correlation functional,25 the def2-SVP basis16 and the D4 dispersion correction. The dihedral angles were fixed to values in a two-dimensional grid ranging from 90 to 420 degrees in 30-degree intervals, and all the other degrees of freedom were optimised for minimum energy, at each of the grid points. At the global energy minimum obtained at the PBE/def2-SVP level of theory, the isotropic molar susceptibility and susceptibility anisotropy (the latter with reference to the mechanical long axis of the molecule) gained the values of −3.87 and 0.00, respectively, in units of 10−9 m3 mol−1. There is only a small change as compared to the PBE0/def2-TZVP equilibrium-geometry data, −3.83 and 0.01, respectively, in the same units. The Boltzmann-weighted average (at 300 K temperature) over the total of 144 points in the relaxed 2-dimensional scan resulted in the averages χiso = −3.90 and Δχ = 0.39 × 10⁻⁹ m3 mol−1. Hence, we arrive at our best estimates, in Table 1, by extrapolating both the isotropic susceptibility and its anisotropy as
| | | Pext = (PeqPBE0/TZVP − PeqPBE/SVP) + 〈PscanPBE/SVP〉300Kconf. | (1) |
Here,
Pext is the extrapolated quantity,
Px denotes the property calculation at level
x, eq refers to the optimised equilibrium geometry, scan refers to the points of the two-dimensional grid, and 〈 〉
Tconf refers to Boltzmann averaging over molecular conformations at temperature
T. This resulted in
χiso = −3.86 and Δ
χ = 0.39 × 10
−9 m
3 mol
−1. In general, the isotropic susceptibility is hardly affected by the conformation of the system, whereas the susceptibility anisotropy is quite sensitive to it. The scan data used in
eqn (1) are included in the SI. In particular, our result for Δ
χ in CB7CB is of the same positive sign and order of magnitude, but less than half of the magnitude of that obtained in ref.
21 from their Frederiks effect measurements, Δ
χ0 = 0.86 × 10
−9 m
3 mol
−1. The experimental anisotropy results indirectly from an optical experiment, and the isotropic
χ is not reported in ref.
21. While our calculations address directly both these quantities (under the approximation of additivity), it is not ruled out that a more detailed intra- and intermolecular dynamics modelling, than what is carried out presently, would be necessary for an entirely quantitative prediction of this parameter. We performed the susceptibility correction of the
129Xe NMR shift both using the presently calculated Δ
χ and that mentioned in ref.
21.
Deuterium quadrupole coupling is particularly sensitive to the basis set,26 and we see a significant reduction of 10 kHz in the value of q from the result at the triple-zeta level to the quadruple-zeta level. Additionally, the sensitivity to the CD bond length shows in the (ro)vibrational corrections to this quantity, which in earlier studies have been placed at −3% for the methyl halides (CD3X, X = F–I),26 corresponding in the present case to about −5.5 kHz of further change of q, and about −10 kHz for deuterated benzenes.27 The third factor influencing q would come from intermolecular effects and solvation, with the largest potential changes arising from hydrogen bonding with the solvent molecules. This is not a very likely mechanism for the CD2 groups in the present liquid crystal system. Hence, combining the calculated q with the locally dense basis set with an average of the internal motion corrections in the two above-mentioned example cases leads to 177 kHz as our current best estimate for the 2H quadrupole coupling constant of the CB7CB-D4 system.
For the derivation of the conical angle from the 2H quadrupolar splittings, the element of the quadrupolar coupling tensor, qCD, along the C–D bond (see Fig. 1) should be known. In many cases, qCD is assumed to be 168 kHz.6,12,13,28,29
Results
129Xe shielding and conical angle
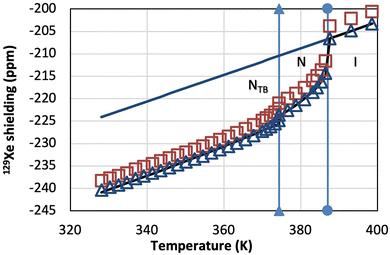
Fig. 2 shows the stack plot of the 129Xe NMR spectra in CB7CB-D4 at variable temperatures. The I–N and N–NTB phase transitions are clearly visible. Interestingly, at the N–NTB transition, a coexistence of the peaks arising from both the N and NTB phases is observed.
 |
| | Fig. 2 Stack plot of the 129Xe NMR spectra in CB7CB-D4. Phase transition points are indicated by red arrows. Temperature increases from top to bottom, and the range of 356.8–398.6 K is shown. On the left is shown the expanded coexistence of the peaks (at 374.4 K) originating from the N (right peak) and NTB (left peak) phases. At the I–N transition, the 129Xe shielding jumps by 8 ppm while at the N–NTB transition the jump is 1.2 ppm. | |
The figure shows the temperature dependence of 129Xe shielding (relative to that of xenon gas at room temperature and 2 atm pressure) for xenon dissolved in CB7CB-D4. The clear jumps of the shielding at the phase transitions facilitate two conclusions: (i) the large jump at the I–N transition toward a more negative value proves that the diamagnetic anisotropy is positive and, consequently, the director and, in the twist-bend nematic phase, the helical axis orient parallel to the external magnetic field and (ii) the smaller jump at the N–NTB transition originates from the onset of the tilt of the director relative to the external field.
The bulk susceptibility contribution to the 129Xe shielding, for a long cylindrical sample with its axis parallel with the external magnetic field, is obtained as30
| |  | (2) |
where
χ and Δ
χ are one-third of the trace of the DST and its anisotropy, respectively, the former being negative and the latter positive,
S is the orientational order parameter,
ρ is density and
M is molar mass (0.454 kg mol
−1 for CB7CB and 0.131 kg mol
−1 for xenon).
P2 is the second Legendre polynomial and
θ the conical angle. The calculated diamagnetic properties of CB7CB,
χ and Δ
χ, are listed in
Table 1 [we are using the values extrapolated as in
eqn (1)]. The orientational order parameter is modelled by the Haller function
31| |  | (3) |
where
TPT is either the I–N or N–N
TB phase transition temperature, and
y and
z are adjustable parameters. The temperature dependence of the density is described by
| | | ρ(T) = ρ0[1 − α(T − T0)], | (4) |
where
ρ0 is the density (1009.5 kg m
−3 for CB7CB, 5.46 kg m
−3 for xenon) at the reference temperature
T0 and
α is the isobaric thermal expansion coefficient. The data used in estimating the bulk susceptibility effect on
129Xe shielding in gas and in the CB7CB-D
4 solution are shown in
Table 2.
Table 2 Parameters used in the calculation of susceptibility corrections to the 129Xe shielding in the phases of CB7CB
| Isotropic phase |
(α + τ) = 0.0014 K−1 |
| Nematic phase |
(α + τ) = 0.0014 K−1, (α + Δτ) = −0.0018 K−1, y = 0.998, z = 0.245, T0 = 387.1 K |
| Twist-bend |
(α + τ) = 0.0160 K−1, (α + Δτ) = −0.0020 K−1, y = 0.998, z = 0.245, T0 = 374.4 K |
| Nematic phase |

|
The dependence of the 129Xe shielding in a uniaxial nematic phase on the temperature and orientational order can be modelled with the function32,33
| |  | (5) |
〈
σZZ(
T)〉 is the average of the
129Xe shielding tensor element along the external magnetic field (parallel to the
Z axis). The factors
σd and Δ
σd are the isotropic shielding and shielding anisotropy, respectively, at the reference temperature. The coefficients
τ and Δ
τ consider the possible direct effect of temperature on the shielding and shielding anisotropy, respectively.
P2 is the second Legendre polynomial, and
θ is the conical angle. Least-squares fit of function
(5) to the experimental shielding values (without susceptibility correction) reveals the parameters
y,
z, (
α +
τ), (
α + Δ
τ) and the conical angle, necessary for calculating the susceptibility corrections. The values are listed in
Table 2.
Application of eqn (2) to xenon gas (S = 0, Δχ = 0) results in σb = 0.0086 ppm. As mentioned in ref. 34, the temperature effect is negligible. The bulk shielding correction (including that of xenon gas) for the 129Xe shielding in CB7CB-D4 is shown in Fig. 3. The temperature dependence of the 129Xe shielding without and with bulk correction in CB7CB is shown in Fig. 4, together with the least-squares fit of function (5) to the 129Xe shielding corrected for the bulk susceptibility.
 |
| | Fig. 3 Bulk susceptibility correction to the 129Xe shielding in the phases of CB7CB-D4 liquid crystal. The vertical lines indicate phase transitions. | |
 |
| | Fig. 4
129Xe shielding as a function of temperature in CB7CB-D4 without (red squares) and with (blue triangles) bulk susceptibility correction. The solid lines show extrapolation from the isotropic phase to the liquid crystal phases (upper line) and the least-squares fit of function (5) to the susceptibility corrected 129Xe shielding (lower line). The vertical lines indicate phase transitions. | |
The fit to the susceptibility-corrected 129Xe shielding also reveals the change in the temperature dependence of the conical angle. Fig. 5 shows the conical angle derived from the uncorrected and corrected 129Xe shielding, together with the conical angle determined from two earlier birefringence measurements.
 |
| | Fig. 5 Conical angle in CB7CB-D4 as a function of temperature before (red squares) and after (blue triangles) bulk susceptibility correction to 129Xe shielding, and the conical angle derived from the 2H quadrupole splittings (cyan triangles). For comparison, also two results derived from birefringence measurements are shown (ref. 35 and 36). | |
The temperature dependence of the conical angle after bulk susceptibility correction to 129Xe shielding obeys the equation
| |  | (6) |
where the phase transition temperature
TN–NTB = 374.4 K. The susceptibility correction was calculated also using the isotropic
χ value computed in this work and Δ
χ determined in ref.
21. Consequently, as compared to using the presently calculated values for both of these parameters, the susceptibility correction increases on average by about 0.1 ppm in the N
TB phase, and the coefficient and exponent in
eqn (6) change slightly. However, the two curves would not be distinguishable in
Fig. 5. Interestingly, the conical angles derived from two birefringence measurements differ significantly.
35,36 Ref.
35 explains that the difference is due to the choice of the region from where the birefringence measurements were taken. The present data derived from the susceptibility-corrected
129Xe shielding agree with the conical angle reported in ref.
35.
2H quadrupole coupling and conical angle
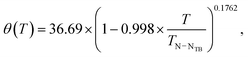
The 2H NMR spectrum of CB7CB-D4 displays a single doublet in the conventional nematic phase. In the chiral twist-bend nematic phase, the 2H NMR spectrum shows two doublets due to the prochiral deuterons. In the nematic phase, the quadrupole splitting and, in the twist-bend nematic phase, the mean of the two splittings can be presented as follows:6| | 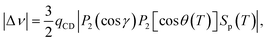 | (7) |
where qCD is the element of the 2H quadrupolar coupling tensor along the C–D bond, P2 is the second Legendre polynomial, γ is the angle between the C–D bond and the para-axis of the biphenyl fragment, θ(T) is the conical angle, and Sp(T), modelled by the Haller function as in the case of the 129Xe analysis, is the orientational order parameter of the para-axis of the biphenyl fragment relative to the director. It is generally assumed that the C–D bond forms the tetrahedral angle with the para-axis.6,12,13,26,27 The application of eqn (7) assumes that the orientational order of the biphenyl fragment can be described by a single parameter. Ref. 37, however, proves that the biaxiality order parameter is about 7.3% of the order parameter along the para-axis in the nematic phase and about 3.6% in the NTB phase. Furthermore, as mentioned above, it is generally assumed that qCD equals 168 kHz. Our computations and data analysis, however, show that it should be around 176–178 kHz, as discussed above.
We apply eqn (7) in the NTB phase with keeping γ fixed to 109.6° as derived from the optimised geometry and allowing qCD to change in the least-squares fit. The fit resulted in qCD = 177.5 kHz. No other combination of qCD and γ values resulted in a better agreement between the experimental and calculated results. Interestingly, qCD of 177.5 kHz is within the estimated values from the computations. When analysing the quadrupole splittings in the nematic phase, qCD was fixed to the value of 177.5 kHz, while P2(cos![[thin space (1/6-em)]](https://www.rsc.org/images/entities/char_2009.gif) γ) was used as a free parameter. It came out that the best fit is achieved with P2(cosγ) = 0.307583, which means that γ = 110.98°, i.e., 1.4° larger than in the NTB phase. Interestingly, ref. 12 reports that the principal ordering axis of biphenyl has tilted about 13° relative to the para-axis in the nematic phase. This is almost tenfold of the value observed here. It is, of course, possible that the tilt of 1.4° arises partly because the single order-parameter approximation for the biphenyl fragment works better in the NTB phase than in the N phase. As discussed above, the relative contribution of the biaxial order parameter is twofold in the N phase as compared to that in the NTB phase. The temperature dependence of the conical angle derived from the mean of the 2H quadrupole splittings is displayed in Fig. 5 together with 129Xe NMR and birefringence results. The conical angle as determined from the 2H quadrupole splittings can be described using the following equation:
γ) was used as a free parameter. It came out that the best fit is achieved with P2(cosγ) = 0.307583, which means that γ = 110.98°, i.e., 1.4° larger than in the NTB phase. Interestingly, ref. 12 reports that the principal ordering axis of biphenyl has tilted about 13° relative to the para-axis in the nematic phase. This is almost tenfold of the value observed here. It is, of course, possible that the tilt of 1.4° arises partly because the single order-parameter approximation for the biphenyl fragment works better in the NTB phase than in the N phase. As discussed above, the relative contribution of the biaxial order parameter is twofold in the N phase as compared to that in the NTB phase. The temperature dependence of the conical angle derived from the mean of the 2H quadrupole splittings is displayed in Fig. 5 together with 129Xe NMR and birefringence results. The conical angle as determined from the 2H quadrupole splittings can be described using the following equation:
| |  | (8) |
where
TN–NTB is the N–N
TB phase transition temperature, 374.4 K, in the present case.
129Xe linewidth and activation energy
Fig. 6 shows the width of 129Xe resonance peak as a function of temperature in CB7CB-D4. The linewidth increases abruptly when approaching the phase transitions from the high-temperature side. Interestingly, the 2H NMR spectrum of CB7CB-D4 does not display a 2H linewidth behaviour like that of xenon at the phase transitions.38 Furthermore, for 129Xe, the steep increase of the linewidth starts at a much higher temperature than in the case of 2H. Upon lowering the temperature, a further increase of the 129Xe linewidth takes place in the NTB phase at about 359 K. Below this temperature, ν1/2(Xe) increases exponentially. A least-squares fit of the natural logarithm of the Arrhenius function (assuming that the activation energy EA is independent of temperature)| | 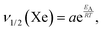 | (9) |
i.e., of the function| | 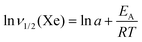 | (10) |
to the experimental data, results in lna = −12.08 ± 0.67, and EA = 45.08 ± 1.9 kJ mol−1. Using eqn (9),| | 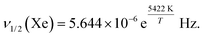 | (11) |
 |
| | Fig. 6 Experimental and calculated linewidth ν1/2(129Xe) in the NTB phase. The solid blue line is the least-squares fit of the experimental point to the Arrhenius law, in the NTB phase. Phase transitions are indicated by vertical lines. Note: ν1/2(129Xe) = 2.80 Hz in the gas phase. The red squares and blue circles denote experimental and calculated points, respectively. | |
Linewidth at the phase transitions
As shown in Fig. 6, ν1/2(129Xe) increases steeply at both phase transitions, when approaching from the high-temperature side. After the transitions, ν1/2(129Xe) narrows exponentially back towards the same value as in the bulk isotropic phase, ca. 21 Hz. The N phase must be cooled by ca. 30 K and the NTB phase by ca. 20 K from their respective phase transition temperatures, before the 129Xe linewidth again approaches the isotropic value, or the value just before the phase transition. Fig. 7 (top) shows least-squares fits of function (12) to the experimental data leading to the mentioned values:| | | ν1/2(129Xe) = a + bexp[c/(T − TPT)], | (12) |
where TPT is either the I–N or N–NTB phase transition temperature. Fig. 7 (bottom) displays the linewidth after removing the distributions at the phase transitions.
 |
| | Fig. 7 (top) Least-squares fit of function (12) to experimental 129Xe linewidths at the low-temperature sides of the phase transitions. It is seen that the minimum linewidth is ca. 21 Hz. (bottom) 129Xe linewidth, ν1/2, when the distributions in the vicinity of the phase transitions are subtracted. The vertical lines indicate phase transition temperatures. Average linewidth equals 21.46 Hz between 359 and 398 K. | |
The values of the adjustable parameters in eqn (12) are given in Table 3.
Table 3 Values of the parameters a, b and c in eqn (12)a
| Phase transition |
T
PT (K) |
a (Hz) |
b (Hz) |
c (K) |
|
Note: temperature was decreased slowly from the isotropic phase.
|
| I⋯N |
387.1 |
78.5 |
−61.6 |
1.529 |
| N⋯NTB |
374.4 |
163.3 |
−143.0 |
0.178 |
The 129Xe linewidth as a function temperature in CB7CB can now be presented in the form
| |  | (13) |
Spin–spin relaxation rate of 129Xe
Neglecting possible effects from the inhomogeneity of the external magnetic field, the relaxation rate 1/T2 of 129Xe is obtained from the linewidth:| |  | (14) |
It appears that 1/T2 (129Xe) is linearly dependent upon the ratio of the rotational viscosity of CB7CB39 and temperature, η/T, within the temperature range [328 K, 359 K]:| |  | (15) |
where c = 43174.08 K Pa−1 s−2 and d = 7.10168 s−1. The dependence is shown in Fig. 8, while Fig. 9 displays 1/T2 (129Xe) as a function of temperature within the above-mentioned temperature range.
 |
| | Fig. 8 1/T2 (129Xe) as a function of η/T, where η is the rotational viscosity of CB7CB and T is temperature. | |
 |
| | Fig. 9 1/T2 (129Xe) as a function of temperature. The solid line is from eqn (15). | |
According to the Stokes–Einstein–Debye model,40 the rotational correlation time is linearly related to η/T:
| |  | (16) |
where
η is the rotational viscosity of CB7CB
39 and
kB is Boltzmann constant. For the calculation of
τc, the molecular volume should be known. Use of the radius of gyration around the long axis of the molecule, 2.38 Å, of CB7CB results in
V = 5.649 × 10
−29 m
3, which is comparable to the polarizability volume of 428.78 Bohr
3 = 6.354 × 10
−29 m
3, calculated at the presently applied level of theory. The temperature dependence of
τc is illustrated in
Fig. 10. Obviously, 1/
T2 is directly proportional to
τc.
 |
| | Fig. 10 Rotational correlation time of CB7CB as a function of temperature in the temperature range [328 K, 359 K]. | |
When dealing with the relaxation of 129Xe one must consider two mechanisms: (1) dipolar interaction of 129Xe with the protons in CB7CB-D441 and (2) 129Xe shielding anisotropy.42 We consider first the latter case.
The spin–spin relaxation rate due to shielding anisotropy is described by42
| |  | (17) |
where
γXe is the gyromagnetic ratio of xenon-129,
B0 is the magnetic flux density (14.07 T in the present case), and Δ
σXe is the shielding anisotropy. This anisotropy value is the result of the least-squares fit of the
129Xe shielding to the function in
eqn (5). It appears that the anisotropy is the same in the N and N
TB phases,
i.e., −47 ppm. The shielding anisotropy of
129Xe arises from the deformation of its electron distribution due to the anisotropic environment. In other words, xenon experiences different interactions with the CB7CB molecules along different directions. Consequently, a plausible conclusion is that the correlation time in
eqn (17) is the same as (or at least strongly related to) that for 1/
T2 (
129Xe), shown in
Fig. 10. It appears that 1/
T2 (CSA) is directly proportional to
τc at low temperatures and is negligibly small compared to the total 1/
T2.
Obviously, the dominant relaxation mechanism is 129Xe–1H dipole–dipole interaction. As discussed, for example, in ref. 41, analytical treatment of the problem leads to complex time-correlation and spectral density functions. However, when dealing with the effect of diffusion, the translational diffusion correlation time can be presented in a simple form
| |  | (18) |
where
DCBXe =
DCB7CB +
DXe is the mutual self-diffusion constant of the interacting species and
d is the distance of closest approach between the spins. Here,
DCB7CB is the diffusion constant of CB7CB and
DXe that of xenon. Both diffusion tensors are anisotropic. For example, the anisotropy of the CB7CB diffusion tensor,
D‖/
D⊥, is in the range of 1.5 to 3.2
43 while that of xenon-129 is typically below 1.
44,45 The self-diffusion coefficient of CB7CB-D
4 in the direction of the director/helix axis appears to be
ca. 2 orders of magnitude smaller
43 than the typical values of
129Xe in conventional liquid crystals, being of the order of 10
−10–10
−9 m
2 s
−1.
7,44 Consequently, the Xe self-diffusion coefficient can be argued to dominate in
eqn (18). If one assumes that
d ≈ 3.5 Å,
46τc appears to be of the order of 10
−11 s in the isotropic and nematic phases but
ca. 10
−10 s in the N
TB phase. However,
d is obviously dependent upon temperature. Thus, when
d increases (upon lowering the temperature),
τc also increases.
The relaxation rate can be expressed as follows:47
| | 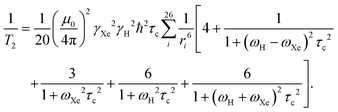 | (19) |
Here
ri is the distance between the xenon atom and the proton
i, and
ωH and
ωXe are the Larmor frequencies of
1H and
129Xe nuclei, respectively.
Eqn (19), however, is only qualitatively correct as it assumes a constant internuclear distance. Furthermore,
eqn (19) does not include the fact that one xenon-129 is surrounded by many CB7CB molecules, each carrying 26 protons. As discussed above, in the low-temperature part of the CB7CB data,
i.e., within the temperature range [328 K, 359 K], 1/
T2 is directly proportional to the rotational correlation time of CB7CB. This means that the terms (
ωH −
ωXe)
2τc2,
ωXe2τc2,
ωH2τc2 and (
ωH +
ωXe)
2τc2 in the denominators of the terms in
eqn (19) are much larger than unity and the rotational diffusion of CB7CB dominates in the low-temperature part of the N
TB phase. In the high-temperature part of the N
TB phase and in the N phase, the situation is the opposite to the previous case, meaning that (
ωH −
ωXe)
2τc2,
ωXe2τc2,
ωH2τc2 and (
ωH +
ωXe)
2τc2 are much smaller than unity. Still, 1/
T2 remains directly proportional to the correlation time, but now to the diffusion correlation time.
Conclusions
We have applied 129Xe NMR, quantum-chemical computations and earlier 2H NMR data to address the structural and dynamic properties of the twist-bend nematic liquid crystal phase formed by the CB7CB molecules. The conical angle of the twist-bend nematic phase defines the nanoscale geometry and optical properties of the phase. It influences, for example, birefringence and electro-optical responses. Consequently, it is a very important property. Here, it was derived from the 129Xe and 2H NMR experiments. In the former case, temperature dependence of the chemical shift was utilized, while in the latter case quadrupole coupling was used. When using xenon-129 as an external chemical shift reference, it is necessary to apply the bulk susceptibility correction. The correction was calculated using the isotropic diamagnetic susceptibility calculated in this work as no experimental value could be found from the literature. For the diamagnetic anisotropy, two values were used: one from the present computations and one from experiments, the latter being ca. twofold. It is shown that in both cases the correction leads to an increase in the temperature dependence of the conical angle in the CB7CB-D4 liquid crystal. The conical angle was also determined from the mean of the temperature-dependent 2H quadrupolar splittings in the twist-bend nematic phase. In this case, it is necessary to assume that the orientational order of the biphenyl fragments can be described by a single order parameter. The temperature dependence of the conical angle derived from the susceptibility-corrected 129Xe shielding values agrees well with the one from the birefringence measurements in ref. 35.
When moving to low temperature, the 129Xe linewidth increases rapidly at the low temperature part of the twist-bend nematic phase, the activation energy being 45.08 kJ mol−1. The linewidth increases abruptly when approaching I–N and N–NTB phase transitions from the high-temperature side and decays exponentially towards a value of ca. 21.5 Hz after the transitions. The transitions to this value need temperature decreases by ca. 30 K in the N phase and by ca. 20 K in the NTB phase. When the contributions to the linewidth at phase transitions are removed, the linewidth (and spin–spin relaxation rate) appears practically insensitive to temperature variation in the isotropic and nematic phases and in the high temperature part of the NTB phase. It is concluded that the self-diffusion of xenon-129 makes the principal contribution to the 1/T2 relaxation rate in the isotropic and nematic phases, while in the low-temperature NTB phase the rotation of the CB7CB molecules becomes more crucial.
Author contributions
J. J.: conceptualization, general investigation, analysis of experimental data, and writing of the original draft. J. V.: quantum-chemical calculations and their analysis. Both authors contributed together to the reviewing/editing of the manuscript.
Conflicts of interest
There are no conflicts to declare.
Data availability
The data supporting this article have been included as part of the supplementary information (SI). Supplementary information: optimised structures of 5CB and CB7CB at different levels of theory, the computed magnetizability tensor data used in conformational averaging, and experimental 129Xe chemical shifts and 2H quadrupole splittings, which the analyses are based on, belong to earlier published data. See DOI: https://doi.org/10.1039/d5cp02069g.
Acknowledgements
The authors would like to thank P. Hilla (Oulu) for useful discussions. Financial support from the Academy of Finland (project 361326) and the Kvantum Institute of the University of Oulu is gratefully acknowledged. Computational resources were supplied by the CSC-IT Center for Science (Espoo, Finland).
References
- D. Dunmur, Crystals, 2022, 12, 309 CrossRef CAS.
- S. Ahola, P. Ingman, R. Laatikainen, J. Sinkkonen and J. Jokisaari, J. Chem. Phys., 2018, 149, 234901 CrossRef PubMed.
- J. Jokisaari, A. M. Kantola, J. Lounila and L. P. Ingman, Phys. Rev. Lett., 2011, 106, 017801 CrossRef PubMed.
- J. Jokisaari and J. Zhu, Magn. Reson. Chem., 2014, 52, 556 CrossRef CAS PubMed.
- J. Jokisaari, Liq. Cryst., 2020, 47, 15955 CrossRef.
- J. Jokisaari, G. R. Luckhurst, B. Timimi, J. Zhu and H. Zimmermann, Liq. Cryst., 2015, 42, 708 CAS.
- J. Ruohonen, M. Ylihautala and J. Jokisaari, Mol. Phys., 2001, 99, 711 CrossRef CAS.
- J. Lounila, O. Muenster, J. Jokisaari and P. Diehl, J. Chem. Phys., 1992, 97, 8977 CrossRef CAS.
- J. Jokisaari and P. Diehl, Liq. Cryst., 1990, 7, 739 CrossRef CAS.
- J. Jokisaari, P. Diehl and O. Muenster, Mol. Cryst. Liq. Cryst., 1990, 188, 189 CrossRef CAS.
- L. Longa and W. Tomczyk, J. Phys. Chem. C, 2020, 124, 22761 CrossRef CAS PubMed.
- C. Greco, A. Ferrarini, G. R. Luckhurst, B. A. Timimi and H. Zimmermann, Liq. Cryst., 2018, 45, 2361 CrossRef CAS.
- M. Cestari, S. Diez-Berart, D. A. Dunmur, A. Ferrarini, M. R. de la Fuente, D. J. B. Jackson, D. O. Lopez, G. R. Luckhurst, M. A. Perez-Jubinho, R. M. Richardson, J. Salud, B. A. Timimi and H. Zimmermann, Phys. Rev. E:Stat., Nonlinear, Soft Matter Phys., 2011, 84, 031704 CrossRef CAS PubMed.
- P. K. Challa, V. Borshch, O. Parri, C. T. Imrie, S. N. Sprunt, J. T. Gleeson, O. D. Lavrentovich and A. Jakli, Phys. Rev. E:Stat., Nonlinear, Soft Matter Phys., 2014, 89, 060501 CrossRef CAS PubMed.
- C. Adamo and V. Barone, J. Chem. Phys., 1999, 110, 6158 CrossRef CAS.
- F. Weigend and R. Ahlrichs, Phys. Chem. Chem. Phys., 2005, 7, 3297 RSC.
- TURBOMOLE V7.8.1 2024, a development of University of Karlsruhe and Forschungszentrum Karlsruhe GmbH, 1989–2024, TURBOMOLE GmbH, since 2007; available from https://www.turbomole.org.
- E. Caldeweyher, C. Bannwarth and S. Grimme, J. Chem. Phys., 2017, 147, 034112 CrossRef PubMed.
- D. Rappoport and F. Furche, J. Chem. Phys., 2010, 133, 134105 CrossRef.
-
M. J. Frisch, G. W. Trucks, H. B. Schlegel, G. E. Scuseria, M. A. Robb, J. R. Cheeseman, G. Scalmani, V. Barone, G. A. Petersson, H. Nakatsuji, X. Li, M. Caricato, A. V. Marenich, J. Bloino, B. G. Janesko, R. Gomperts, B. Mennucci, H. P. Hratchian, J. V. Ortiz, A. F. Izmaylov, J. L. Sonnenberg, D. Williams-Young, F. Ding, F. Lipparini, F. Egidi, J. Goings, B. Peng, A. Petrone, T. Henderson, D. Ranasinghe, V. G. Zakrzewski, J. Gao, N. Rega, G. Zheng, W. Liang, M. Hada, M. Ehara, K. Toyota, R. Fukuda, J. Hasegawa, M. Ishida, T. Nakajima, Y. Honda, O. Kitao, H. Nakai, T. Vreven, K. Throssell, J. A. Montgomery, Jr., J. E. Peralta, F. Ogliaro, M. J. Bearpark, J. J. Heyd, E. N. Brothers, K. N. Kudin, V. N. Staroverov, T. A. Keith, R. Kobayashi, J. Normand, K. Raghavachari, A. P. Rendell, J. C. Burant, S. S. Iyengar, J. Tomasi, M. Cossi, J. M. Millam, M. Klene, C. Adamo, R. Cammi, J. W. Ochterski, R. L. Martin, K. Morokuma, O. Farkas, J. B. Foresman and D. J. Fox, Gaussian 16, Revision C.02, Gaussian, Inc., Wallingford CT, 2016 Search PubMed.
- G. Babakhanova, Z. Parsouzi, S. Paladugu, H. Wang, Yu. A. Nastishin, S. V. Shiyanovskii, S. Sprunt and O. D. Lavrentovich, Phys. Rev. E, 2017, 96, 062704 CrossRef PubMed.
-
P. W. Atkins and R. S. Freedman, Molecular Quantum Mechanics, Oxford University Press, Oxford, 5th edn, 2011 Search PubMed.
- A. Buka and W. H. de Jeu, J. Phys., 1982, 43, 361 CrossRef CAS.
- F. Neese, Wiley Interdiscip. Rev.: Comput. Mol. Sci., 2018, 8, e1327 Search PubMed.
- P. Perdew, K. Burke and M. Ernzerhof, Phys. Rev. Lett., 1996, 77, 3865–3868 CrossRef PubMed; P. Perdew, K. Burke and M. Ernzerhof, Phys. Rev. Lett., 1997, 78, 1396 CrossRef.
- J. Vaara and Y. Hiltunen, J. Chem. Phys., 1997, 107, 1744 CrossRef CAS.
- A. M. Kantola, S. Ahola, J. Vaara, J. Saunavaara and J. Jokisaari, Phys. Chem. Chem. Phys., 2007, 9, 481 RSC.
- G. R. Luckhurst, B. A. Timimi, N. J. Wells and H. Zimmermann, Liq. Cryst., 2018, 45, 1913 CrossRef CAS.
- B. Robles-Hernández, N. Sebastian, M. R. de la Fuente, D. O. López, S. Diez-Berart, J. Salud, M. B. Ros, D. A. Dunmur, G. R. Luckhurst and B. A. Timimi, Phys. Rev. E:Stat., Nonlinear, Soft Matter Phys., 2015, 92, 062505 CrossRef.
- D. Buckingham and E. E. Burnell, J. Am. Chem. Soc., 1967, 89, 3341 CrossRef.
- I. Haller, Prog. Solid State Chem., 1975, 10, 103 CrossRef.
- J. Lounila, O. Münster, J. Jokisaari and P. Diehl, J. Chem. Phys., 1992, 97, 8977 CrossRef CAS.
- M. Ylihautala, J. Lounila and J. Jokisaari, Chem. Phys. Lett., 1999, 301, 153 CrossRef CAS.
- C. Jameson, A. K. Jameson and S. M. Cohen, J. Chem. Phys., 1975, 59, 4540 CrossRef.
- M. R. Tuchband, M. Shuai, K. A. Graber, D. Chen, C. Zhu, L. Radzihovsky, A. Klittnick, L. Foley, A. Scarbrough, J. H. Porada, M. Moran, J. Yelk, J. B. Hooper, X. Wei, D. Bedrov, C. Wang, E. Korblova, D. M. Walba, A. Hexemer, J. E. Maclennan, M. A. Glaser and N. A. Clark, Crystals, 2024, 14, 583 CrossRef CAS.
- C. Meyer, G. R. Luckhurst and I. Dozov, J. Mater. Chem. C, 2015, 3, 318 RSC.
- J. W. Emsley, M. Lelli, A. Lesage and G. R. Luckhurst, J. Phys. Chem. B, 2013, 117, 6547 CrossRef CAS PubMed.
-
G. R. Luckhurst and B. Timimi, private communication Search PubMed.
- K. Merkel, A. Kocot, C. Welch and G. H. Mehl, Phys. Chem. Chem. Phys., 2019, 21, 22839 RSC.
-
P. Debye, Polar Molecules, The Chemical Catalog Company, 1929 Search PubMed.
-
J. Kowalewski and L. Mäler, Nuclear spin Relaxation in Liquids. Theory, Experiments and Applications, CRC Press, 2nd edn, 2019, ch. 3 Search PubMed.
- J. S. Blicharski, Z. Naturforsch., 1972, 27a, 1456 CrossRef.
- M. Cifelli, V. Domenici, S. V. Dvinskikh, G. R. Luckhurst and B. A. Timimi, Liq. Cryst., 2016, 44, 1254292 Search PubMed.
- J. Ruohonen and J. Jokisaari, Phys. Chem. Chem. Phys., 2001, 3, 3208 RSC.
- H. W. Long, M. Luzar, H. C. Gaede, R. G. Larsen, J. Kritzenberger and A. Pines, J. Phys. Chem., 1995, 99, 11989 CrossRef CAS.
- J. Vaara, J. Jokisaari, T. T. Rantala and J. Lounila, Mol. Phys., 1994, 82, 13 CrossRef CAS.
- I. Solomon, Phys. Rev., 1955, 99, 559 CrossRef CAS.
|
| This journal is © the Owner Societies 2026 |
Click here to see how this site uses Cookies. View our privacy policy here. 
 Open Access Article
 This Open Access Article is licensed under a
  * and
Juha
Vaara
* and
Juha
Vaara


