
 Open Access Article
 This Open Access Article is licensed under a
 Creative Commons Attribution 3.0 Unported Licence
Leveraging microfluidic confinement to boost assay sensitivity and selectivity†
Shaoyu
Kang
 and
Jason J.
Davis
*
and
Jason J.
Davis
*
Department of Chemistry, University of Oxford, South Parks Road, Oxford, OX1 3QZ, UK. E-mail: jason.davis@chem.ox.ac.uk; Fax: +44(0) 1865272690; Tel: +44(0) 1865275914
First published on 11th March 2025
Abstract
The native and tunable microscale fluid manipulation accessible within 3D-printed configurations can be a transformative tool in biosensing, promoting mass transport and sample mixing to boost assay performance. In this study, we demonstrate that channel height restrictions can support a 2000% acceleration in target recruitment kinetics, a notable 600% improvement in target response magnitude, and a 300% enhancement in assay selectivity within an entirely reagentless format that requires neither catalytic amplification nor the employment of specialized nanomaterials. This highly accessible experimental configuration supports robust target detection from serum at simple, untreated, and un-passivated sensor surfaces. The underlying operational principles have been elucidated through a combination of theoretical analysis and COMSOL simulation; the enhanced analyte flux leveraged by channel confinement is directly responsible for these effects, which also scale with both bioreceptor surface density and target binding affinity. The operational simplicity of this assay format with its resolved channel and flux promoted assay performance, holds significant value not only for biosensing but also for broader microfluidic-integrated applications, such as biosynthesis and catalysis.
Introduction
Biomarkers are molecular indicators that reflect a wide range of physiological disease states.1,2 Accurate quantification of these holds a pivotal and growing role in clinical practice,3 enabling early disease detection, much more effective intervention, and continuous monitoring throughout treatment (thereby optimizing therapeutic strategies).4 Interfacial biosensors facilitate this by integrating surface-bound bioreceptors within transducing configurations that effectively convert biorecognition events into quantifiable signals.5,6 Those which are electrochemical are particularly favored for their rapid response times, simplicity of operation, cost-effectiveness, and compatibility with on-site device integration.7–9 Indeed, since the development of the electroanalytical blood glucose biosensor,10,11 these platforms have supported applications spanning clinical pathogen detection,9,12–15 wearable sensors,16–19 and environmental monitoring.20–24Marker detection is, by default, associated with its recruitment at a planar (electrode) surface. This, however, comes with limitations associated with the kinetics and scale of specific signal development relative to background (nonspecific fouling).25,26 The sluggish mass transport of targets to these interfaces exacerbates this issue,27 as it blurs the distinction between specific and nonspecific binding. A range of amplification strategies,28–30 typically involving either enhancement of the electrochemical surface area through the incorporation of nanomaterials (e.g., nanoparticles, graphene),31–35 or the employment of catalytic and chain reactions to magnify the signals, have accordingly become common, along with the utilization of “double recognition” sandwich assays as a means of improving specificity.36–40 While these approaches can be effective, the necessary integration of nanomaterials, catalysts, redox tags, enzyme-modified secondary antibodies etc., increases assay cost, complexity, and, significantly, can undermine reproducibility through the number of variables associated with the multi-step protocols and repeated washing steps therein.
Microfluidic configurations have increasingly been employed in biosensing applications,41–46 in part to reduce sample volumes, streamline workflow, and minimize experimental variability.47 In previous work, building on a well-established bio-receptive polyaniline (PANI) interface,48,49 we have introduced an on-chip integrated capacitive biosensor capable of assessing binding kinetics in real-time in a reagentless and label-free manner. By monitoring the temporal changes in the PANI capacitive fingerprint, Cr, we have further demonstrated that an analysis of the kinetics of target recruitment can itself support marker quantification in just 15 seconds, with a picomolar Limit of Detection (LoD). In these microfluidic configurations, sample delivery is predominantly governed by a strong convective component,50,51 as illustrated in eqn (1).
| Jchannel = Jdiff + Jconv = −D∇cA,b + cA,b·U | (1) |
| Jchannel = kLev·cA,b | (2) |
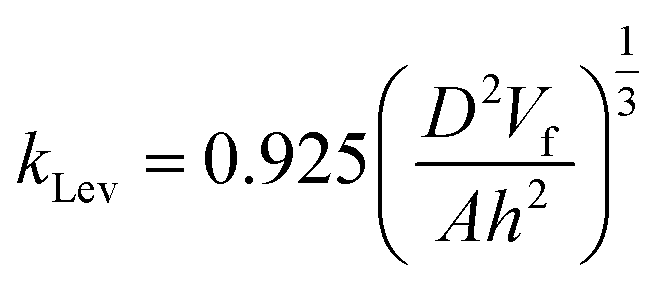
The mass transport coefficient kLev, is highly sensitive to fluid properties (e.g., viscosity, flow rate) and channel geometry, as described by the Levich equation (eqn (3)).50 Here, Vf represents the volume flow rate (cm3 s−1), A the reactive area, and h the half-height of the channel in cm.
 | (3) |
Since interfacial binding of a target is a series/sequential combination of transport and specific binding, and the latter is typically associated with a rate constant kon ≥ 105 M−1 s−1,53,54 the target accumulation rate is inherently flux-limited. The magnitude of mass transport coefficient kLev can, therefore, profoundly influence the overall kinetics of analyte accumulation on a reactive surface ∂cA–B,s/∂t,55,56 as expressed in eqn (4). Here, kon is the specific binding association rate constant, and cB,s represents the receptor surface coverage.
 | (4) |
 | ||
| Fig. 1 Schematic representation of utilizing microfluidic confinement to boost assay sensitivity and the selectivity of target recruitment. The working disc electrode is inserted into a custom 3D-printed microfluidic cell with confined channel height, accessible ranging from 1000 μm to 20 μm. Samples are delivered at a controlled flow rate by an automated syringe pump. A red-color gradient within the channels illustrates analyte flux toward the bio-receptive interface, with darker shades indicating higher flux. Within more confined volumes, increased convective flow enhances mass transport, leading to the rapid accumulation of analytes on the bio-receptive surface and a significantly increase in assay sensitivity. This process, governed by association rate constants, significantly improves selectivity of targeted recruitment by concentrating analytes at the detection interface while minimizing nonspecific background interference. | ||
Results and discussion
Theoretical analysis
Prior to examining the electrochemical data acquired within confined channels, we first established a theoretical framework to underpin the relationship between microfluidic flow dynamics and accumulation at a receptive surface. Within microfluidic channels, the analyte (A) is delivered to the receptor interface through a combination of diffusion and forced convection. Upon reaching the surface, it subsequently binds to the receptor (B) to form a complex A–B, a process describable as:Here, the notations “s” and “b” refer to species at the sensor surface and in the bulk solution, respectively.

The specific signal development SA is directly proportional to the surface concentration of the complex A–B, with a proportionality constant KA,
| SA = KA·cA–B,s | (5) |
Under convective conditions, the observed association rate constant kon,obs depends on the intrinsic association rate constant kon and the mass transport coefficient kLev, expressed as the reciprocal sum.55,56
| kon,obs = (kon−1 + kLev−1)−1 | (6) |
The observed equilibrium binding constant Ka,obs is derived as,
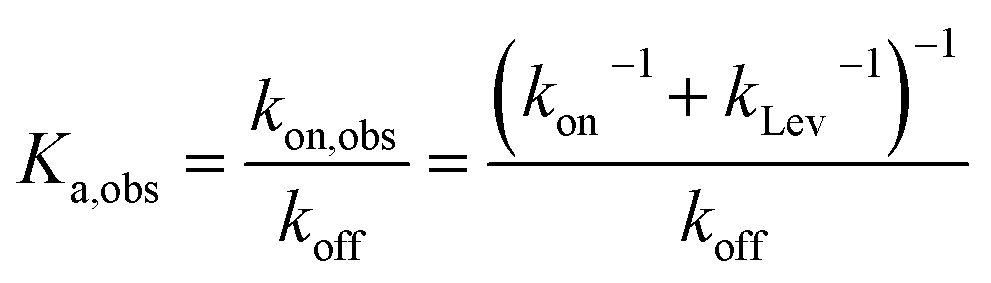 | (7) |
Reducing the channel height increases the mass transport coefficient kLev (eqn (3)), resulting in enhancements in kon,obs and, consequently, Ka,obs. Assuming Langmuir adsorption behavior,60eqn (5) can be expressed as follows, where θ is the fractional coverage of receptors by the analyte.
 | (8) |
By combining eqn (4) and (5), the rate of signal change over time ∂SA/∂t becomes,
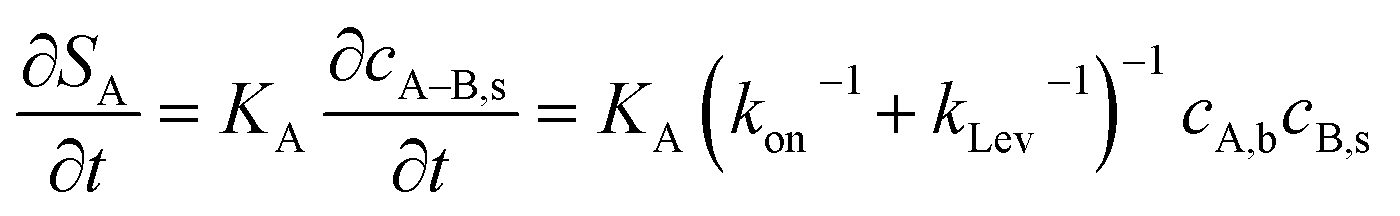 | (9) |
It is evident that both equilibrium SA and temporal ∂SA/∂t responses increase with the mass transport coefficient kLev, as indicated by positive derivatives,
 | (10) |
 | (11) |
These positive derivatives indicate that increasing kLev by compressing the delivery channel can boost both the magnitude of the signal response and the rate of signal generation.
Selectivity is the ability of a sensor to distinguish the target analyte (A) from background interferent (I),61 and can be defined here as the ratio of their rates of signal generation.
 | (12) |
As shown in eqn (12), selectivity depends not only on the selectivity coefficient KA,I; defined as the ratio of the proportionality constants for the signal development of the specific analyte A to the background I, reflecting the receptor's preference for the target) but also on the association rate constants, which can be modulated by flow dynamics. As discussed earlier, the overall binding kinetics of specific biorecognition events (kon ≥ 105 M−1 s−1) are typically dominated and limited by mass transport (kon,A ≫ kLev, kon,obs,A ≈ kLev). While the contribution of enhancements in binding-limited reaction (i.e., nonspecific binding) is negligible—that is, kon,I ≪ kLev, kon,obs,I ≈ kon,I. Thus, eqn (12) simplifies to,
 | (13) |
Eqn (13) reveals the origin of enhanced selectivity attainable under microfluidic confinement. By finely controlling flow (e.g., channel height), it is, specifically, possible to optimize the mass transport coefficient kLev, and thereafter amplify specific nonspecific surface association. While microfluidic enhancements certainly are expected to accelerate the recruitment of molecules in general by increasing flux, the effect is likely to be comparatively less pronounced for low molecular weight/higher diffusivity molecules, where transport constraints play a less dominant role.
COMSOL simulations
To further validate the theoretical framework, COMSOL simulations were employed to model the effects of microfluidic confinement. Four microfluidic channel heights (20, 100, 250, and 1000 μm) were simulated to assess the impact of microfluidic confinement on mass transport and biorecognition kinetics (Fig. 2 only shows the simulated results for 1000 μm (Fig. 2a) and 20 μm (Fig. 2b) microfluidic channels; see Fig. S1† for the complete set of simulation results and simulation details in the Experimental section, ESI†). As depicted in Fig. 2c, a crescent-shape analyte surface concentration profile was noted within the 20 μm channel, consistent with expectations.51 This observation arises because the diffusion layer, at the upstream edge of the electrode, is vanishingly thin, allowing analyte to rapidly access the receptive surface. However, as the flow progresses downstream, analyte depletion near the surface makes the diffusion boundary gradually thickens, resulting in a lower analyte accumulation.51 Additionally, the surface-bound analyte concentration within the 20 μm microfluidic channel, at equilibrium, is resolved to be 30 times higher than that in a 1000 μm channel (Fig. S2, ESI†). This enhancement is accompanied by a significantly faster rate of target accumulation, as shown in Fig. 3a.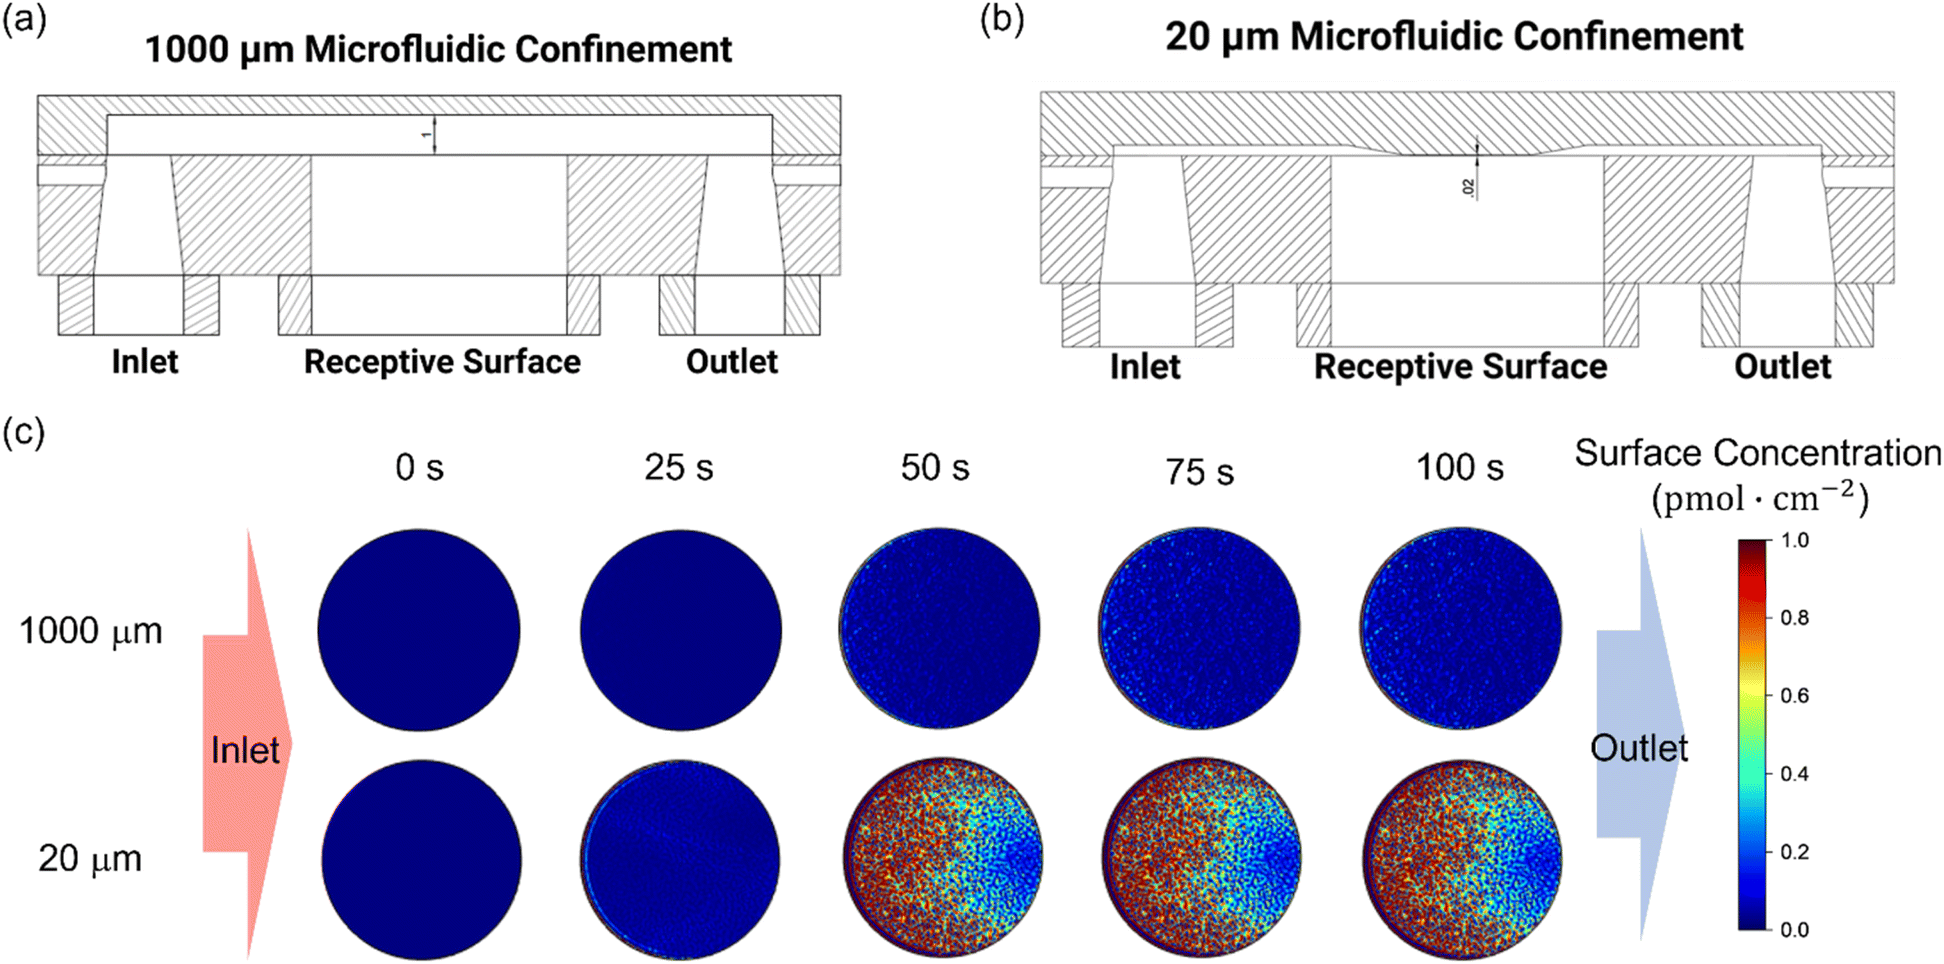 | ||
| Fig. 2 Schematic representation of the COMSOL simulation model for (a) 1000 μm and (b) 20 μm microfluidic channels, and (c) simulated surface-bound analyte concentration profiles on the bio-receptive disc electrode surface within 1000 μm and 20 μm microfluidic channels during a 100-second injection. The color gradient represents the analyte concentration, with red indicating high concentration and blue indicating low concentration. Simulation parameters are provided in the Experimental section, ESI.† | ||
 | ||
| Fig. 3 Simulation studies on the effects of (a) microfluidic channel height, and (b) association rate constant on the overall binding rate within 20 μm and 1000 μm microfluidic channels. The binding rate was determined from the first derivative of the analyte surface concentration, as resolved from the COMSOL simulation. Simulation parameters are listed in the Experimental section, ESI.† | ||
Simulations also confirmed that enhanced analyte flux is directly responsible; as shown in Fig. S3,† strong convection was noted within the 20 μm microfluidic channel, characterized by a “Levich-like” relationship (eqn (3)) when the flow rate exceeded 1 mm s−1 (corresponding to a Reynolds number Re = 0.1). Changes in flow dynamics, however, had limited effects in the 1000 μm channel, where diffusion is more limiting. This is because, in larger channels, the prolonged distance analytes must travel to reach the receptive surface results in the convective contribution diminishing near the surface, while axial and transverse diffusion dominate mass transport.51
Simulations also support the scaling of these flux enhancements with both binding affinity and bioreceptor coverage. As shown in Fig. 3b, the rate of target accumulation at the surface is much more dramatically affected by the effects of channel confinement as “association rate constant kon” grows from the nonspecific (kon < 105 M−1 s−1),62 to specific (kon ≥ 105 M−1 s−1)54 regimes and mass transport limitations become more dominant. The resulting preferential acceleration of specific over nonspecific binding is expected to improve assay selectivity. Target capture probability can also scale the enhancements (Fig. S4, ESI†). At low receptor coverage (≤10−5 pmol cm−2), capture probability is limiting with only minimal enhancement of target accumulation rate under increasing channel flux. As bioreceptor density increases, however, so the rate-limiting step transitions to mass transport and the beneficial effects of channel confinement and increased flux return (an effect scaling with receptor density until the receptive surface is antibody-saturated).
Since numerical results for microfluidic enhancements are highly dependent on key parameters (e.g., flow rate, analyte concentration and diffusivity, receptive surface area, and surface-bound receptor density), to generalise these findings a dimensionless analysis was employed to demonstrate these effects are general and not peculiar to specific parameters used herein.63 These analyses consider two key dimensionless numbers, the Peclet number Pe and the Damköhler number Da (see Experimental section for details, ESI†). Pe (or dimensionless flow rate) quantifies the relative contribution of convection to diffusion, as shown in eqn (14).
 | (14) |
 | (15) |
As shown in Fig. S6,† three regimes were also noted, namely those of MTL (mass-transfer limited), partial MTL, and binding regimes, aligning with the simulation results of Fig. 3b.
Accelerated binding kinetics and increased assay sensitivity
The above discussed effects of microfluidic channel flux in enhancing key sensor characteristics were pleasingly borne out experimentally. We commenced our study of microfluidic confinement with an investigation into enhanced analyte flux within two 3D-printed channels (20 μm and 1000 μm above gold disc electrodes; two channel heights used to initially resolve diffusive effects with a redox probe; see Fig. S7 ESI† for channel fabrication details). Under a continuous flow of 5 mM ferrocyanide and ferricyanide in PBS (pH = 7.4), voltammograms obtained within the 1000 μm channel, as expected, displayed a pair of reversible redox peaks centered at Ehalf = +0.17 V (vs. Ag/AgCl) at a scan rate of 100 mV s−1 across all accessible flow rates (0–300 μL min−1).64 In contrast, voltammograms acquired within the 20 μm confinement demonstrated a strong dependence on flow rate. Specifically, as the flow rate increased, enhanced convective contributions meant voltammogram forms transitioned from diffusion-controlled patterns to convection-dominated profiles.51 The associated steady-state currents (Fig. S8, ESI†) also exhibited a dependence on flow rate, consistent with the Levich equation (eqn (3), see Fig. S9, ESI†);51 at identical flow rates and voltammetric scan rates, the maximum current within the 20 μm channel was significantly higher than that observed in the 1000 μm channel (42.8 ± 0.59 μA vs. 15.0 ± 0.27 μA), highlighting the enhanced flux supportable in the former case (at the same flow rate).This enhanced analyte flux, of course, extends to the recruitment of macromolecular targets at the bio-receptive electrodes. Electropolymerized PANI electrodes were prepared via a 10-min chronopotentiometry deposition at a current density of 10 μA cm−2 (Fig. S10, ESI†).48 The resulting Fourier Transform Infrared (FT-IR) spectra, water contact angle measurements, and voltammetry scans were consistent with expectations (Fig. S11–S13, ESI†).49 The immobilization of anti-CRP on the PANI surface via glutaraldehyde cross-linking, validated using a standard SPR protocol (see Experimental section, ESI†), resulted in bio-receptive antibody coverage of approximately 189.0 ± 12.3 ng cm−2, equivalent to 60.0 ± 4.0% of a theoretical monolayer of IgG antibodies.65 This surface modification was associated with an increase in the water contact angle from 43.7° (PANI) to 56.3° (anti-CRP/PANI), and a decrease in redox capacitance Cr (see Fig. S14, ESI†), as reported by the inflection point shift in capacitive Nyquist plots.49
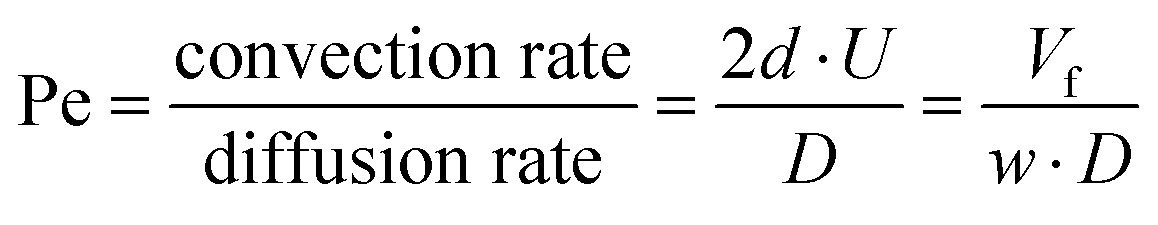
Target CRP recruitment was performed using custom 3D-printed microfluidic cells operating at a flow rate of 10 μL min−1, connected to an autosampler with a sample loop volume of 100 μL (Fig. S15, ESI†). The capacitive fingerprint Cr of anti-CRP modified PANI films was monitored in real time at a fixed potential and frequency, determined from SWV and the inflection point of the capacitive Nyquist plot, respectively (see Fig. S13 and S14, ESI†), and used to transduce recruitment.49 As shown in Fig. 4a, a reduction in microfluidic channel height 2h facilitates a notably increased CRP accumulation on the PANI surface; a 10-fold increase in the normalized Cr in plateau (relative to baseline, calculated using the equation RR% = (1/Cr,t − 1/Cr,0)/(1/Cr,0) × 100) within the 20 μm channel, compared with that observed in the 1000 μm channel (167% vs. 19.8%) in response to 10.0 μg mL−1 CRP injection (see Fig. S16† for full dose–response data). Additionally, the association binding kinetics (kon,obs evaluated directly from the maximum value of the 1st derivative of the Cr response over a 15-second sampling window)49 were significantly accelerated (by 2000%) in the confined channels (Fig. 4b and 5). Data analysis (see Experimental section for details, ESI†) identifies a significant increase in kLev in narrow channels (eqn (3)) as the origin of these observations, shifting the rate-limiting step in target surface recruitment from (sluggish two-dimensional) mass transport to binding kinetics (eqn (6)), amplifying kon,obs.
 | ||
| Fig. 4 (a) Representative capacitive sensograms of the anti-CRP modified PANI interface in response to 10.0 μg mL−1 CRP within varying microfluidic channel heights and under a flow rate of 10 μL min−1. (b) Capacitive dose–response curves derived from the 15 seconds of temporal data during the association regime. Cr was normalized relative to baseline before each injection. The control (orange) sampling represents that from PANI electrodes without anti-CRP modification, measured within a 1000 μm channel. Error bars represent the standard deviation across three individual electrodes (n = 3). | ||
 | ||
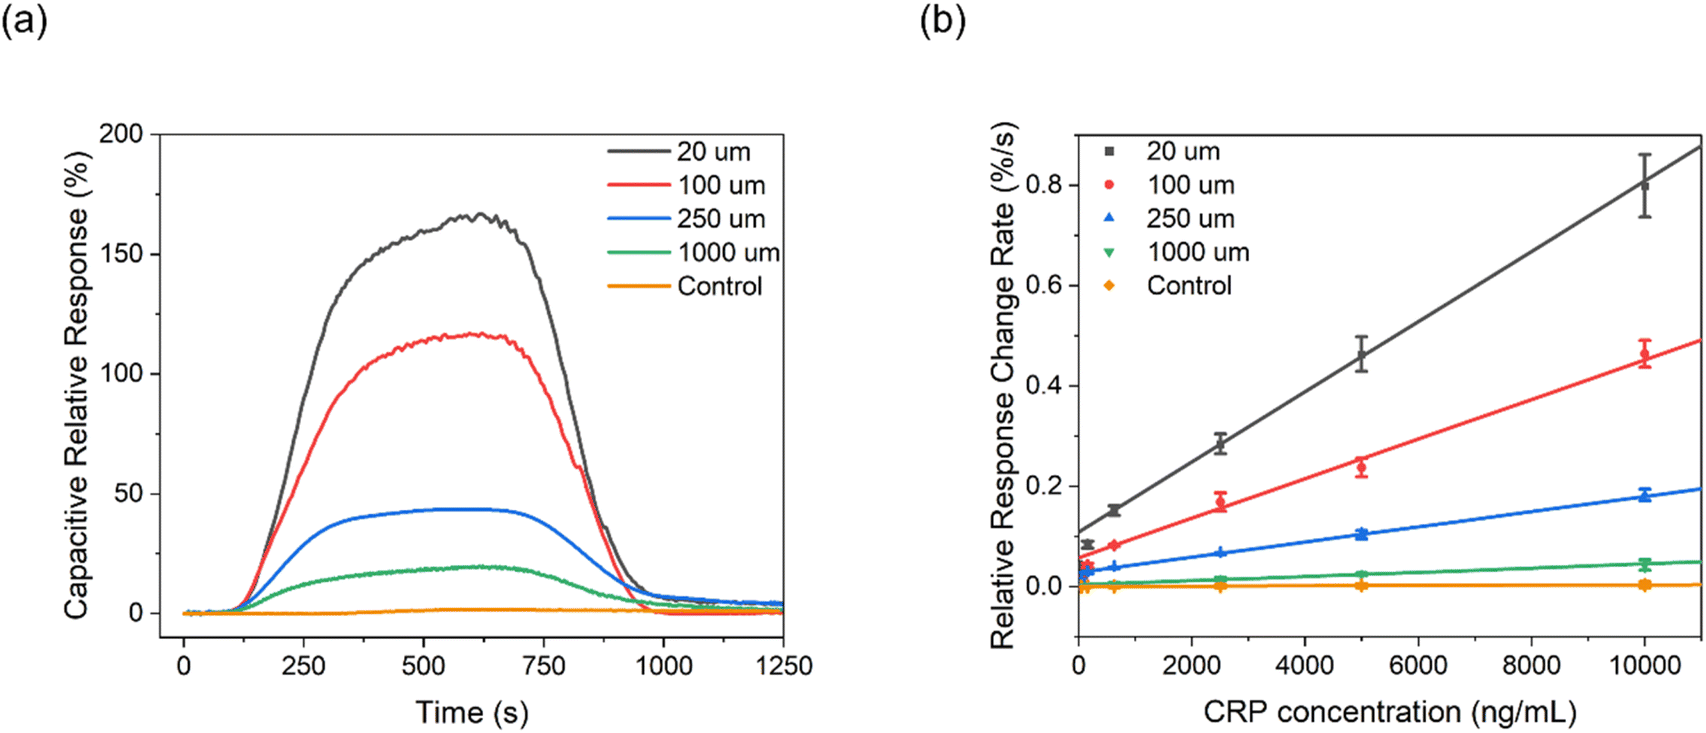
| Fig. 5 The effect of microfluidic channel height 2h on the association constant Ka (red) and the observed association rate constant kon,obs (blue). Ka was determined using the Langmuir–Freundlich isotherms model by fitting equilibrium data of the capacitive response (Cr in plateau) versus analyte concentration (Fig. S16†). kon,obs was derived from the first-order kinetic fitting of association Cr response, as detailed in Experimental section, ESI.† | ||
The increase in target binding kinetics necessarily leads to an increase in the thermodynamics of target association with receptive antibodies. As shown in Fig. 5, a 5-fold increase in the association constant Ka was noted upon reducing channel height from 1000 μm to 20 μm, as determined from the Langmuir–Freundlich fitting of the signal plateau (Fig. S16, ESI†). Given the relationship Ka = kon,obs/koff (where koff represents the dissociation rate constant), this increased binding affinity primarily results from a 20-fold increase in kon,obsversus a much-reduced increase in dissociation koff. As the rate constant koff is generally significantly smaller than kon and kLev,66 the dissociation process, unlike association, remains relatively unaffected by increases in mass transport (koff,obs = (koff−1 + kLev−1)−1 ≈ koff).
The increased target binding affinity predictably supports a marked increase in assay sensitivity (Fig. S17, ESI† and Fig. 4b demonstrate a 600% in the dose–response). This enhancement, as channel height is reduced from 1000 μm to 20 μm, is accompanied by a >2 orders of magnitude reduction in the assay Limit of Detection (LoD, low picomolar, from 0.254 nM to 12.5 pM).
To further investigate the impact of microfluidic confinement on assay performance, we next examined how target capture probability—modulated through receptor density—affects the signal acquisition rate (eqn (4)). As expected, receptor density directly scales the microfluidic enhancements, as shown in Fig. 6, where two distinct regimes emerge at a threshold of 20 ng cm−2, aligning with the simulation results (Fig. S4, ESI†).
 | ||
| Fig. 6 The impact of microfluidic flux enhancement as a function of (SPR determined) antibody surface density. The binding rate was normalized as the ratio of the temporal Cr change in response to 10 μg mL−1 CRP samples within microfluidic channels of 20, 100, and 250 μm versus 1000 μm height, respectively. Error bars represent the standard deviation across three individual electrodes (n = 3). | ||
Enhanced assay selectivity
Nonspecific fouling, arising from the undesired accumulation of background proteins and other interferents, imposes significant challenges in real-world interfacial sensing, where false positives can occur and specific target recruitment can be inhibited (necessitating antifouling strategies or surface engineering).25,67 We have shown above that an increase in sample flux enhances both kon,obs and Ka. These effects are, of course, expected to be much more pronounced when mass transport dominates surface accumulation—that is, when kon is very high, as seen in specific binding events (see earlier theoretical analysis and Fig. 3b). This is indeed experimentally borne out (Fig. 7) by comparing the temporal Cr changes for specific/nonspecific biorecognition pairs, where the four orders difference in association rate constants (SPR determined; see the Experimental section, ESI†) between specific and nonspecific events enables a very substantial 300% enhancement in selectivity when flux is boosted by compressing the delivery channel (see selectivity coefficient KCRP/BSA in Fig. 8a; data analysis is detailed in the Experimental section, ESI†). Very strong correlations (Pearson correlation coefficients of 0.999 and 0.874 respectively) were noted between this increase in specificity and the SPR-resolved association rate constant log10kon and log10Ka, respectively. | ||
| Fig. 7 The strong resolved correlation between the enhancement of target binding rate on channel compression and the association rate constant kon for nonspecific (HSA/anti-CRP, BSA/anti-CRP) and specific (CRP/anti-CRP, streptavidin/biotin) biorecognition pairs. Association rate constants were derived from SPR sensograms, as detailed in the Experimental section, ESI.† | ||
 | ||
| Fig. 8 (a) The impact of microfluidic channel height on assay sensitivity and selectivity, and (b) recovery of CRP spiked into human serum. Relative sensitivity was normalized by comparing the CRP dose-temporal response slope to those observed at a channel height of 1000 μm. The selectivity coefficient was calculated as the ratio of these slopes for CRP (target) and BSA (control). CRP recovery in serum was calculated as the average across four concentrations (1.25, 2.50, 5.00, and 10.0 μg mL−1) at each channel height. Error bars represent the standard deviations from three independent measurements (n = 3). | ||
Building upon these enhanced selectivity observations, we sought to investigate the possibility of these entirely un-passivated receptive PANI electrodes to support specific target assays in serum (Fig. 8b). As expected, with 1000 μm channels, poor recoveries (>150%) were noted in serum-spiked samples particularly when CRP concentrations were below 1.0 μg mL−1. Attempts to mitigate nonspecific fouling by applying blocking agents (e.g., SuperBlock™ blocking buffer and powdered milk), were limited. It is very notable that CRP recovery approached unity with samples spiked in diluted human serum (20 μm vs. 1000 μm: 109.6 ± 4.8% vs. 141.8 ± 7.4%), as the channel height decreased. These results highlight the microfluidic confinement in minimizing nonspecific fouling, enabling robust target detection in serum using simple, untreated, and un-passivated sensor surfaces (see Fig. S18† for dose–response curves in serum-spiked samples).
The assaying performance, as quantified by sensitivity (12 pM herein with 20 μM channels vs. 70 pM in previous work) and selectivity (KCRP/BSA,20μm = 31![[thin space (1/6-em)]](https://www.rsc.org/images/entities/char_2009.gif) 000 in this study vs. KCRP/BSA,previous = 3000), is significantly enhanced compared to previous work,49 highlighting the potent role microfluidic confinement can have in enhancing interfacial binding.
000 in this study vs. KCRP/BSA,previous = 3000), is significantly enhanced compared to previous work,49 highlighting the potent role microfluidic confinement can have in enhancing interfacial binding.
Conclusions
In this study, we have demonstrated the pivotal role of microfluidic confinement in enhancing the sensitivity and selectivity within a simple interfacial sensing system. By leveraging the precise fluid manipulation that microfluidics offers, we are able to significantly amplify assay response and sensitivity without any resort to conventional amplification strategies that rely on nanomaterials or catalytic processes. The integration of microfluidic configurations with electrochemical sensors has, to date, not only showcased versatility in streamlining workflow and minimizing experimental variability. We have shown here that very simple channel height engineering can support profoundly beneficial convective effects that accelerate target acquisition and response magnitudes. We have shown that these enhancements thereafter support an enhanced and very sensitive assaying of a model marker, CRP (low picomolar LoD). This work has also shown that these microfluidic enhancements preferentially favor specific binding over nonspecific fouling and this, in turn, can be leveraged to significantly increase interfacial selectivity. In leveraging these effects, we have demonstrated the assaying of a clinically relevant (CRP) marker in serum using untreated, and unprotected immunosensor surfaces, eliminating the need for pretreatment or additional blocking steps.In combining theoretical derivations and COMSOL simulations, the underlying mechanisms driving these effects have been resolved as enhanced analyte flux within compressed microfluidic channels where mass transport limitations have been removed. These effects are, of course, most pertinent to the mass transport-limited (MTL) or partial MTL regimes of interfacial binding.27,68,69 These results, then, clearly highlight the potential optimization of real-world-relevant biosensor performance through (3D printable) device design. We have specifically presented a versatile, accessible, and powerful strategy for promoting enhancements in sensitivity and selectivity.
Data availability
The data supporting this article have been included as part of the ESI,† where additional experimental detail, materials, instruments, and relevant protocols are included. It also includes the PANI interface characterization, microfluidic cell and flow system schematics, CRP recovery in serum data, the effects of channel height on binding affinity, COMSOL simulated sensograms, and simulations exploring the influence of flow rate and association rate constant on interfacial biorecognition.Author contributions
Electrochemical, SPR measurements, downstream electrochemical assays and COMSOL simulation were conducted by S. K. The manuscript was written by S. K., and J. J. D. J. J. D. was responsible for the concepts and experimental design. All authors have given approval to the final version of the manuscript.Conflicts of interest
The authors declare no competing financial interest.Acknowledgements
The authors acknowledge helpful discussions from Dr Robert Barber, Dr Zhen Qin, and Dr Simon Wikeley.References
- K. Strimbu and J. A. Tavel, What are biomarkers?, Curr. Opin. HIV AIDS, 2010, 5, 463–466 Search PubMed.
- J. K. Aronson and R. E. Ferner, Biomarkers-a general review, Curr. Protoc. Pharmacol., 2017, 76, 9.23.01–9.23.17 CrossRef.
- L. Wu and X. Qu, Cancer biomarker detection: recent achievements and challenges, Chem. Soc. Rev., 2015, 44, 2963–2997 CAS.
- D. F. Hayes, Biomarker validation and testing, Mol. Oncol., 2015, 9, 960–966 Search PubMed.
- D. Grieshaber, R. MacKenzie, J. Vörös and E. Reimhult, Electrochemical biosensors-sensor principles and architectures, Sensors, 2008, 8, 1400–1458 CAS.
- P. T. Kissinger, Biosensors-a perspective, Biosens. Bioelectron., 2005, 20, 2512–2516 CAS.
- N. J. Ronkainen, H. B. Halsall and W. R. Heineman, Electrochemical biosensors, Chem. Soc. Rev., 2010, 39, 1747–1763 CAS.
- L. Guo, Y. Zhao, Q. Huang, J. Huang, Y. Tao, J. Chen, H.-Y. Li and H. Liu, Electrochemical protein biosensors for disease marker detection: progress and opportunities, Microsyst. Nanoeng., 2024, 10, 65 CAS.
- M. Sharafeldin and J. J. Davis, Point of care sensors for infectious pathogens, Anal. Chem., 2020, 93, 184–197 Search PubMed.
- M. Mehrvar and M. Abdi, Recent developments, characteristics, and potential applications of electrochemical biosensors, Anal. Sci., 2004, 20, 1113–1126 CAS.
- L. Clark, Monitoring and control blood and tissue oxygen, Trans. Am. Soc. Artif. Intern. Organs, 1958, 2, 41–48 Search PubMed.
- E. Cesewski and B. N. Johnson, Electrochemical biosensors for pathogen detection, Biosens. Bioelectron., 2020, 159, 112214 CAS.
- M. Amiri, A. Bezaatpour, H. Jafari, R. Boukherroub and S. Szunerits, Electrochemical methodologies for the detection of pathogens, ACS Sens., 2018, 3, 1069–1086 CAS.
- M. Banakar, M. Hamidi, Z. Khurshid, M. S. Zafar, J. Sapkota, R. Azizian and D. Rokaya, Electrochemical biosensors for pathogen detection: an updated review, Biosensors, 2022, 12, 927 CAS.
- J. Vidic and M. Manzano, Electrochemical biosensors for rapid pathogen detection, Curr. Opin. Electrochem., 2021, 29, 100750 CAS.
- A. J. Bandodkar and J. Wang, Non-invasive wearable electrochemical sensors: a review, Trends Biotechnol., 2014, 32, 363–371 CAS.
- J. R. Windmiller and J. Wang, Wearable electrochemical sensors and biosensors: a review, Electroanalysis, 2013, 25, 29–46 CrossRef CAS.
- J. F. Hernández-Rodríguez, D. Rojas and A. Escarpa, Electrochemical sensing directions for next-generation healthcare: trends, challenges, and frontiers, Anal. Chem., 2020, 93, 167–183 CrossRef.
- J. Wu, H. Liu, W. Chen, B. Ma and H. Ju, Device integration of electrochemical biosensors, Nat. Rev. Bioeng., 2023, 1, 346–360 CrossRef CAS.
- S. Rodriguez-Mozaz, M. J. L. de Alda, M.-P. Marco and D. Barceló, Biosensors for environmental monitoring: a global perspective, Talanta, 2005, 65, 291–297 CAS.
- G. Hanrahan, D. G. Patil and J. Wang, Electrochemical sensors for environmental monitoring: design, development and applications, J. Environ. Monit., 2004, 6, 657–664 RSC.
- J. Wang and K. Rogers, Electrochemical sensors for environmental monitoring: a review of recent technology, US Environmental Protection Agency, 1995 Search PubMed.
- C. I. Justino, A. C. Duarte and T. A. Rocha-Santos, Recent progress in biosensors for environmental monitoring: a review, Sensors, 2017, 17, 2918 CrossRef PubMed.
- N. Chu, Q. Liang, W. Hao, Y. Jiang, P. Liang and R. J. Zeng, Microbial electrochemical sensor for water biotoxicity monitoring, Chem. Eng. J., 2021, 404, 127053 CrossRef CAS.
- P.-H. Lin and B.-R. Li, Antifouling strategies in advanced electrochemical sensors and biosensors, Analyst, 2020, 145, 1110–1120 CAS.
- Y. Wu, R. D. Tilley and J. J. Gooding, Challenges and solutions in developing ultrasensitive biosensors, J. Am. Chem. Soc., 2018, 141, 1162–1170 Search PubMed.
- T. Gervais and K. F. Jensen, Mass transport and surface reactions in microfluidic systems, Chem. Eng. Sci., 2006, 61, 1102–1121 CrossRef CAS.
- I.-H. Cho, J. Lee, J. Kim, M.-s. Kang, J. K. Paik, S. Ku, H.-M. Cho, J. Irudayaraj and D.-H. Kim, Current technologies of electrochemical immunosensors: Perspective on signal amplification, Sensors, 2018, 18, 207 CrossRef PubMed.
- T. M.-H. Lee, M. C. Carles and I.-M. Hsing, Microfabricated PCR-electrochemical device for simultaneous DNA amplification and detection, Lab Chip, 2003, 3, 100–105 RSC.
- S. A. Lim and M. U. Ahmed, Electrochemical immunosensors and their recent nanomaterial-based signal amplification strategies: a review, RSC Adv., 2016, 6, 24995–25014 Search PubMed.
- Z. Wang and Z. Dai, Carbon nanomaterial-based electrochemical biosensors: an overview, Nanoscale, 2015, 7, 6420–6431 RSC.
- B. D. Malhotra and M. A. Ali, Nanomaterials in biosensors: Fundamentals and applications, Elsevier, Amsterdam, 2018 Search PubMed.
- M. Holzinger, A. Le Goff and S. Cosnier, Nanomaterials for biosensing applications: a review, Front. Chem., 2014, 2, 63 Search PubMed.
- L. Li, T. Wang, Y. Zhong, R. Li, W. Deng, X. Xiao, Y. Xu, J. Zhang, X. Hu and Y. Wang, A review of nanomaterials for biosensing applications, J. Mater. Chem. B, 2024, 12, 1168–1193 RSC.
- E. B. Bahadır and M. K. Sezgintürk, Applications of graphene in electrochemical sensing and biosensing, TrAC, Trends Anal. Chem., 2016, 76, 1–14 CrossRef.
- S. K. Arya and P. Estrela, Electrochemical ELISA-based platform for bladder cancer protein biomarker detection in urine, Biosens. Bioelectron., 2018, 117, 620–627 CrossRef CAS PubMed.
- S. K. Arya and P. Estrela, Recent advances in enhancement strategies for electrochemical ELISA-based immunoassays for cancer biomarker detection, Sensors, 2018, 18, 2010 CrossRef PubMed.
- S. Hosseini, P. Vázquez-Villegas, M. Rito-Palomares and S. O. Martinez-Chapa, in Enzyme-Linked Immunosorbent Assay (ELISA), Springer, 2018, pp. 67–115 Search PubMed.
- M. Sharafeldin, F. Fleschhut, T. James and J. J. Davis, A quantification of target protein biomarkers in complex media by faradaic shotgun tagging, Anal. Chem., 2022, 94, 2375–2382 Search PubMed.
- M. Sharafeldin, S. Yan, C. Jiang, G. K. Tofaris and J. J. Davis, Alternating magnetic field-promoted nanoparticle mixing: the on-chip immunocapture of serum neuronal exosomes for Parkinson's disease diagnostics, Anal. Chem., 2023, 95, 7906–7913 CrossRef CAS PubMed.
- M. B. Kulkarni, N. H. Ayachit and T. M. Aminabhavi, Biosensors and microfluidic biosensors: from fabrication to application, Biosensors, 2022, 12, 543 CrossRef CAS.
- S. A. Muhsin, Y. He, M. Al-Amidie, K. Sergovia, A. Abdullah, Y. Wang, O. Alkorjia, R. A. Hulsey, G. L. Hunter and Z. K. Erdal, A microfluidic biosensor architecture for the rapid detection of COVID-19, Anal. Chim. Acta, 2023, 1275, 341378 CrossRef CAS PubMed.
- R. Ehrnström, Profile: Miniaturization and integration: challenges and breakthroughs in microfluidics, Lab Chip, 2002, 2, 26N–30N RSC.
- N. Lion, F. Reymond, H. H. Girault and J. S. Rossier, Why the move to microfluidics for protein analysis?, Curr. Opin. Biotechnol., 2004, 15, 31–37 CrossRef CAS PubMed.
- D. G. Rackus, M. H. Shamsi and A. R. Wheeler, Electrochemistry, biosensors and microfluidics: a convergence of fields, Chem. Soc. Rev., 2015, 44, 5320–5340 RSC.
- A. Fernández-la-Villa, D. F. Pozo-Ayuso and M. Castaño-Álvarez, Microfluidics and electrochemistry: an emerging tandem for next-generation analytical microsystems, Curr. Opin. Electrochem., 2019, 15, 175–185 CrossRef.
- J. P. Lafleur, A. Jönsson, S. Senkbeil and J. P. Kutter, Recent advances in lab-on-a-chip for biosensing applications, Biosens. Bioelectron., 2016, 76, 213–233 CrossRef CAS PubMed.
- A. Baradoke, R. Hein, X. Li and J. J. Davis, Reagentless redox capacitive assaying of C-reactive protein at a polyaniline interface, Anal. Chem., 2020, 92, 3508–3511 CrossRef CAS.
- S. Kang, M. Sharafeldin, S. C. Patrick, X. Chen and J. J. Davis, Ultrafast biomarker quantification through reagentless capacitive kinetics, Anal. Chem., 2023, 95, 4721–4727 CrossRef CAS.
- J. A. Cooper and R. G. Compton, Channel electrodes-a review, Electroanalysis, 1998, 10, 141–155 CrossRef CAS.
- R. G. Compton and C. E. Banks, Understanding Voltammetry, World Scientific, 3rd edn, 2018 Search PubMed.
- D. I. H. Barr, The Transition from Laminar to Turbulent Flow, Proc. Instn. Civ. Engrs., 1980, 69, 555–562 Search PubMed.
- S. H. Northrup and H. P. Erickson, Kinetics of protein-protein association explained by Brownian dynamics computer simulation, Proc. Natl. Acad. Sci. U. S. A., 1992, 89, 3338–3342 CrossRef CAS PubMed.
- X. Duan, Y. Li, N. K. Rajan, D. A. Routenberg, Y. Modis and M. A. Reed, Quantification of the affinities and kinetics of protein interactions using silicon nanowire biosensors, Nat. Nanotechnol., 2012, 7, 401–407 CrossRef CAS PubMed.
- P. Dejardin, M. Le, A. Johner and J. Wittmer, Adsorption rate in the convection-diffusion model, Langmuir, 1994, 10, 3898–3901 CAS.
- P. Déjardin and E. N. Vasina, An accurate simplified data treatment for the initial adsorption kinetics in conditions of laminar convection in a slit: application to protein adsorption, Colloids Surf., B, 2004, 33, 121–127 Search PubMed.
- B. Li, J. Chen and M. Long, Measuring binding kinetics of surface-bound molecules using the surface plasmon resonance technique, Anal. Biochem., 2008, 377, 195–201 CAS.
- S. Y. Rabbany, A. W. Kusterbeck, R. Bredehorst and F. S. Ligler, Binding kinetics of immobilized antibodies in a flow immunosensor, Sens. Actuators, B, 1995, 29, 72–78 CAS.
- G. Hu, Y. Gao and D. Li, Modeling micropatterned antigen-antibody binding kinetics in a microfluidic chip, Biosens. Bioelectron., 2007, 22, 1403–1409 Search PubMed.
- J. Skopp, Derivation of the Freundlich adsorption isotherm from kinetics, J. Chem. Educ., 2009, 86, 1341 CAS.
- D. Harvey, Modern Analytical Chemistry, McGraw-Hill, New York, 2000 Search PubMed.
- H. Ogi, Y. Fukunishi, H. Nagai, K. Okamoto, M. Hirao and M. Nishiyama, Nonspecific-adsorption behavior of polyethylenglycol and bovine serum albumin studied by 55-MHz wireless–electrodeless quartz crystal microbalance, Biosens. Bioelectron., 2009, 24, 3148–3152 Search PubMed.
- T. M. Squires, R. J. Messinger and S. R. Manalis, Making it stick: convection, reaction and diffusion in surface-based biosensors, Nat. Biotechnol., 2008, 26, 417–426 CAS.
- A. J. Bard, L. R. Faulkner and H. S. White, Electrochemical Methods: Fundamentals and Applications, Wiley, Hoboken, 3rd edn, 2022 Search PubMed.
- E. Macchia, K. Manoli, B. Holzer, C. Di Franco, R. A. Picca, N. Cioffi, G. Scamarcio, G. Palazzo and L. Torsi, Selective single-molecule analytical detection of C-reactive protein in saliva with an organic transistor, Anal. Bioanal. Chem., 2019, 411, 4899–4908 CrossRef CAS PubMed.
- G. Schreiber, G. Haran and H.-X. Zhou, Fundamental aspects of protein-protein association kinetics, Chem. Rev., 2009, 109, 839–860 CrossRef CAS PubMed.
- C. Jiang, G. Wang, R. Hein, N. Liu, X. Luo and J. J. Davis, Antifouling strategies for selective in vitro and in vivo sensing, Chem. Rev., 2020, 120, 3852–3889 CrossRef CAS.
- K. Sigmundsson, G. Másson, R. Rice, N. Beauchemin and B. Öbrink, Determination of active concentrations and association and dissociation rate constants of interacting biomolecules: an analytical solution to the theory for kinetic and mass transport limitations in biosensor technology and its experimental verification, Biochemistry, 2002, 41, 8263–8276 CrossRef CAS PubMed.
- L. L. Christensen, Theoretical analysis of protein concentration determination using biosensor technology under conditions of partial mass transport limitation, Anal. Biochem., 1997, 249, 153–164 Search PubMed.
Footnote |
| † Electronic supplementary information (ESI) available. See DOI: https://doi.org/10.1039/d5sc00199d |
| This journal is © The Royal Society of Chemistry 2025 |