
 Open Access Article
 This Open Access Article is licensed under a Creative Commons Attribution-Non Commercial 3.0 Unported Licence
Mass-balancing strategy enhances the cycling stability of rice husk-derived activated carbon-based supercapacitors in KOH electrolyte†
Dechen Liu ab,
Wenli Zhangb,
Haibo Lin*b and
Nan Lin*c
ab,
Wenli Zhangb,
Haibo Lin*b and
Nan Lin*c
aJilin Province Innovation Center for Criminal Science and Technology, Jilin Police College, Changchun 130117, China
bCollege of Chemistry, Jilin University, Changchun 130012, China. E-mail: lhb910@jlu.edu.cn
cState Key Laboratory of Inorganic Synthesis & Preparative Chemistry, Jilin University, Changchun, 130012, China. E-mail: nanlin@jlu.edu.cn
First published on 21st July 2025
Abstract
Rice husk-derived activated carbon prepared via KOH activation usually has high specific capacitance due to its high oxygen content and high specific surface area, which is regarded as a promising candidate for supercapacitor electrodes. However, the poor cycling stability of supercapacitors based on rice husk-derived activated carbon in KOH electrolyte severely limit its commercial application. In this study, the influence of different positive-to-negative electrode mass ratios on the cycling stability of supercapacitors was systematically investigated using rice husk-derived activated carbon as electrode materials. The results show that increasing the positive-to-negative electrode mass ratios significantly enhances the cycling stability of supercapacitors. In this process, the continuous increase in positive electrode potential is effectively suppressed, which avoid the oxidation of the positive electrode. When the positive-to-negative electrode mass ratio is increased from 1 to 2, the capacitance retention of the supercapacitors significantly increases from 27.9% to 96.4% after 10![[thin space (1/6-em)]](https://www.rsc.org/images/entities/char_2009.gif) 000 charge–discharge cycles. Meanwhile, the specific capacitance is only reduced by 9.1%. The supercapacitor with positive-to-negative electrode mass ratio s of 1 and 2 shows energy densities of 10.68 W h kg−1 and 9.54 W h kg−1 at 0.5 A g−1, retaining 46.8% and 43.4% of energy densities at 20 A g−1. Adjusting the positive-to-negative electrode mass ratio does not significantly affect the electrochemical properties of supercapacitors. Thus, this work unfolds a new strategy for enhancing the cycling stability of activated carbon-based supercapacitors in alkaline electrolytes and a viable route for practical energy storage applications of rice husk-derived activated carbon in supercapacitors.
000 charge–discharge cycles. Meanwhile, the specific capacitance is only reduced by 9.1%. The supercapacitor with positive-to-negative electrode mass ratio s of 1 and 2 shows energy densities of 10.68 W h kg−1 and 9.54 W h kg−1 at 0.5 A g−1, retaining 46.8% and 43.4% of energy densities at 20 A g−1. Adjusting the positive-to-negative electrode mass ratio does not significantly affect the electrochemical properties of supercapacitors. Thus, this work unfolds a new strategy for enhancing the cycling stability of activated carbon-based supercapacitors in alkaline electrolytes and a viable route for practical energy storage applications of rice husk-derived activated carbon in supercapacitors.
Introduction
Carbon-based supercapacitors (SCs) are regarded as a promising energy storage device owing to their long cycle life, high power density, and fast charge/discharge capability.1–3 Among various carbon materials, activated carbon (AC) has been widely investigated as an electrode material for SCs because of its high specific surface area, abundant raw materials, excellent electrical properties and low cost.4–6 ACs with high specific surface area generally possess high specific capacitance, which endows SCs with high energy density. Therefore, significant research efforts have been dedicated to preparing ACs from various precursors to achieve high specific surface area.7–9 Rice husk (RH), due to its abundance and low cost, has been extensively employed in the preparation of activated carbons through chemical activation processes. Prior investigations have shown that KOH activation enables rice husk-derived activated carbon (RHC) to achieve exceptional specific surface areas up to 3000 m2 g−1.10,11 Furthermore, KOH activation simultaneously introduces abundant oxygen-containing functional groups on the surface of the ACs.12 Although oxygen-containing functional groups contribute the pseudocapacitance in AC, they simultaneously compromise cycling stability, especially in the KOH electrolyte system.13,14 During electrochemical processes, the unstable oxygen-containing functional groups are prone to undergo irreversible redox reactions. This not only causes a rapid decline in the capacity initially provided by these functional groups but also leads to progressive pore structure blockage in the electrode material.12In our previous studies, comparable electrochemical degradation behavior was observed in SCs employing RHC electrodes and KOH electrolyte.15 Meanwhile, it has been found that capacity fading in SCs originates from the severe oxidation of the positive electrode, which results from the continuous increase in positive electrode potential during cycling. This oxidative degradation correlates with the accumulation of oxygen-containing functional groups on the positive carbon electrode surface, which catalyze parasitic side reactions. To enhance the cycle life of SCs, thermal treatment was conducted under the protection of nitrogen to reduce the oxygen-containing functional groups on RHC. However, the specific capacitance of RHCs exhibited a significant decrease after heat treatment, which would severely limit the application of RHC-based SCs.15 How can the cycle life of SCs in KOH electrolytes be enhanced without sacrificing capacitive performance, and what strategies can be taken to prevent the positive electrode oxidation induced by the increasing electrode potential during cycling? Despite the ubiquity of KOH electrolytes in commercial SCs, systematic studies addressing these challenges remain scarce.16
This study proposes a mass-balancing strategy to enhance the cycling stability of SCs in alkaline electrolytes by strategically adjusting the positive-to-negative electrode mass ratio (m+/m−). Four SCs with varying m+/m− (1, 1.25, 1.5, and 2) were fabricated using RHC as the active material for both electrodes and 6.0 mol per L KOH as aqueous electrolyte. The electrochemical performance of the SCs was systematically evaluated through electrochemical impedance spectroscopy (EIS), galvanostatic charge–discharge (GCD), and cyclic voltammetry (CV).
Experimental
Materials
Rice husk was sourced from a rice milling facility in Changchun City, Jilin Province. Additional chemicals (analytical grade) were procured from Sinopharm Chemical Reagent Co., Ltd. High-purity nitrogen and deionized water were used throughout the experimental procedures.Preparation of RHC
Firstly, the RH was thoroughly washed to remove impurities and then dried at 80 °C in an oven for 10 hours. Subsequently, the dried RH was pulverized into fine power. RH powder was subjected to carbonization at 500 °C with 10 °C min−1 under a nitrogen atmosphere. The carbonization process was maintained continuously for 1 hour. The carbonized rice husk was then mixed uniformly with KOH solution at a 1:4 mass ratio, and the mixtures were dried at 110 °C for 24 hours. Following this, the dried mixtures were activated at 700 °C for 1 hour. The activated samples were rinsed to neutral pH with deionized water. Finally, the activated carbon dried at 110 °C for 24 hours. The final activated carbon labelled as RHC.
Material characterization
The porous characteristics of the synthesized materials were evaluated by an ASAP 2010 Micromeritics instrument with N2 adsorption at 77 K. Specific surface area was calculated via the Brunauer–Emmett–Teller (BET) method, while total pore volume was determined from the adsorption data at P/P0 = 0.97. Surface chemical composition was characterized by X-ray photoelectron spectroscopy (XPS) using a Thermo VG ESCALAB250 surface analysis system. Survey scans and high-resolution spectra were acquired to quantify elemental composition and oxygen-containing functional groups. The crystallinity of the sample was evaluated by X-ray diffraction (XRD, Rigaku D/max 2550). The surface morphology and pore structure were characterized using a Scanning electron microscopy (SEM; HITACHI SU8020) and transmission electron microscopy (TEM, JEOL, JEM 1200EX).Electrochemical measurements
The electrode was fabricated by homogenizing mixture of RHC (85 wt%), polytetrafluoroethylene (5 wt%), and carbon black (10 wt%). The electrochemical performance of SCs fabricated with different mass ratios of the positive and negative electrodes (m+/m− = 1, 1.25, 1.5, and 2) was evaluated employing a two-electrode configuration in 6 mol per L KOH electrolyte. In SCs, the electrode area of both the positive and negative electrodes is 1 × 1 cm2. The mass loading of the positive electrode is 4 mg cm−2, and the mass of the negative electrode is matched according to different positive-to-negative electrode mass ratios. The electrochemical performance of the SCs was systematically evaluated using a PARSTAT 2273 electrochemical workstation (Ametek, USA) and a BTS4008 battery tester (Neware, China). CV measurement was conducted at a scan rate of 5 mV s−1 to characterize the capacitive behavior, while EIS analysis was carried out over a frequency range of 10 mHz to 100 kHz to study charge transfer resistance and ion diffusion characteristics. GCD tests were conducted at various current densities (0.5, 1, 2, 5, 10, 20 A g−1) within an operating voltage range of 0–1 V to characterize the SCs with varying m+/m− ratios. Cycling stability tests were carried out using the GCD at a constant current density of 1 A g−1 and a voltage range of 0–1 V. Meanwhile, the electrode potentials were monitored during GCD cycling of SCs. When the voltage of SC is 1 V (fully charged state), the positive electrode potential attains its maximum value, which is defined as Emax+. Concurrently, the negative electrode potential reaches its minimum value, denoted as Emin−. When the voltage of SC is 0 V (fully discharged state), the potentials of both the positive and negative electrodes converge to an identical value, which is defined as the equilibrium potential Ee. During the GCD cycling of SC, the potential variation range of the positive electrode is defined as ΔE+, and the corresponding range for the negative electrode is defined as ΔE−.The electrochemical performance of RHC electrode was studied in a three-electrode configuration with 6 mol per L KOH electrolyte, employing a Hg/HgO reference electrode (0.098 V vs. NHE) and a platinum counter electrode. The GCD was carried out within the potential variation ranges of the positive and negative electrodes at different current densities (0.5, 1, 2, 5, 10, 20 A g−1). The CV was conducted at a scan rate of 5 mV s−1 over a potential window of −1.2 V to 0.2 V vs. Hg/HgO.
The specific capacitance was calculated in a two-electrode configuration using the total mass of positive and negative electrodes through CV and GCD measurements, which are performed using the following formulas respectively:
 | (1) |
 | (2) |
The energy density and power density of the SCs were calculated using the following formulas respectively:
 | (3) |
 | (4) |
Results and discussion
Structural and chemical characteristics of RHC
Fig. 1a and b show the morphology of RHC. The hierarchical macroporous structure with varying diameters was observed on the surface of RHC. In addition, abundant micropores and mesopores were observed in RHC (Fig. 1c), which exhibits a three-dimensional cross-linked framework. Furthermore, the highly interconnected pore network in RHC not only serves as an ion-buffering reservoir to facilitate efficient charge transport but also effectively reduces internal resistance while simultaneously offering a large accessible surface area and abundant adsorption sites.17–19 XRD patterns of the RHC is shown in Fig. 1d. A broad peak centered at 43° assigned to the (002) reflections of graphitic carbon and a weak peak at 22° corresponding to the (100) lattice planes are observed in RHC, collectively indicating the presence of an amorphous carbon structure.20,21 In the XRD patterns, the slope of the curve at small angles (≤15°) reflects the microporosity abundance within the materials, where a steeper gradient specifically indicates a higher density of micropores.22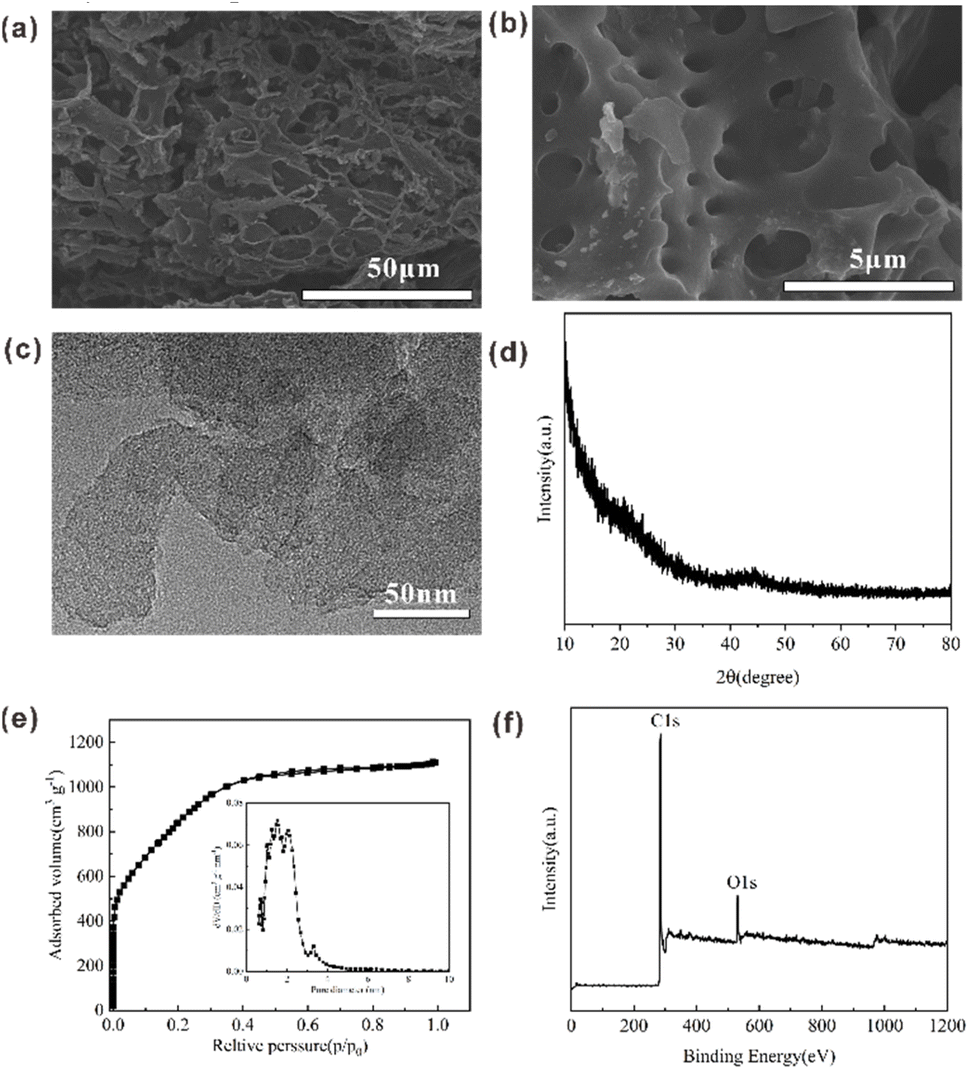 | ||
| Fig. 1 (a) Low-magnification SEM image; (b) high-magnification SEM image; (c) TEM image; (d) X-ray diffraction pattern; (e) N2 adsorption–desorption isotherms (inset is the corresponding pore size distribution); and (f) XPS survey scan of RHC. | ||
Fig. 1e presents the N2 adsorption–desorption isotherm curve of RHC. It can be clearly observed that RHC exhibits a typical type IV isothermal adsorption–desorption curve. This indicates that RHC is mainly a microporous material. This observation aligns with the XRD patterns (Fig. 1d). Meanwhile, the RHC demonstrated an exceptionally high specific surface area of 3185 m2 g−1, as determined by BET analysis with N2 adsorption at 77 K. This remarkable textural property originated from the well-developed microporous architecture during the KOH activation process.23,24 The ultrahigh specific surface area engenders abundant electrochemical active sites, facilitating efficient electric double-layer formation, which empowers RHC to achieve an exceptional specific capacitance.25 As shown in the inset of Fig. 1e, the pore size distribution of RHC ranges from 0.5 to 4 nm, indicating that its structure is composed of a large number of micropores and a small amount of mesopores. This result is in good agreement with the conclusion drawn from the nitrogen adsorption–desorption isotherm. The detailed porous parameters of RHC are summarized in Table S1 (in the ESI).† The chemical characteristics of the RHC were analyzed using XPS. The XPS spectrum in Fig. 1f exhibits two main peaks located at 284.8 eV (C 1s) and 531 eV (O 1s), respectively. The total oxygen content of RHC was determined based on the core energy levels of O 1s using peak intensities. The RHC has a high total oxygen content value of 8.54 at%, which is favorable for obtaining pseudocapacitance. The oxygen-containing functional groups of RHC was quantified through XPS depth profiling and elemental analysis, with detailed composition data provided in Table S2 (in the ESI).†
The cycling stability of RHC-based supercapacitors in KOH electrolyte
To evaluate the cycling stability of RHC-based supercapacitors in KOH electrolytes, a GCD cycling test was conducted in a symmetric two-electrode configurations (m+/m− = 1) at a current density of 1 A g−1. Fig. 2a shows that the capacitance retention exhibits an accelerating decline throughout the entire cycling process. In the early stages of cycling, the SC maintains high capacitance retention initially. The capacitance retention of the SC decreases slowly before 2000 GCD cycles, yet it still maintains approximately 90.1% of its initial capacitance. Subsequently, the capacitance retention undergoes accelerated degradation. After 10000 GCD cycles, its capacitance retention is only 27.9%, which indicates the poor cycling stability of the symmetric SC in KOH electrolyte.
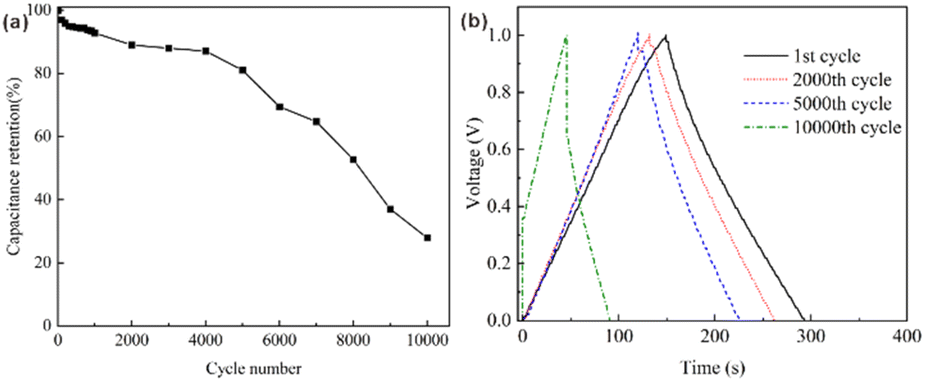 | ||
| Fig. 2 (a) The capacitance retention of the symmetric supercapacitor over 10000 cycles at 1 A g−1 and (b) GCD curves of the symmetric supercapacitor at different numbers of cycles at 1 A g−1. | ||
Fig. 2b shows the GCD curves of the symmetric supercapacitor at different cycle numbers. At the initial stages of cycling, GCD curves show the typical behavior of electric double-layer capacitive behavior. However, after several cycles, this behavior is distorted. The poor electrochemical behavior of SC in KOH electrolyte after 10000 cycles is clearly evidenced by pronounced GCD curve distortion. Concurrently, the high voltage drop is observed after 10000 GCD cycles, which is associated with the increase in its internal large ion diffusion resistance.26 To determine the electrode responsible for voltage drop, the electrode potentials of the positive and negative electrodes before and after cycling were recorded (Fig. S1 in the ESI).† As shown in Fig. S1,† the positive electrode potential dropped sharply when the SC changed from the charging state to the discharging state. In contrast, the negative electrode potential did not show significant changes during the cycling process. It is indicated that the voltage drop in the 10000th GCD curve originates from the positive electrode. To further confirm this result, the electrode potentials and potential ranges at different cycles were recorded during the long-term cycling, and the detailed potential values were listed in Table 1. With increasing cycling, the positive electrode exhibited a progressive expansion in its operational potential window (ΔE+), while the negative electrode demonstrated a gradual contraction (ΔE−). Additionally, the Emax+ and the Emin− exhibited a gradual increase after long-term cycling. Specifically, ΔE+ exhibited a progressive increase from 0.645 V during the initial GCD cycle to 0.880 V following 10000 cycles, while the Er remained relatively stable. Consequently, Emax+ exhibited an increase from 0.085 V during the initial cycle to 0.361 V following 10000 cycles. The sustained elevation of Emax+ induced severe oxidative decomposition of RHC, resulting in a consequential increase in ion diffusion resistance. These findings demonstrate that the poor cycling stability of SCs originates from the continuous elevation of positive electrode potential. Therefore, suppressing the increase in the positive electrode potential during cycling is crucial to enhancing the long-term cycling stability of SCs.
000 GCD cycles
| Cycle number | Ee (V) | Emax+ (V) | Emin− (V) | ΔE+ (V) | ΔE− (V) |
|---|---|---|---|---|---|
| 1st cycle | −0.560 | 0.085 | −0.915 | 0.645 | 0.355 |
| 2000th cycle | −0.550 | 0.111 | −0.889 | 0.661 | 0.339 |
| 5000th cycle | −0.531 | 0.140 | −0.860 | 0.681 | 0.319 |
| 10000th cycle |
−0.519 | 0.361 | −0.639 | 0.880 | 0.120 |
Strategy of increasing the stability of supercapacitors in KOH electrolyte
To suppress the increase in the positive electrode potential, we analyzed the fundamental energy storage mechanisms of supercapacitors. In such systems, the charge balance principle dictates that the charges stored in the positive and negative electrodes remain equal (Q+ = Q−). Specifically, the charge stored by each electrode is intrinsically governed by its potential range (ΔE), mass (m), and specific capacitance (Cs), as expressed by the following relationship:27| Q = mCsΔE | (5) |
| m+Cs+ΔE+ = m−Cs−ΔE− | (6) |
When the electrode masses are equal (m+ = m−), an increase in ΔE+ during cycling implies a gradual decline in the positive electrode's specific capacitance. To maintain charge equilibrium, the expansion of ΔE+ shifts the maximum positive electrode potential toward higher values. In asymmetric configurations (m+ ≠ m−), ΔE+ and ΔE− depend on both the electrodes' specific capacitances and the mass ratio. Thus, regulating the potential ranges (and consequently the positive electrode potential) is achievable by optimizing the m+/m− ratio. Eqn (5) further demonstrates that increasing the positive electrode mass (m+) effectively suppresses the expansion of ΔE+.
To validate this strategy, RHC-based SCs with varying m+/m− ratios (1, 1.25, 1.5, and 2) were subjected to 10000 GCD cycles at a current density of 1 A g−1. As shown in Fig. 3, increasing m+/m− significantly enhances cycling stability. When m+/m− is raised from 1 to 2, capacitance retention increases from 27.9% to 96.4%, demonstrating that optimizing the mass ratio enhances the cycling stability of SC in KOH electrolyte.
 | ||
| Fig. 3 Long-term cycling stability of SCs with varying m+/m− ratios at 1 A g−1 for 10000 cycles. | ||
To further analyze these results, the potentials of both electrodes were monitored in SCs with varying m+/m− ratios after the initial cycle. As illustrated in Fig. 4a, increasing m+/m− reduces both the Emax+ and the Emin−, thereby narrowing the ΔE+ while expanding that of ΔE−. The detailed potential values at varying m+/m− ratios are summarized in Table 2. When m+/m− increased from 1 to 2, Emax+ decreased from 0.085 V to 0.012 V, and ΔE+ decreased from 0.645 V to 0.477 V. These trends confirm that lower Emax+ and narrower ΔE+ effectively suppress the rise in positive electrode potential during cycling. Fig. 4b displays the CV curve of RHC, measured within the potential window of −1.2 V to 0.2 V. Notably, the ΔE+ range shifts to a more stable region as m+/m− increases from 1 to 2, confining the positive electrode within a safer operational window during charging. This confinement mitigates faradaic degradation caused by excessive potentials, thereby enhancing the stability of electric double-layer capacitance behaviour.
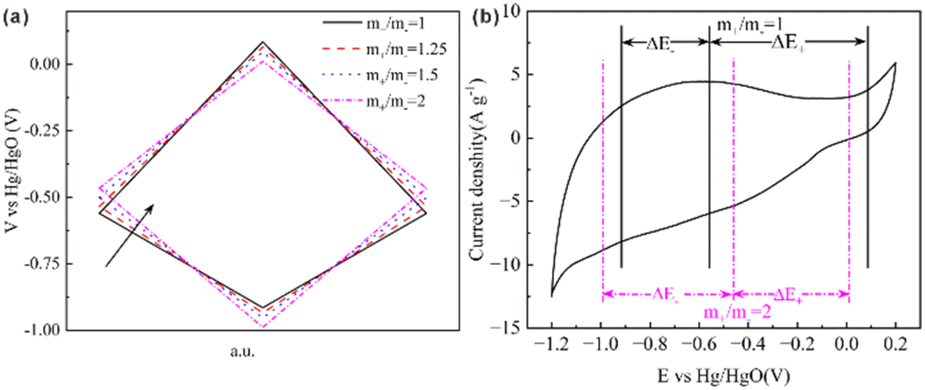 | ||
| Fig. 4 (a) Evolution of potentials of both electrodes in SCs throughout the GCD testing process; (b) CV curve of RHC in three-electrode cell configuration at a scan rate of 5 mV s−1. | ||
| m+/m− | Ee (V) | Emax+ (V) | Emin− (V) | ΔE+ (V) | ΔE− (V) |
|---|---|---|---|---|---|
| 1 | −0.560 | 0.085 | −0.915 | 0.645 | 0.355 |
| 1.25 | −0.534 | 0.066 | −0.934 | 0.600 | 0.400 |
| 1.5 | −0.500 | 0.047 | −0.953 | 0.547 | 0.453 |
| 2 | −0.465 | 0.012 | −0.988 | 0.477 | 0.523 |
To evaluate long-term effects, potentials of both electrodes in SCs with m+/m− = 2 were measured after 1 and 10000 GCD cycles (Table 3). The negligible variation in Emax+ confirms that increasing m+/m− effectively stabilizes the positive electrode potential during cycling.
| Cycle number | Ee (V) | Emax+ (V) | Emin− (V) | ΔE+ (V) | ΔE− (V) |
|---|---|---|---|---|---|
| 1st cycle | −0.465 | 0.012 | −0.988 | 0.477 | 0.523 |
| 10000th cycle |
−0.463 | 0.020 | −0.980 | 0.483 | 0.517 |
XPS was employed to quantitatively analyze oxygen-containing functional groups on RHC within the positive electrode after cycling in KOH electrolyte. Survey scans (Fig. S2 in the ESI†) and high-resolution O 1s spectra were analyzed. The O 1s XPS spectrum was subjected to shirley background subtraction and deconvoluted into four distinct chemical states (Fig. 5): adsorbed oxygen (530.4 ± 0.5 eV), carbonyl groups C![[double bond, length as m-dash]](https://www.rsc.org/images/entities/char_e001.gif) O (531.7 ± 0.5 eV), hydroxyl/ether moieties–C–O/–OH (532.8 ± 0.5 eV), and carboxyl/ester functionalities COOH/C(O)O (533.6 ± 0.5 eV).28,29 Notably, the O 1s peak area for RHC in the m+/m− = 1 system (Fig. 5b) exceeds that in m+/m− = 2 (Fig. 5a), indicating higher oxygen content in the former. Table 4 quantifies oxygen-containing functional groups before and after 10000 GCD cycles. There is a sharp rise in total oxygen content from 8.54 at% to 21.22 at% for m+/m− = 1 after 10000 GCD cycles, compared to a marginal increase (8.54 at% to 9.12 at%) for m+/m− = 2. These results confirm severe RHC oxidation in the symmetric configuration (m+/m− = 1), which is effectively suppressed through mass balancing (m+/m− = 2).
O (531.7 ± 0.5 eV), hydroxyl/ether moieties–C–O/–OH (532.8 ± 0.5 eV), and carboxyl/ester functionalities COOH/C(O)O (533.6 ± 0.5 eV).28,29 Notably, the O 1s peak area for RHC in the m+/m− = 1 system (Fig. 5b) exceeds that in m+/m− = 2 (Fig. 5a), indicating higher oxygen content in the former. Table 4 quantifies oxygen-containing functional groups before and after 10000 GCD cycles. There is a sharp rise in total oxygen content from 8.54 at% to 21.22 at% for m+/m− = 1 after 10000 GCD cycles, compared to a marginal increase (8.54 at% to 9.12 at%) for m+/m− = 2. These results confirm severe RHC oxidation in the symmetric configuration (m+/m− = 1), which is effectively suppressed through mass balancing (m+/m− = 2).
 | ||
| Fig. 5 High-resolution O 1s XPS spectra of RHC electrode in SCs after 10000 GCD cycles: (a) positive electrode from SCs with m+/m− = 2; (b) positive electrode from SCs with m+/m− = 1. | ||
000 GCD cycles
CV was systematically employed to evaluate the electrochemical behaviors of SCs with varying m+/m− ratios in KOH electrolytes. As shown in Fig. 6a, all CV curves exhibit nearly rectangular shapes, characteristic of ideal electric double-layer capacitive behavior, confirming the dominance of non-faradaic charge storage mechanisms in the tested supercapacitors. Indicative of ideal electric double-layer capacitive behavior. The integrated area under the CV curves, which serves as a proxy for specific capacitance, displays a non-monotonic relationship with the m+/m− ratio. The specific capacitance reaches a maximum at m+/m− = 1.25 and subsequently decreases as the m+/m− increases further. This indicates a non-monotonic dependence of the specific capacitance on the m+/m− ratio, peaking at an optimal mass ratio before declining with further increases. Meanwhile, the CV curves exhibited increasingly rectangular shapes with increasing m+/m−. Increasing m+/m− may induce shifts in the Ee, E+, and E−. These shifts allow both electrodes to operate within adjusted potential ranges, thereby enhancing their electric double-layer capacitive characteristics through optimized charge distribution at the electrode–electrolyte interfaces.
 | ||
| Fig. 6 (a) CV curves of SCs with varying m+/m− ratios at a scan rate of 5 mV s−1; (b) specific capacitance of SCs with varying m+/m− ratios at a scan rate of 5 mV s−1; (c) specific capacitance of SCs with varying m+/m− ratios at the different current density; (d) Ragone plots of SCs with varying m+/m− ratios. | ||
Fig. 6b demonstrates the relationship between the specific capacitance of SCs and the m+/m− ratios. At m+/m− = 1, the SC achieves a specific capacitance of 155 F g−1. This value increases to a maximum of 167 F g−1 at m+/m− = 1.25, representing a 7.7% enhancement, followed by a decline to 141 F g−1 at m+/m− = 2. The specific capacitance of SCs decreased by about 9.1% when m+/m− increased from 1 to 2, which is markedly less severe than 30% capacitance loss observed in thermally treated electrodes.13 It can be known that enhancing the cycling stability of RHC-based SCs in KOH electrolyte by increasing m+/m− is more effective compared with enhancing it through heat treatment of RHC. This strategy avoids a significant decrease in the specific capacitance of SCs. The specific capacitance of SCs is directly related to the m+/m− ratios and the accompanying change in the ΔE+ and ΔE−. At the critical mass ratio where ΔE+ = ΔE−, the capacitances of both electrodes equilibrate, as dictated by the charge–balance relationship formalized in eqn (6).
Based on the equation employed for calculating the capacitance of a supercapacitor:30
 | (7) |
Eqn (7) demonstrates that the total capacitance of the SC is maximized when the CP and CN are equal. This equilibrium condition occurs at a critical mass ratio where ΔE+ = ΔE−, the capacitance of the SC reaches its maximum value. As shown in Table 2, increasing m+/m− reduces the ΔE+ while expanding that of the ΔE−, thereby driving ΔE+ and ΔE− to gradually converge toward equilibrium. This explains why the specific capacitance of SCs initially increases with increasing m+/m−. However, further increases in m+/m− will lead to progressively elevate the total electrode mass, which in turn causes the specific capacitance of SCs to decline. Therefore, the maximum specific capacitance is achieved at m+/m− = 1.25.
Fig. 6c shows the specific capacitance of SCs with variying m+/m− ratios under various current densities. As shown in Fig. 6c, the specific capacitance of SCs at different current densities all exhibits a trend of first increasing and then decreasing with the increase of the m+/m− ratio. All SCs achieve the maximum specific capacitance at m+/m− = 1.25, which is consistent with the results in Fig. 6b. While specific capacitance decreases with increasing current density, the decay profiles remain parallel, indicating that the mass ratio has little effect on the rate performance. The energy-power characteristics of SCs with varying m+/m− ratios were evaluated under different current densities. As illustrated in the Ragone plot (Fig. 6d), the SC with an m+/m− ratio of 1 achieves a high energy density of 10.68 W h kg−1 at a power density of 124 W kg−1 under a current density of 0.5 A g−1, maintaining 46.8% energy retention (5.0 W h kg−1) at 20 A g−1 with a corresponding power density of 4737 W kg−1. Comparatively, the SC with m+/m− = 2 delivers an energy density of 9.54 W h kg−1 at 122 W kg−1 under 0.5 A g−1, retaining 43.4% energy density (4.14 W h kg−1) at a power density of 4662 W kg−1 with the current density of 20 A g−1. These results indicate that the adjustment of the m+/m− does not significantly alter the energy-power characteristics of the device.
The Nyquist plots of the SCs in Fig. 7a exhibit characteristic electrochemical impedance features. At high frequencies (inset in Fig. 7a), a small semicircle is observed, with its diameter along the real axis corresponding to the charge-transfer resistance (Rct).31 The equivalent series resistance (ESR), derived from the high-frequency intercept of the Nyquist plot's semicircle on the real axis,32,33 arises from the summation of three primary contributors: electronic resistance of the porous electrode matrix, interfacial contact resistance between the electrode and current collector, and ionic transfer resistance in the electrolyte.34,35 Notably, the ESR values show minimal variation across different m+/m− ratios, increasing only marginally from 0.08 Ω (m+/m− = 1) to 0.10 Ω (m+/m− = 2). This is likely due to increased electrode thickness at higher m+/m− ratios, which marginally elevates ionic diffusion pathways.36 In the medium-to-low frequency range, the Nyquist plots gradually transition to near-vertical lines, with the low-frequency region approaching a 90° phase angle relative to the real axis. This indicates that the electrode exhibits ideal capacitive behavior.31 This finding corroborates the nearly rectangular cyclic voltammograms in Fig. 6a, confirming minimal diffusion limitations and efficient ion transport kinetics even at elevated m+/m−. Simultaneously, the remarkably low resistance values obtained under mass-balancing strategies in this research stand in favorable contrast to the results previously reported in other papers.37–40 These results highlight the viability of optimizing m+/m− to enhance capacitance without sacrificing the kinetic advantages critical for high-power applications. As shown in Fig. 7b, the diameter of the semicircle in the Nyquist plot gradually decreases with the increase of the m+/m− ratios, indicating a progressive decline in Rct of the SCs. Meanwhile, as depicted in Fig. 7b, the length of sloping linear region with an approximate angle of 45°observed in the high-to-medium frequency range of Nyquist plot decrease with the increase of the m+/m− ratios. This decrease is indicative of a progressive decline in the diffusion resistance the SCs.41,42 These phenomena demonstrate that increasing the m+/m− ratios inhibits the rise in positive electrode potential and suppresses the formation of oxygen-containing functional groups arising from oxidative degradation, thereby reducing the resistance to electron transfer from the inner carbon layer to the pore interface and accelerating the diffusion process for ions inside pores. This suppression leads to a reduction in the charge-transfer resistance at the interface between the inner carbon layer and the pore, as electrons can move more freely without being hindered by these oxygen-containing functional groups. Additionally, it accelerates the ion diffusion process within the pores. The presence of fewer oxygen-containing functional groups allows ions to diffuse more efficiently through the pore structure of the electrode material. To further evaluate the influence of the m+/m− ratios on the cycle life of SCs, Bode phase angle analysis was performed pre- and post-cycling (Fig. 7c and d). Fig. 7c shows the relationship between the phase angle and frequency of SCs with varying m+/m− ratios at 1st cycle. It is observed that all curves exhibit no obvious differences as the m+/m− ratios increase. Additionally, the phase angles of these SCs approach approximately −90° at low frequencies, confirming their ideal capacitive behavior. This further suggests that increasing the m+/m− ratios does not significantly impact the capacitive performance of SCs, which is consistent with Fig. 7a. On the contrary, the Bode plots of SCs with varying m+/m− ratios show obvious changes after 10000 cycles (Fig. 7d). In the low-frequency region, the phase angle of SCs with a high m+/m− ratio (e.g., m+/m− = 2) still approaches −90° after 10000 cycle, while that of SCs with a low m+/m− ratio (e.g., m+/m− = 1) deviates significantly. This indicates that increasing the m+/m− ratio effectively enhances the capacitive performance of SCs after cycling. Furthermore, it confirms that the positive electrode of SCs with a high mass ratio undergoes no obvious oxidation and maintains superior ion transfer capability, consistent with the results in Fig. 7b.
 | ||
| Fig. 7 Nyquist Plots of SCs with varying m+/m− ratios at 1st cycle (a) and 10000th cycle (b); Bode plots of SCs with varying m+/m− ratios at 1st cycle (c) and 10000th cycle (d). | ||
To further investigate oxidative degradation mechanisms in positive electrodes, morphological analyses were conducted on RHC electrodes from SCs with varying m+/m− ratios after 10000 GCD cycles. Fig. 8 reveals progressive surface roughening of RHC with increasing m+/m−, attributable to chemical etching by electrogenerated active oxygen species or gas evolution at the carbon–electrolyte interface.43,44 This morphological evolution indicates that low m+/m− ratios induce severe oxidative damage, while elevated ratios effectively mitigate oxidation through operational potential confinement. TEM was used for further microscopic morphology analysis of RHC, and the results are shown in Fig. S4 (in the ESI).† TEM analysis of positive electrodes from low m+/m− configurations reveals distinct alternating bright/dark contrast regions (Fig. S4c and d†), indicative of heterogeneous surface degradation and pore wall collapse. This structural deterioration corresponds directly with the progressive roughening observed via SEM in Fig. 8, confirming oxidative damage at the nanoscale. Conversely, positive electrodes from high m+/m− configurations (Fig. S4a and b†) retain structural homogeneity, confirming that mass-balancing suppresses corrosive interfacial reactions.
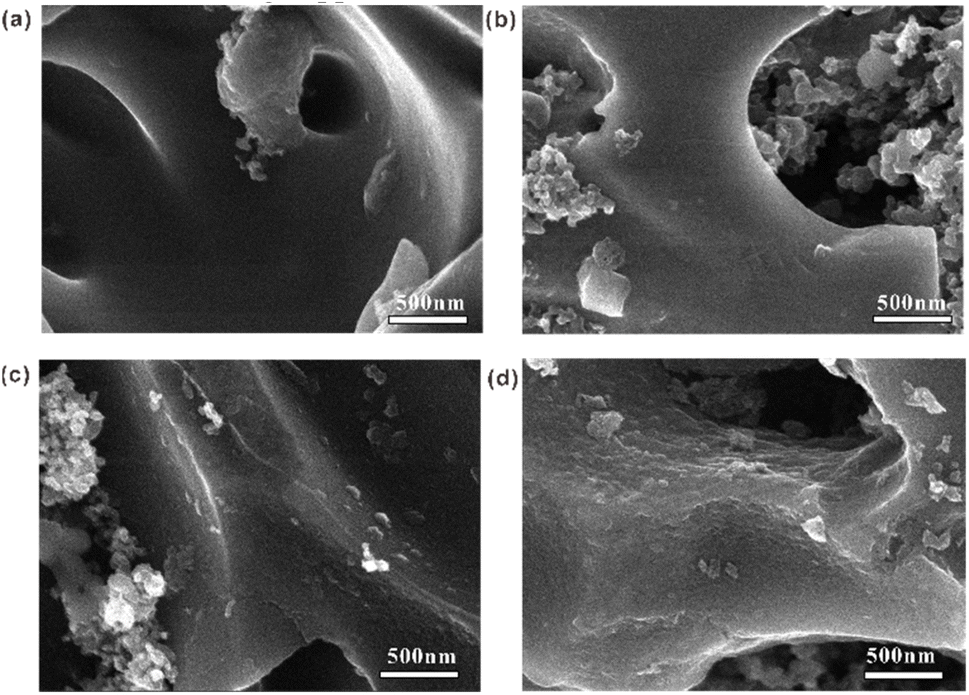 | ||
| Fig. 8 SEM images of RHC in the positive electrode of SCs with varying m+/m− ratios at 2 (a), 1.5 (b), 1.25 (c), 1 (d) after 10000 GCD cycles. | ||
To evaluate the effectiveness of the mass-balance strategy in the practical application of SCs, the rate capabilities of individual positive and negative electrodes were quantified within their operational potential windows. As shown in Fig. S3 (in the ESI),† both electrodes exhibit nearly identical capacitance retention profiles across current densities (0.5–20 A g−1), with <7% divergence in retention rates at all m+/m− ratios. This confirms that all positive and negative electrodes in SCs exhibit similar rate capabilities, indicating that the mass balance strategy does not fail during the practical operation of SCs (Detailed analysis is provided in the ESI†).
Based on the above research findings, it is evident that increasing the m+/m− ratios is a more effective approach for enhancing the cycling stability of RHC-based SCs in KOH electrolyte. This strategy is simple to operate and easy to implement. More importantly, the SCs still maintain excellent electrochemical performance through the mass-balancing strategy.
Conclusions
This study systematically investigates the cycling stability and electrochemical performance of SCs employing RHC electrodes with varied mass ratios in 6 mol per L KOH electrolyte. SCs assembled with different mass loading (m+/m− = 1, 1.25, 1.5, 2) demonstrate that increasing m+/m− effectively mitigates the rise of the positive electrode potential during GCD cycles, thereby suppressing oxidative degradation (Fig. 9). At m+/m− = 2, the Emax+ stabilizes at 0.020 V after 10000 cycles, which is much lower than 0.354 V observed at m+/m− = 1. This suppression correlates with reduced oxygen content in the positive electrode (9.12 at% vs. 21.22 at% for m+/m− = 2 and 1, respectively). Consequently, the SC with m+/m− = 2 achieves excellent cycling stability (96.4% capacitance retention), starkly contrasting with the rapid degradation of the symmetric m+/m− = 1 system (27.9% capacitance retention). Although the SC with an m+/m− ratio of 1.25 exhibits the highest initial specific capacitance (167 F g−1), the SC with an m+/m− ratio of 2 prioritizes long-term stability without sacrificing performance (141 F g−1). The SC with m+/m− ratios of 1 and 2 shows energy densities of 10.68 W h kg−1 and 9.54 W h kg−1 at 0.5 A g−1, retaining 46.8% and 43.4% of energy densities at 20 A g−1. Adjusting the m+/m− does not significantly alter the energy-power characteristics of the device. These findings establish electrode mass balancing as a critical strategy for enhancing the cycling stability of RHC-based SCs in alkaline electrolytes. Through adjusting the m+/m−, the positive electrode potential can be effectively restricted within a stable potential window. This confinement effectively suppresses the oxidation of activated carbon, which maintains the long-term performance of the RHC-based SCs. Meanwhile, the mass-balancing strategy avoids the application of energy-intensive post-treatment procedures (e.g., thermal annealing) and provides a path that can be scaled up for the production of durable and high-performance AC-based SCs.
 | ||
| Fig. 9 Schematic of the mass-balancing strategy for suppressing the oxidation of the positive electrode. | ||
Data availability
All data related to this work is presented in the manuscript and the ESI.†Author contributions
Dechen Liu: writing – original draft, visualization, methodology, formal analysis, and data curation; Wenli Zhang: investigation, methodology, writing – review & editing; Haibo Lin: supervision and project administration; Nan Lin: funding acquisition, writing – review & editing.Conflicts of interest
There are no conflicts to declare.Acknowledgements
This work was supported by the National Natural Science Foundation of China (No. 22279042), the 14th Five-Year Plan Science and Technology Project of the Ministry of Education of Jilin Province (No. JJKH20231084KJ), the Scientific Research Projects of Jilin Police College (No. jykyzd202504).References
- D. R. Lobato-Peralta, P. U. Okoye and C. Alegre, J. Power Sources, 2024, 617, 235140 CrossRef CAS.
- Y. Wang, L. Zhang, H. Hou, W. Xu, G. Duan, S. He, K. Liu and S. Jiang, J. Mater. Sci., 2021, 56, 173–200 CrossRef CAS.
- W. Fan, F. Wang, X. Xiong, B. Song, T. Wang, X. Cheng, Z. Zhu, J. He, Y. Liu and Y. Wu, NPG Asia Mater., 2024, 16, 18 CrossRef CAS.
- H. Hu, M. Yan, J. Jiang, A. Huang, S. Cai, L. Lan and Y. Zhao, Sci. Total Environ., 2024, 912, 169141 CrossRef CAS.
- Z. Zhai, L. Zhang, T. Du, B. Ren, Y. Xu, S. Wang and Z. Liu, Mater. Des., 2022, 221, 111017 CrossRef CAS.
- B. Chen, D. Wu, T. Wang, F. Yuan and D. Jia, Chem. Eng. J., 2023, 462, 142163 CrossRef CAS.
- Y. Yin, Q. Liu, Y. Zhao, T. Chen, J. Wang, L. Gui and C. Lu, Energy Fuels, 2023, 37, 3523–3554 CrossRef CAS.
- B. Xue, J. Xu and R. Xiao, Chem. Eng. J., 2023, 454, 140192 CrossRef CAS.
- S. Lv, L. Ma, X. Shen and H. Tong, J. Mater. Sci., 2021, 56, 1919–1942 CrossRef CAS.
- D. Liu, W. Zhang, H. Lin, Y. Li, H. Lu and Y. Wang, RSC Adv., 2015, 5, 19294–19300 RSC.
- D. Liu, W. Zhang and W. Huang, Chem. Lett., 2019, 30, 1315–1319 CAS.
- J. Castro-Gutiérrez, R. L. Canevesi, M. Emo, M. T. Izquierdo, A. Celzard and V. Fierro, Renewable Sustainable Energy Rev., 2022, 167, 112716 CrossRef.
- P. Kurzweil, J. Schottenbauer and C. Schell, J. Energy Storage, 2021, 35, 102311 CrossRef.
- C. Qiu, L. Jiang, Y. Gao and L. Sheng, Mater. Des., 2023, 230, 111952 CrossRef CAS.
- W. Zhang, D. Liu, H. Lin, H. Lu, J. Xu and D. Liu, Colloids Surf., A, 2016, 511, 294–302 CrossRef CAS.
- E. Pameté, L. Köps, F. A. Kreth, S. Pohlmann, A. Varzi, T. Brousse and V. Presser, Adv. Energy Mater., 2023, 13, 2301008 CrossRef.
- J. Zhao, S. Yang, P. Zhang and S. Dai, Fuel, 2021, 286, 119393 CrossRef CAS.
- X. Tao, Y. Li, H. G. Wang, X. Lv, Y. Li, D. Xu, Y. Jiang and Y. Meng, J. Colloid Interface Sci., 2020, 565, 494–502 CrossRef CAS PubMed.
- X. Wei, D. Zheng, M. Zhao, H. Chen, X. Fan, B. Gao, L. Gu, Y. Guo, J. Qin, J. Wei and Y. Zhao, Angew. Chem., 2020, 132, 14747–14754 CrossRef.
- F. Liu, F. Zhang and J. Niu, RSC Adv., 2025, 15, 2582–2590 RSC.
- H. Boulika, M. Hajamab, M. Hajji Nabih, N. Idrissi Kandri and A. Zerouale, RSC Adv., 2022, 12, 34393–34403 RSC.
- Y. Liu, R. Withers and L. Norén, Solid State Sci., 2003, 5, 427–434 CrossRef CAS.
- C. E. Sánchez-Rodríguez, E. Tovar-Martínez and R. López-Sandoval, Electrochim. Acta, 2024, 507, 145151 CrossRef.
- Y. Li, J. Mei, L. Wu, Q. Xu and Z. Li, Int. J. Hydrogen Energy, 2024, 49, 67–80 CAS.
- Y. Zhu, Z. Li, Y. Tao, J. Zhou and H. Zhang, J. Energy Storage, 2022, 47, 103624 CrossRef.
- J. Wan, T. Lv, Y. Liu, X. Wang, Y. Yang, Z. Chen and T. Chen, Adv. Funct. Mater., 2022, 32, 2108794 CrossRef CAS.
- N. R. Chodankar, H. D. Pham, A. K. Nanjundan, J. F. Fernando, K. Jayaramulu, D. Golberg and D. P. Dubal, Small, 2020, 16, 2002806 CrossRef CAS PubMed.
- S. Bhartiya, R. Singh, A. Singh, M. Balal, P. Bhardwaj, D. K. Kohli and M. K. Singh, J. Solid State Electrochem., 2022, 26, 2829–2839 CrossRef CAS.
- F. Rao, Q. Xiao, Y. Wei, J. Wang, R. Yu and D. Wang, Chem. Res. Chin. Univ., 2024, 40, 690–698 CrossRef CAS.
- Y. Shao, M. F. El-Kady, J. Sun, Y. Li, Q. Zhang, M. Zhu and R. B. Kaner, Chem. Rev., 2018, 118, 9233–9280 CrossRef CAS PubMed.
- M. Li, C. Liu, H. Cao, H. Zhao, Y. Zhang and Z. Fan, J. Mater. Chem. A, 2014, 2, 14844–14851 RSC.
- X. F. Sánchez-Romate, A. Del Bosque, J. Artigas-Arnaudas, B. K. Muñoz, M. Sánchez and A. Ureña, Electrochim. Acta, 2021, 370, 137746 CrossRef.
- L. E. Helseth, J. Energy Storage, 2021, 35, 102304 CrossRef.
- F. Yang, J. Chu, Y. Cheng, J. Gong, X. Wang and S. Xiong, Chem. Res. Chin. Univ., 2021, 37, 772–777 CrossRef CAS.
- P. Mehra, C. Singh, I. Cherian, A. Giri and A. Paul, ACS Appl. Energy Mater., 2021, 4, 4416–4427 CrossRef CAS.
- E. G. Calvo, F. Lufrano, A. Arenillas, A. Brigandì, J. A. Menéndez and P. Staiti, J. Appl. Electrochem., 2014, 44, 481–489 CrossRef CAS.
- J. Cheng, Z. Lu, X. Zhao, X. Chen and Y. Liu, J. Power Sources, 2021, 494, 229770 CrossRef CAS.
- J. K. Ou, H. W. Zhang, Y. Lei, K. Y. Li, B. Li, H. X. Deng and L. Zou, J. Cent. South Univ., 2023, 30, 419–433 CrossRef CAS.
- X. Pang, M. Cao, J. Qin, X. Li and X. Yang, J. Porous Mater., 2022, 29, 559–569 CrossRef CAS.
- S. M. Benoy, A. Hazarika, M. Bora, A. Rajbongshi, D. Sarmah, M. K. Phukan and B. K. Saikia, ACS Appl. Energy Mater., 2024, 7, 6045–6061 CrossRef CAS.
- A. J. Roberts and R. C. Slade, Electrochim. Acta, 2010, 55, 7460–7469 CrossRef CAS.
- S. Sopčić, D. Antonić and Z. Mandić, J. Solid State Electrochem., 2022, 26, 591–605 CrossRef.
- G. Milczarek, A. Ciszewski and I. Stepniak, J. Power Sources, 2011, 196, 7882–7885 CrossRef CAS.
- T. Momma, X. Liu, T. Osaka, Y. Ushio and Y. Sawada, J. Power Sources, 1996, 60, 249–253 CrossRef CAS.
Footnote |
| † Electronic supplementary information (ESI) available. See DOI: https://doi.org/10.1039/d5ra03028e |
| This journal is © The Royal Society of Chemistry 2025 |