
 Open Access Article
 This Open Access Article is licensed under a Creative Commons Attribution-Non Commercial 3.0 Unported Licence
Core/shell molecularly imprinted nanoparticles: optimized synthesis and application in QCM-D biosensing
Mariacristina Gagliardi* and
Marco Cecchini
NEST, Istituto Nanoscienze-CNR, Scuola Normale Superiore, Piazza San Silvestro, Pisa, I-56127, Italy. E-mail: mariacristina.gagliardi@cnr.it
First published on 2nd June 2025
Abstract
Molecularly imprinted nanoparticles (MI-NPs) are synthetic receptors with high selectivity and stability, offering advantages for biosensing applications. In this study, we developed and optimized core/shell molecularly imprinted nanoparticles (CS-MI-NPs) tailored for quartz crystal microbalance with dissipation monitoring (QCM-D) sensors. The nanoparticles were synthesized through a controlled sol–gel process, achieving tunable sizes (22–63 nm) and high monomer conversion. Functionalization with amine and vinyl groups facilitated imprinting of a selective shell, enhancing the recognition capabilities of CS-MI-NPs. The optimized system demonstrated significantly improved binding performance, with a specific surface area increase of 260–270% and a target protein retention rate of 34–37%, compared to 6–12% in non-imprinted controls. Langmuir modeling confirmed high affinity and selective binding sites, while QCM-D measurements validated efficient immobilization, low nonspecific interactions, and a detection limit of 2.8 nM for streptavidin. Additionally, CS-MI-NPs selectively recognized tannins in complex mixtures, distinguishing between proanthocyanidins, ellagic, and gallic tannins, with detection levels comparable to biologically derived probes. These results highlight CS-MI-NPs as a versatile and high-performance platform for nanostructured biosensors, with potential applications in biomedical diagnostics, environmental monitoring, and food analysis.
1 Introduction
Molecular imprinting (MI) is a powerful and versatile synthetic strategy for designing polymers with molecular recognition capabilities. By polymerizing functional monomers in the presence of a template molecule, it is possible to create binding sites that are spatially and chemically complementary to the target. Upon template removal, the resulting cavities can selectively rebind the target with high affinity and specificity, mimicking the function of natural receptors such as antibodies or enzymes.1–3 This approach is particularly appealing in applications where the need for stability, robustness, and long-term storage often limits the use of biological recognition elements. Natural receptors are subject to degradation, require controlled storage conditions (e.g., refrigeration), and often suffer from limited shelf life and batch-to-batch variability. In contrast, molecularly imprinted polymers (MIPs) exhibit exceptional thermal and chemical stability, are compatible with a wide range of solvents and pH conditions, are reusable and can be stored at room temperature without significant loss of performance. These features make MIPs particularly suited for field-deployable, durable, and cost-effective sensing platforms.Molecularly imprinted nanoparticles (MI-NPs) can be tailored to a wide range of targets by rational design of monomer-template interactions and polymerization conditions.4 Over the years, MI-NPs have attracted increasing interest in biosensing5,6 due to their specificity in recognizing proteins,7–9 nucleic acids,10 and small organic compounds.11,12
Originally developed for small molecule recognition, molecular imprinting has been adapted to address the challenges associated with larger biomolecules, such as conformational flexibility, complex surface topography, and aqueous solubility. Strategies such as epitope imprinting have been introduced to overcome these limitations.13 Surface imprinting is another key approach that allows for the creation of a thin imprinted shell around a solid core, thus enhancing accessibility of the recognition sites and improving both binding kinetics and sensitivity.14–17
Surface-imprinted core/shell nanoparticles (CS-MI-NPs) are particularly advantageous for imprinting large biomolecules such as proteins, which present considerable challenges due to their size, structural complexity, and conformational dynamics.18 CS-MI-NPs offer precise control over particle size and surface chemistry, reduced mass transport limitations, and enhanced performance in aqueous environments. The synthesis of a MI system requires careful optimization of various factors, such as functional monomers,19 cross-linkers,20 and polymerization conditions.21,22 As a rule, operative conditions are critical for achieving high affinity and specificity for the target molecule.23 Surface imprinting of CS-MI-NPs also enables precise control over nanoparticle size and shell thickness, thereby improving binding efficiency and minimizing nonspecific adsorption.24
After synthesis, CS-MI-NPs can be integrated into biosensing platforms. Quartz crystal microbalance with dissipation monitoring (QCM-D) is a powerful tool for real-time detection of substances.25–28 Functionalizing QCM-D sensors with MI-NPs allows for the creation of highly selective biosensors for protein detection. The functionalization of QCM-D sensors with MI-NPs has already been demonstrated for protein detection.29 Recent studies have explored the application of MI-functionalized QCM sensors for detecting various proteins, significantly improving sensitivity and selectivity (e.g.30–32). In this context, the use of CS-MI-NPs enables the design of stable and selective biosensors for complex biological or environmental targets, while maintaining the reproducibility and scalability required for practical applications.
In addition to proteins, we selected tannins as a second class of target analytes to demonstrate the versatility of the approach across chemically and structurally distinct molecules. Tannins are complex polyphenolic compounds with broad molecular weight distributions, diverse conformations, and a high tendency to aggregate in aqueous media. They are relevant in several fields, including food science, oenology, pharmaceuticals, and environmental monitoring, where their detection and discrimination (e.g., between gallotannins, ellagitannins, and proanthocyanidins) is often required in complex mixtures. The use of MI allows the development of robust and selective recognition elements for such challenging analytes, overcoming the limitations of conventional biosensors based on biological affinity elements. Including tannins in our study enabled us to assess the performance of CS-MI-NPs in conditions of high matrix complexity and structural heterogeneity, thus highlighting their applicability beyond classical protein detection.
In this study, we optimized a surface-imprinted core/shell nanoparticle system against streptavidin (CS-sMI-NPs), aiming to develop a versatile, high-performance sensing platform. As the impact of core size, surface functionalization, monomer composition and concentration, and shell thickness was systematically investigated to maximize recognition efficiency. As a demonstration of applicability, synthesized nanoparticles were integrated in QCM-D sensors and tested for the selective detection of proteins and polyphenolic compounds in complex matrices. Additionally, we tested the same system imprinted against tannins (CS-tMI-NPs), which are large molecules with distinct conformations and compositions compared to streptavidin. Specifically, we conducted a case study by imprinting our nanoparticles with proanthocyanidin tannins and testing them against complex samples containing both proanthocyanidins and ellagitannins. Our findings demonstrate the potential of CS-MI-NPs as effective probes for bulk acoustic waves sensors functionalization.
2 Materials and methods
2.1 Materials
Unless specifically stated otherwise, all reagents were purchased from Sigma-Aldrich. Tetraethyl orthosilicate (TEOS, molecular weight 208.33 g mol−1, specific gravity 0.93 g mL−1, purity > 99%), 3-(trimethoxysilyl)propyl methacrylate (TMPMA, Mw 248.35 g mol−1, specific gravity 1.05 g mL−1, purity 98%), and (3-aminopropyl)triethoxysilane (APTES, Mw 221.37 g mol−1, specific gravity 0.95 g mL−1, purity 99%) served as the primary reagents for core synthesis and subsequent reactive functionalization. Trimethylolpropane trimethacrylate (TRIM, Mw 338.40 g mol−1, specific gravity 1.06 g mL−1, technical grade), 2-hydroxyethyl methacrylate (2-HEMA, Mw 1130.14 g mol−1, specific gravity 1.07 g mL−1, purity > 99%), 2-(dimethylamino)ethyl acrylate (DMAEA, Mw 143.18 g mol−1, specific gravity 0.94 g mL−1, purity 98%), methyl methacrylate (MMA, Mw 100.12 g mol−1, specific gravity 0.94 g mL−1, purity 99%) and 2,2′-azobis(2-methylpropionitrile) (AIBN, Mw 164.21 g mol−1, purity 98%) were used for the synthesis of the imprinted shell. Methylene blue (MB, Mw 319.85 g mol−1, purity > 97%) was used for specific surface tests. Streptavidin (STREP, IBA Lifesciences, 53 kDa, purity > 95%) and bovine serum albumin (BSA, 66 kDa, purity > 96%) were used as proteins in syntheses, rebinding tests, isotherm tests, and QCM-D experiments. Poly(ethylene glycol) 2-mercaptoethyl ether acetic acid (HS–PEG–COOH, NanoCS, 2 kDa), dithiothreitol (DTT, Mw 154.25 g mol−1, purity > 98%), N-(3-dimethylaminopropyl)-N′-ethylcarbodiimide (EDCl, Mw 191.70 g mol−1, commercial grade), and N-hydroxysuccinimide (NHS, Mw 115.09 g mol−1, purity > 98%) were used for adlayer formation and as coupling agents. For the case study, three commercial oenological additives (Laffort, Italy), TANIN VR GRAPE® (TVRG, proanthocyanidin tannins extracted from grapes), TANIN VR SUPRA® (TVRS, proanthocyanidin and ellagitannins), and TANIN GALALCOOL® (TG, gallic tannins) were used for synthesis and QCM-D tests. Absolute ethanol (EtOH, HPLC purity), ammonium hydroxide (NH4OH, ACS purity, 32% v/v), hydrogen peroxide (H2O2, ACS purity, 35% v/v), Milli-Q water, phosphate buffered saline solution (PBS, 140 mM NaCl, 10 mM phosphate buffer, 3 mM KCl, pH 7.4 at 25 °C), hydrochloric acid (HCl, ACS purity, 36% in water), sodium dodecyl sulfate (SDS, molecular biology purity, 20% solution in water), acetic acid (CH3COOH, glacial, ACS purity degree), and sodium bicarbonate solution (NaHCO3, ACS purity) were used as solvents in syntheses and all tests. Monomers, proteins, and the radical initiator were used as purchased, while solvents were filtered before use.2.2 Nanoparticle characterization
Photon Correlation Spectroscopy (PCS) was used to measure nanoparticle size, polydispersity index (PDI), and average photon count (kcps). The ζ-potential was also measured using the same apparatus (Zetasizer, Malvern Panalytical, Malvern, UK).Nanoparticle size was determined by diluting suspensions (∼0.1 mg mL−1) in water, placing 50 μL in a quartz cuvette, and measuring. Any protocol modifications are detailed in the text. Raw data were processed with Excel to extract peak mode, full width at half maximum (FWHM), and PDI, fitting a skewed bell-shaped function. Samples were analyzed in triplicate. Additionally, kcps was tracked as an indicator of sample concentration.33 For ζ-potential, diluted samples were placed in a disposable folded capillary cell and directly analyzed by the software.
UV-Vis spectroscopy (JASCO V550, JASCO Europe) was used to study complex formation, Langmuir isotherms, rebinding tests, and to estimate the specific surface area. Experimental details for sample preparation are provided in the text.
2.3 Synthetic procedures
Using the same experimental protocol, three formulations were tested (Table 1) to assess the impact of TEOS concentration on size: S1 (0.20 mM), S2 (0.16 mM), and S3 (0.12 mM). Products were dialyzed for 24 h in EtOH, then stored in sealed vials at room temperature. All syntheses were performed in triplicate.
| Solvent or reagent (mL) | S1 | S2 | S3 |
|---|---|---|---|
| EtOH | 6.2 | 6.3 | 6.4 |
| NH4OH | 0.13 | 0.13 | 0.13 |
| Water | 0.09 | 0.09 | 0.09 |
| TEOS | 0.44 | 0.36 | 0.27 |
| EtOH to dissolve TEOS | 3.1 | 3.1 | 3.2 |
The best APTES/TMPMA ratio was selected based on nanoparticle size. The formulation was further optimized to find the best balance between monomers and core nanoparticles concentrations. Solvent composition was adjusted to prevent premature monomer hydrolysis, using 1.5 mL water and 4.5 mL EtOH. 30 mg of nanoparticles were used, with monomer concentrations ranging from 0.7 mM to 2.1 mM (0.14 μmol mg−1 to 0.36 μmol mg−1). The lower concentration was selected after screening.
30 mg of functionalized nanoparticles from three batches were diluted in 50 μL of PBS, followed by the addition of 450 μL of STREP solution (200 μg mL−1 in PBS). The final STREP-to-nanoparticle ratio was 3 μg mg−1. The mixture was incubated at 75 °C for 5, 10, 20, and 30 min, then centrifuged for 5 min at 13.3 krpm. Supernatants were collected for UV-Vis analysis. Control experiments included functionalized nanoparticles in PBS and a STREP solution without nanoparticles, incubated under the same conditions. The residual STREP concentration was monitored over time to calculate the amount immobilized on the nanoparticles. Data were analyzed upon a calibration curve generated with STREP concentrations ranging from 7.0 μg mL−1 to 240 μg mL−1 in PBS, with UV-Vis spectra acquired between 220 and 350 nm and absorbance monitored at 280 nm.
Tests were performed in triplicate on three batches of functionalized nanoparticles (9 samples per timepoint). Pellets from samples incubated for 30 min were resuspended in PBS and analyzed by DLS.
5 mg of functionalized nanoparticles in water suspension (1 mg mL−1) was added to a mixture of 4 mL EtOH and 1 mL 1% SDS solution (w/v). The mixture was stirred and heated to 75 °C. Once at temperature, a fixed volume of a monomer mixture (2-HEMA, DMAEA, MMA, and TRIM, molar ratio 1![[thin space (1/6-em)]](https://www.rsc.org/images/entities/char_2009.gif) :1:1:2) dissolved in EtOH was added. The concentrations in the monomer mixture were 60 mM for 2-HEMA, DMAEA, and MMA, and 120 mM for TRIM. Six different volumes of the monomer mixture were tested, resulting in a monomer-to-nanoparticle ratio ranging from 0.45 μmol mg−1 to 13.6 μmol mg−1 to study the effect on nanoparticle size. Nanoparticles were washed with an extraction solution (0.1% w/v of SDS, 0.1% v/v in CH3COOH, T = 45 °C, 30 min) then centrifuged (13.3 krpm for 15 min). The pellet was then recovered and washed twice with water.
:1:1:2) dissolved in EtOH was added. The concentrations in the monomer mixture were 60 mM for 2-HEMA, DMAEA, and MMA, and 120 mM for TRIM. Six different volumes of the monomer mixture were tested, resulting in a monomer-to-nanoparticle ratio ranging from 0.45 μmol mg−1 to 13.6 μmol mg−1 to study the effect on nanoparticle size. Nanoparticles were washed with an extraction solution (0.1% w/v of SDS, 0.1% v/v in CH3COOH, T = 45 °C, 30 min) then centrifuged (13.3 krpm for 15 min). The pellet was then recovered and washed twice with water.
Among the formulations tested, the monomer-to-nanoparticle ratio of 0.45 μmol mg−1 was chosen for subsequent characterizations.
2.4 Nanoparticle characteristics and performance
The specific surface area (As) of the nanoparticles was calculated using eqn (1):
 | (1) |
Equilibrium isotherms were studied to evaluate CS-sMI-NPs, selecting the system with the highest rebinding capacity. For the isotherms, 50 μg of CS-sMI-NPs or NIPs were mixed with 150 μL protein solutions, with concentrations in the range from 100 μg mL−1 to 200 μg mL−1, of STREP (target protein) or BSA (negative control) and incubated for 24 h at room temperature. After centrifugation (13.3 krpm for 5 minutes), the supernatants were analyzed by UV-Vis spectroscopy, monitoring absorbance at 280 nm for both proteins. Calibration curves for STREP and BSA were obtained in the range from 6 μg mL−1 to 16 μg mL−1. Tests were conducted in triplicate. Experimental data were fitted using the Langmuir model37 (eqn (2)):
 | (2) |
Additional characteristic parameters were calculated to quantify the system performance, including the Imprinting Factor (IF, eqn (3)) and the Relative Affinity (RA, eqn (4)):
 | (3) |
 | (4) |
2.5 QCM-D experiments
The QCM-D (E4 model, Q-Sense AB, Sweden) experiments were conducted using AT-cut quartz crystals with gold electrodes. The sensors (Biolin Scientific, Västra Frölunda, Sweden) had a fundamental resonance frequency (f0) of 5 MHz, an overall diameter of 14 mm, and a gold-coated active area with a diameter of 10 mm. Sensors were mounted in microfluidic chambers, and measurements were performed in stagnant mode at 25 °C.Before use, sensors were cleaned with oxygen plasma (Femto, Diener Electronic, Ebhausen, Germany) for 2 min at a power of 100 W, soaked in a 5:1:1 v/v/v solution of water, NH4OH, and H2O2 at 75 °C for 15 min, rinsed with water and isopropanol, dried under dry N2, and treated again with oxygen plasma for 2 min.
To modify the gold surface, an HS–PEG–COOH adlayer was formed via thiol–gold chemistry. Sensors, mounted in QCM-D chambers and pre-rinsed with water, were treated with an adlayer solution of HS–PEG–COOH (2 mg mL−1) and DTT (5 times the molar concentration of HS–PEG–COOH) in NaHCO3 (0.1 M) for 15 min, followed by a water rinse (5 min). This process exposed carboxylic functionalities for probe immobilization.
For nanoparticle immobilization, a solution containing nanoparticles (2 mg mL−1), EDCl, and NHS (50 mM each) in water was injected into the chambers. After 60 min, the sensors were rinsed with water (5 min). Fig. 1a shows the functionalization process, while Fig. 1b reports typical QCM-D traces.
 | ||
| Fig. 1 QCM-D characterization: (a) schematization of the sensor functionalization (not in scale); (b) characteristic traces of the whole experiment (events: (1) injection of the adlayer solution, (2) rinsing with water, (3) injection of the probe solution, (4) rinsing with water, (5) injection of the sample solution, (6) rinsing with water). | ||
After functionalization, sample solutions containing the protein of interest in PBS (STREP or BSA, 0.15 mg mL−1) were injected and incubated for 60 min. Finally, the sensors were rinsed with water (5 min).
2.6 Case study
The CS-MI-NPs system was tested for recognizing oenological tannins. Core/shell tannin-imprinted nanoparticles (CS-tMI-NPs) were prepared and tested using the same procedures as for CS-sMI-NPs but changing the template molecule. For CS-tMI-NPs, the mixture TVRG was used during synthesis. QCM-D tests were performed using TVRG (specific recognition), TVRS (competitive recognition), and TG (nonspecific adsorption) as analytes. The system used nanoparticles from S1 as the core, functionalized with 50/50 APTES/TMPMA mixture at 0.14 μmol mg−1, a template-to-nanoparticle ratio of 3 μg mg−1, and a monomer-to-nanoparticle ratio of 0.45 μmol mg−1. QCM-D sample concentration was 0.2 mg mL−1.2.7 Data analysis
In PCS and ζ-potential experiments, data are reported as the mean mode calculated from replicates. For technical replicates, results are expressed as the mean mode ± FWHM, while for independent experiments, data are reported as the mean mode ± SE. In nanoparticle growth kinetics, a single synthesis was monitored, with five samples taken per timepoint; data are the mean of these measurements, with error bars representing the data range.In UV-Vis measurements, data are reported as mean ± SD for technical replicates, or mean ± SE for independent experiments.
For QCM-D experiments, the apparatus recorded the resonance frequency shift (Δf) and energy dissipation (ΔD) for up to seven odd overtones, while only the 3rd to the 11th overtones were used for data analysis. The values of ΔFn = Δfn/n are reported. ΔFn and ΔDn were calculated as the difference between the baseline acquired at the start of each measurement step and the post-rinse signals. At least three experiments were performed for each condition, with ΔFn (Hz), ΔDn (dimensionless), and molecular density (molecules per cm2) continuously recorded. Results are presented as the mean of replicates (N), with error bars indicating the SE. The fundamental frequency (ΔF0) was excluded due to environmental noise sensitivity.38
The adhered sensor mass was evaluated using the Sauerbrey model (eqn (5)).39 The Sauerbrey equation is as follows:
| Δm = −C·ΔFn | (5) |
In this equation, Δm is the variation in sensor mass (ng cm−2), C is the mass sensitivity constant (17.7 ng cm−2 Hz−1 for quartz crystals with f0 = 5 MHz), n is the overtone number.
In this work, the Sauerbrey model was applied if at least one of the following three criteria was met: (1) minimal dependence of ΔFn on n, (2) ΔDn values below 2 × 10⁻⁶, (3) ΔDn/(−ΔFn) ≪ 4 × 10⁻⁷ Hz.40,41
The molecular density was calculated form the areal mass as follows (eqn (6)):
 | (6) |
In this equation, Mw is the molecular weight of the considered compound (g mol−1).
3 Results
3.1 Dimensional characterization
 | ||
| Fig. 2 Preliminary synthesis and core characterization: (a)–(c) size, scattering intensity and PDI respectively, measured during nanoparticle growth, (d)–(f) size, z-potential and PDI respectively, measured in the screening syntheses to determine the preferred TEOS concentration. In growth kinetics plots, three samples were withdrawn from the reactive mass and measured, thus reported error bars represent the range max/min. | ||
The study of TEOS concentration on nanoparticle size indicated that increasing concentrations resulted in larger Stöber nanoparticles (Fig. 2d): 22 ± 3 nm (0.12 M), 50 ± 3 nm (0.16 M), and 63 ± 3 nm (0.20 M). This trend appeared linear, enabling precise size tuning within this range. Conversely, ζ-potential decreased linearly with increasing TEOS concentration (Fig. 2e): −22.4 mV ± 5.4 mV (0.12 M), −33.0 mV ± 3.2 mV (0.16 M), and −38.3 mV ± 2.7 mV (0.20 M). The PDI (Fig. 2f) showed minimal variation across concentrations, with values of 0.21 ± 0.02 (0.12 M), 0.17 ± 0.03 (0.16 M), and 0.17 ± 0.01 (0.20 M). These results indicate high monomer conversion and homogeneous nanoparticle growth.
Based on this optimization, the reaction condition designated as S1 (see Table 1) was chosen for subsequent experiments.
 | ||
| Fig. 3 Measured size of functionalized nanoparticles in different screening tests: (a) effect of APTES/TMPMA molar ratios and (b) effect of the overall monomers-to-nanoparticle concentration. Data are the mean value of mode values calculated for three syntheses for each point, error bars represent the SE. The starting size of bare core nanoparticles was 35 nm ± 5 nm. Study of the STREP/nanoparticles complex formation and characterization of CS-sMI-NPs: (c) size of tested nanoparticles (core: bare Stöber from S1 synthesis; functionalized: core nanoparticles functionalized with a APTES/TMPMA ratio of 50/50 and monomer-to-nanoparticle concentration of 0.16 μmol mg−1; complex: STREP/nanoparticle complex after 30 min of incubation in the protein solution; Ctrl: functionalized nanoparticles incubated in PBS), UV-Vis measurements of (d) supernatant collected from the incubation solution; (e) differential concentration normalized over the amount of functionalized nanoparticles; (f) size of CS-sMI-NPs by varying the monomers concentration in the reaction. | ||
In the additional study, after setting the APTES/TMPMA ratio, monomer-to-nanoparticle concentrations ranged from 0.14 μmol mg−1 to 0.36 μmol mg−1 (Fig. 3b). Functionalization with 0.14 μmol mg−1 yielded nanoparticles of 43 nm ± 9 nm, which was excluded. Higher concentrations resulted in sizes ranging from 60 nm to 200 nm. The formulation with 0.16 μmol mg−1 produced nanoparticles of 61 nm ± 9 nm, which was selected for further study.
The size of the complex STREP/nanoparticles (Fig. 3c) increased to 90 nm ± 14 nm, reflecting a 50% increase compared to the size of the functionalized nanoparticles. NIPs incubated with PBS did not show any change in size (61 nm ± 10 nm).
The concentration of STREP in the incubation solution decreased over time in samples containing the functionalized nanoparticles (Fig. 3d). In contrast, no decrease was observed in the control sample containing only STREP, confirming that high temperature and strong centrifugation did not affect the stability of the protein solution. The residual STREP concentration at the first checkpoint was 61% ± 6% in respect to the starting STREP amount and decreased to 54% ± 4% by the end of the test.
The amount of STREP retained by complexes normalized to the amount of nanoparticles in the samples (Fig. 3e) indicated that, at the end of the incubation, the STREP-to-nanoparticle ratio was approximately 2.7 μg mg−1 ± 0.3 μg mg−1.
 | ||
| Fig. 4 UV-Vis characterization of CS-sMI-NPs: (a) estimation of the specific surface As (eqn (1)) via methyl blue adsorption test as a function of the monomer-to nanoparticle ratio and the nanoparticle size (inset) compared to the value obtained for NIPs (gray), (b) amount of retained STREP normalized over the amount of nanoparticles as a function of the time in rebinding tests by varying the monomer-to-nanoparticle ratio; amount of retained (c) STREP and (d) BSA over the amount of nanoparticles at the equilibrium (24 h) measured after incubation with protein solutions with decreasing protein concentrations. | ||
The rebinding tests (Fig. 4b) revealed a strong dependency of STREP binding capacity on nanoparticle synthesis and incubation time. The binding peaked at 40 minutes for the lowest monomer concentration before stabilizing. At the monomer concentration of 0.91 μmol mL−1, binding efficiency improved, with the highest value recorded at the earliest time point (0.30 mg mg−1) followed by minor fluctuations. Intermediate monomer concentrations (2.27, 4.55, and 9.09 μmol mL−1) produced moderate binding levels.
Isotherm tests confirmed the dependence of STREP binding on protein concentration and highlighted significant differences between CS-sMI-NPs and NIPs. While NIPs exhibited lower binding and higher variability, CS-sMI-NPs retained 34% to 37% of STREP, compared to only 6% to 12% for Ctrl. Tests with BSA revealed nonspecific adsorption for both nanoparticle types, with no trends related to protein concentration or nanoparticle formulation.
Equilibrium isotherms further emphasized the superior performance of CS-sMI-NPs. The maximum adsorption capacity (Qm) for STREP was 5.60 mg mg−1 in CS-sMI-NPs, significantly higher than 2.11 mg mg−1 for Ctrl. However, the Langmuir constant (KL), indicative of binding affinity, was relatively low for STREP (0.26 mL mg−1), suggesting limited interaction strength despite the high density of binding sites. For BSA, a higher KL (2.26 mL mg−1) combined with a lower Qm (0.30 mg mg−1) reflected nonspecific interactions likely driven by the affinity of BSA toward the polymer matrix.42
The imprinting factor (IF) and the relative adsorption affinity (RA) for STREP resulted 2.65 and 1.44 respectively (Table 2). These parameters were not calculated for BSA due to poor fitting. The CS-sMI-NPs retained approximately 36% of STREP, independent of protein concentration, while BSA retention was around 14%. In NIPs, STREP adsorption was limited to 8%, and BSA exhibited a linear decrease from 51% to 13%, indicating surface saturation from nonspecific binding (Fig. 5).
 | ||
Fig. 5 Isotherm adsorption and Langmuir model: experimental data of Qe vs. protein concentration (○), Langmuir fitting ( ), and calculated parameters. ), and calculated parameters. | ||
3.2 QCM-D experiments
 | ||
| Fig. 6 QCM-D results related to sensor functionalization: (a) ΔFn and (b) ΔDn measured after the formation of the adlayer, (c) Δm calculated for the adlayer by using the Sauerbrey equation (eqn (5)), (d) ΔFn and (e) ΔDn measured after the immobilization of the nanoparticle probes, (f) normalized ΔFn measured after the probe immobilization over the ΔFn measured after the adlayer immobilization. N indicates the number of tested sensors. | ||
The ΔFn values measured for the immobilization of both probes were negative (Fig. 6d), indicating successful immobilization. The measured ΔFn values for CS-sMI-NPs and NIPs did not show a dependency on n (Shapiro–Wilk, p-value > 0.05 for both groups, one-way ANOVA p-value = 0.99 and 0.37 respectively). The measured ΔDn values after probe immobilization were close to zero in all cases (Fig. 6e). The lack of dependency of ΔFn on n and the low values of ΔDn allowed excluding significant effects due to the viscoelasticity of the whole functionalization.
The ΔFn signals obtained for the probes were normalized with respect to the ΔFn signals obtained for the adlayer (Fig. 6f). The values obtained for CS-sMI-NPs were slightly higher compared to those obtained for NIPs, but with no statistically significant differences (t-test).
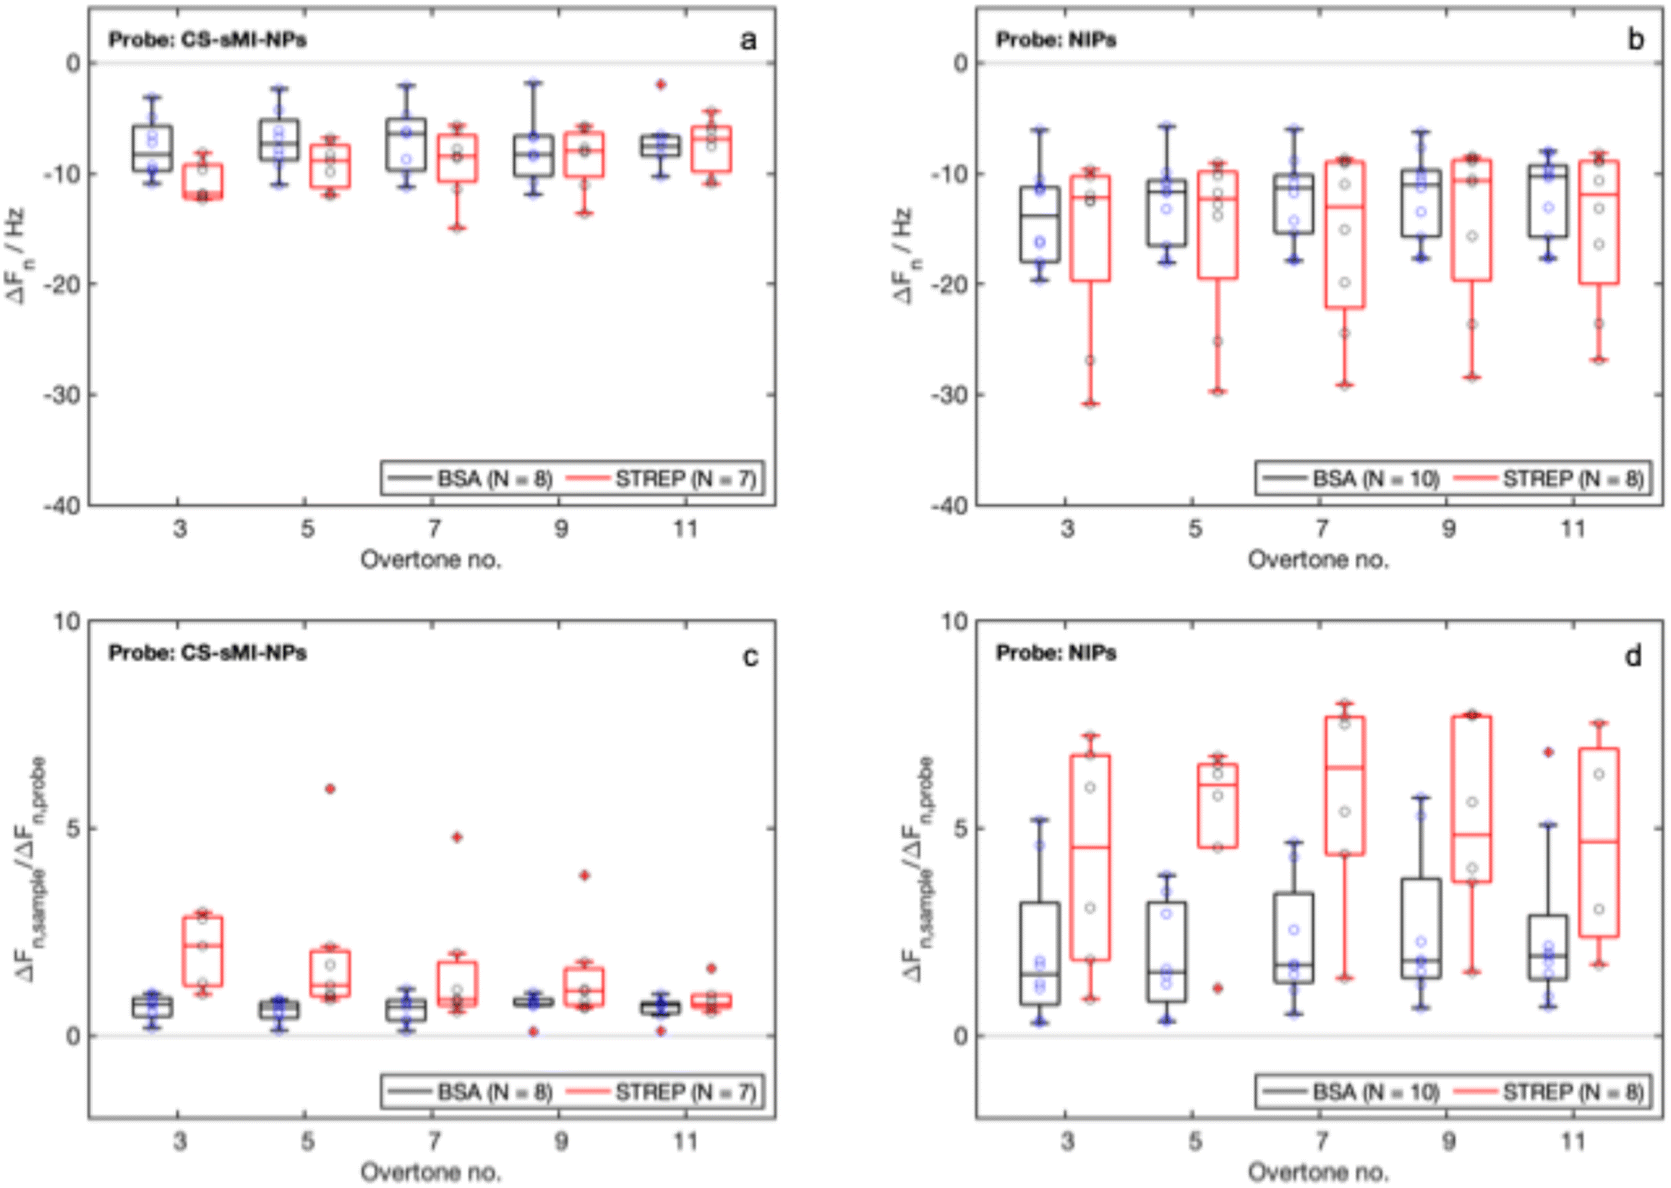 | ||
| Fig. 7 QCM-D experiments, detection of the samples: (a) and (b) ΔFn measured for CS-sMI-NPs and NIPs after the detection of the reference protein (STREP, specific signal) and the control protein (BSA, nonspecific signal), (c) and (d) normalized ΔFn in respect to the values of ΔFn measured for probe immobilization for CS-sMI-NPs and NIPs. N indicates the number of tested sensors. | ||
The median ΔFn values measured after the detection did not show any dependency on n. Moreover, while the NIPs exhibited poor repeatability and high variability in their signals, the CS-sMI-NPs demonstrated more consistent and less variable responses. We detected a statistically relevant difference in the detection of BSA by the two systems (t-test, p-value < 0.05). No statistical differences were highlighted in the detection of STREP but a slight increase in absolute signal intensity was observed.
Normalized signals from detections against those measured in probe conjugation indicated that while the NIPs exhibited increased variability and poor reproducibility, the CS-sMI-NPs system maintained a stable nonspecific signal with BSA, which remained consistently lower than that obtained in STREP detection. Statistically significant differences were obtained only in the normalized signals obtained with CS-sMI-NPs (t-test, p-values < 0.05).
3.3 The case study
The characterization of the surface-imprinted nanoparticles toward tannins (CS-tMI-NPs) confirmed the promising performance of the tested system. Complexes between the template and the functionalized nanoparticles resulted 112 nm ± 31 nm, while the core/shell nanoparticles resulted 165 nm ± 31 nm. Both size measurements were in line with those obtained for the CS-sMI-NPs. Also the QCM-D results obtained from the new set of experiments for the adlayer (Fig. 8a) and probe (Fig. 8b) immobilization did not significantly vary compared to the previous set. Results from sample detection with CS-tMI-NPs-functionalized sensors (Fig. 8c) indicated higher binding for the template mixture (TVRG), lower binding for the mixture of different tannins (TG), and an intermediate behavior for the mixture containing proanthocyanidins and ellagitannins (TVRS). In contrast, NIPs (Fig. 8d) exhibited no differences between TVRG and TVRS detection and showed very limited adsorption of TG.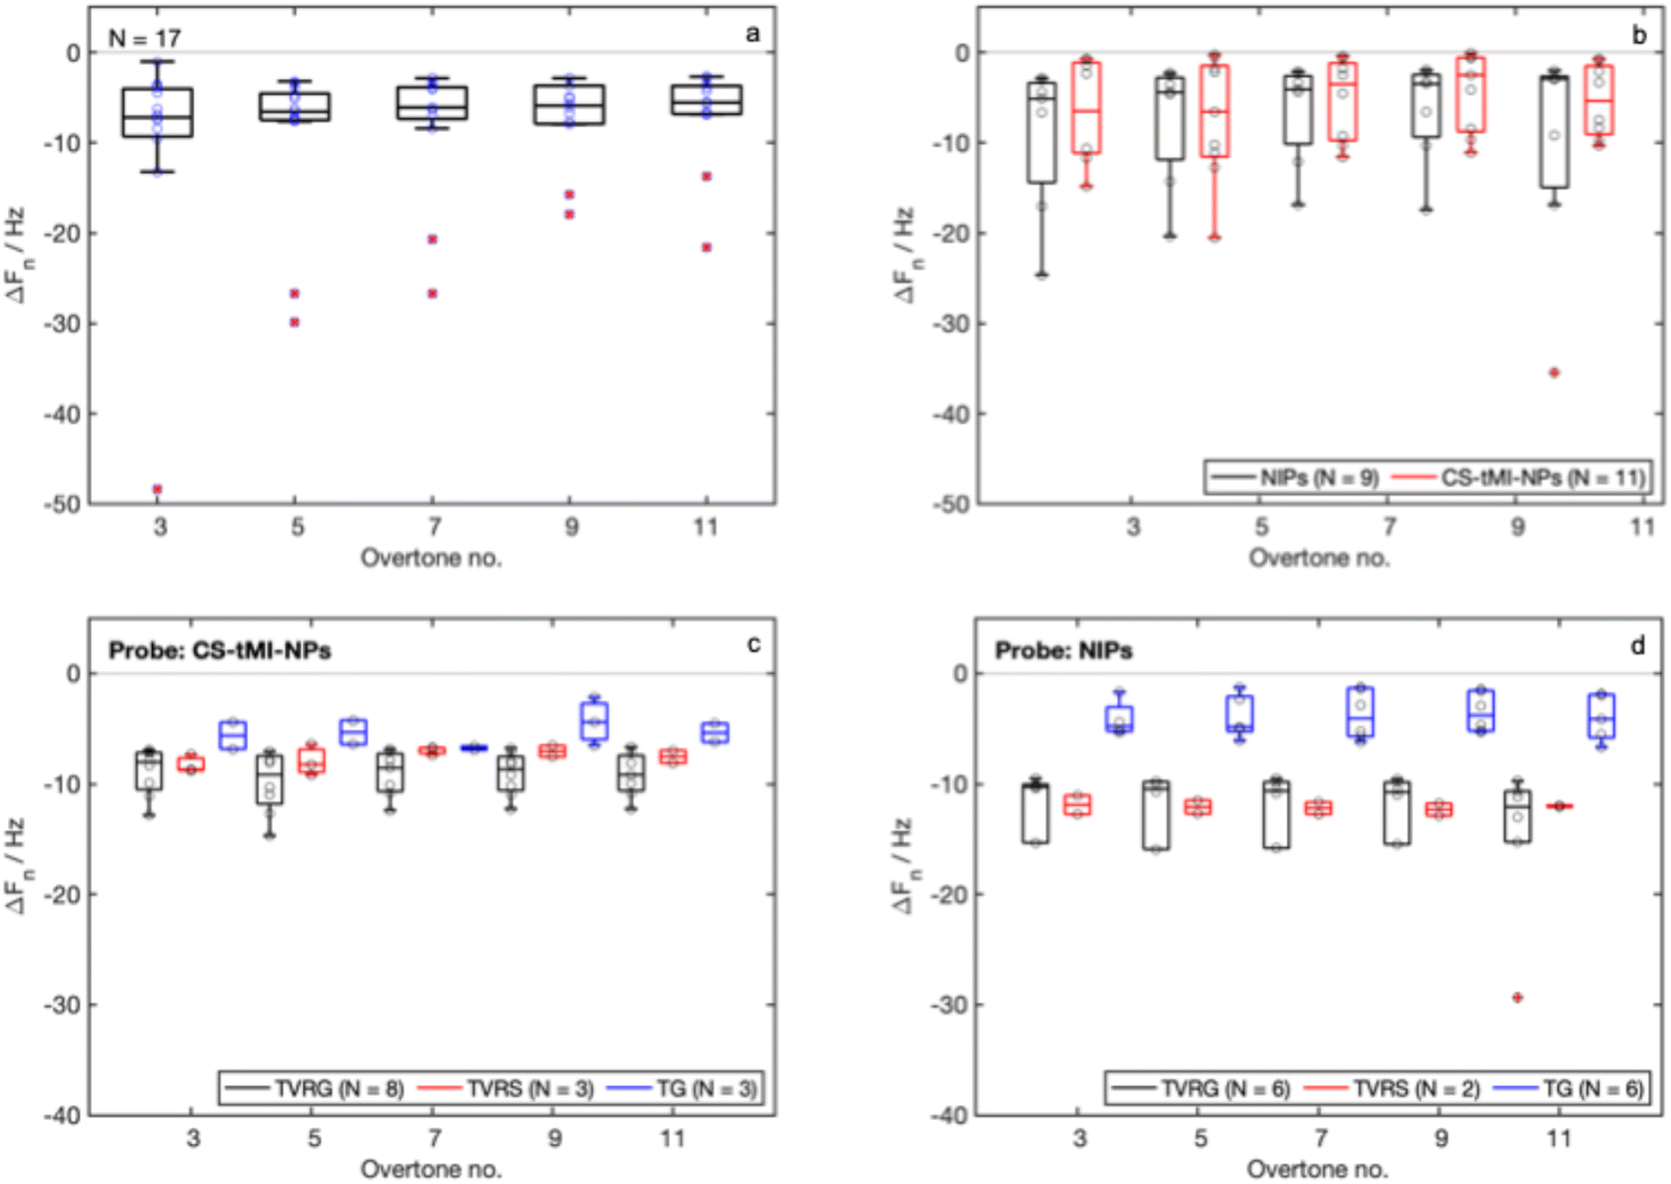 | ||
| Fig. 8 QCM-D results related to the case study: (a) ΔFn measured after the adlayer formation; (b) ΔFn measured after the immobilization of the CS-tMI-NPs and NIPs; (c) and (d) ΔFn measured after the detection of three samples, TVRG (specific), TVRS (competitive) and TG (nonspecific) for CS-tMI-NPs and NIPs. N indicates the number of tested sensors. | ||
4 Discussion
Optimized core synthesis ensured high monomer conversion and consistent particle sizes, with TEOS concentration enabling tunable nanoparticle dimensions from 22 nm to 63 nm. The negative shift in ζ-potential with increasing TEOS concentration highlights the role of deprotonated silanol groups in surface charge modulation.44Functionalization tests revealed that higher APTES-to-TMPMA ratios increased nanoparticle size, while elevated TMPMA concentrations inhibited surface functionalization. Formation of STREP/nanoparticle complexes was confirmed by size increases and UV-Vis analysis, indicating efficient protein binding driven by electrostatic interactions between negatively charged STREP at pH 7.4,45 and the positively charged amine groups on the nanoparticles. The final bound STREP-to-nanoparticle ratio was 2.7 μg mg−1. Molecular imprinting increased the specific surface area by 260–270%, providing an enhanced target accessibility. CS-sMI-NPs demonstrated higher STREP retention (34–37%) compared to non-imprinted controls (6–12%), as confirmed by Langmuir modeling, underscoring the creation of specific binding sites despite relatively low affinity. The observed increase in specific surface area in the imprinted nanoparticles is not an independent variable, but a direct consequence of the molecular imprinting process itself. The formation of template-specific cavities at the nanoparticle surface leads to a structured, accessible polymer layer, which inherently increases the total surface area while enabling specific interactions. Therefore, the enhanced protein retention observed in CS-MI-NPs compared to NIP particles should not be attributed to surface area alone, but rather to the molecularly defined binding sites that simultaneously increase the surface and confer selectivity. This interpretation is further supported by the low and unspecific adsorption observed with BSA and the higher retention and affinity parameters measured for the target protein.
QCM-D results confirmed efficient adlayer formation and nanoparticle immobilization, with negative ΔFn and ΔDn values indicating a rigid, well-structured PEG layer stabilized by probe immobilization. During STREP detection, ΔFn normalized over probe immobilization was approximately 11 times higher than biotinylated PEG-functionalized sensors.43 CS-sMI-NPs showed higher specificity for STREP, while controls exhibited stronger nonspecific interactions with BSA, highlighting the selectivity introduced by molecular imprinting. CS-MI-NPs enabled STREP detection at 2.8 nM, comparable to other acoustic platforms such as Rayleigh Surface Acoustic Wave sensors with LoDs of 0.5 nM.46 The selection of streptavidin and tannins as target analytes was intentional to evaluate the versatility and robustness of the CS-MI-NPs system across distinct chemical and structural classes. Streptavidin, a globular and well-characterized protein, represents a model analyte for biomedical applications, while tannins are highly heterogeneous polyphenolic compounds relevant to food and environmental analysis. Their inclusion enabled the assessment of the imprinting platform in terms of specificity, adaptability, and performance in both protein-based and non-proteinaceous systems, thus demonstrating the broad applicability of the developed sensing approach.
For tannins, CS-tMI-NPs selectively distinguished between proanthocyanidins, ellagic, and gallic tannins despite some nonspecific affinity for proanthocyanidins. Based on the estimated average molecular weights of proanthocyanidins (5000 Da) and tannins (1500 Da),47 detection concentrations aligned with the capabilities of CS-tMI-NPs, which produced ΔFn values comparable to biologically derived probes.48,49 These results position CS-tMI-NPs as robust, synthetic alternatives for tannin detection in complex matrices.
5 Conclusion and perspectives
This research successfully developed and characterized core/shell nanoparticles (CS-MI-NPs) with potential for advanced biosensing applications. The systematic optimization of synthesis parameters and molecular imprinting demonstrated the versatility of these nanoparticles, achieving tailored properties with enhanced selectivity and performance. Future work will focus on refining functionalization techniques and expanding specificity by incorporating diverse molecular templates. Additionally, strategies such as surface modifications and inert blocking agents will be explored to minimize nonspecific binding. Testing in complex matrices, such as biological fluids or wine samples, will further assess their robustness under real-world conditions.While foundational performance has been established, challenges such as LoD calculation, long-term stability and resilience in practical settings still need to be addressed. Detecting streptavidin in diagnostic assays or tannins in commercial wine will validate their utility against interference from complex components like sugars and alcohols. Despite these limitations, CS-MI-NPs combine enhanced specific surface areas with tailored binding properties, making them a significant advancement in biosensing technology. Their compatibility with acoustic detection platforms and high selectivity underscore their potential for applications in diagnostics, environmental monitoring, and other real-world settings.
By addressing current challenges and optimizing performance in heterogeneous environments, CS-MI-NPs could pave the way for next-generation biosensors with superior sensitivity, selectivity, and versatility across diverse fields.
Data availability
The data generated in this study, as well as the computational codes used for analysis, are not yet publicly available. However, a comprehensive dataset, including all relevant data and scripts, is currently being prepared and will be made publicly accessible in the near future.Conflicts of interest
There are no conflicts of interest to declare.Acknowledgements
Funded by the European Union – Next Generation EU, Mission 4 Component 2 Inv. 1.5 CUP: B83C22003930001 (Tuscany Health Ecosystem, Spoke 4: Nanotechnologies for Diagnosis and Therapy) and Regione Toscana, Bando Ricerca Salute 2018, “The Omics Sciences against Osteosarcoma – TOSCANO” CUP: B54I20002750002.References
- H. Zhang, Adv. Mater., 2020, 32, 1806328 Search PubMed.
- M. Gagliardi, Adv. Ind. Eng. Polym. Res., 2023, 6, 396–406 CAS.
- J. Xu, H. Miao, J. Wang and G. Pan, Small, 2020, 16, 1906644 CrossRef CAS PubMed.
- W. Zhang, Y. Zhang, R. Wang, P. Zhang, Y. Zhang, E. Randell and Q. Jia, Anal. Chim. Acta, 2022, 1234, 340319 CrossRef CAS PubMed.
- K. Haupt and K. Mosbach, Chem. Rev., 2000, 100, 2495–2504 Search PubMed.
- S. Bahrani, E. S. Behbahani, M. Ghaedi, Y. A. Miandeh and A. Asfaram, Microchem. J., 2024, 110888 CrossRef CAS.
- A. M. Mostafa, S. J. Barton, S. P. Wren and J. Barker, TrAC, Trends Anal. Chem., 2021, 144, 116431 CrossRef CAS.
- M. Drobysh, V. Ratautaite, E. Brazys, A. Ramanaviciene and A. Ramanavicius, Biosens. Bioelectron., 2024, 251, 116043 CrossRef CAS PubMed.
- Y. Li, L. Luo, Y. Kong, S. George, Y. Li, X. Guo and B. Li, Adv. Funct. Mater., 2024, 2316865 CrossRef CAS.
- N. Nawaz, N. K. A. Bakar, H. N. M. E. Mahmud and N. S. Jamaludin, Anal. Biochem., 2021, 630, 114328 CrossRef CAS PubMed.
- Y. Hua, Y. Ahmadi and K. H. Kim, Environ. Pollut., 2022, 311, 119931 CrossRef CAS PubMed.
- T. Wasilewski, S. Orbay, N. F. Brito, K. Sikora, A. C. A. Melo, M. E. Melendez and J. Gębicki, TrAC, Trends Anal. Chem., 2024, 117783 CrossRef CAS.
- B. Tse Sum Bui, A. Mier and K. Haupt, Small, 2023, 19, 2206453 Search PubMed.
- M. Mabrouk, S. F. Hammad, A. A. Abdella and F. R. Mansour, Microchem. J., 2023, 109152 CrossRef CAS.
- H. R. Culver and N. A. Peppas, Chem. Mater., 2017, 29, 5753–5761 CrossRef CAS PubMed.
- C. J. Tan and Y. W. Tong, Anal. Bioanal. Chem., 2007, 389, 369–376 CrossRef CAS.
- C. Dong, H. Shi, Y. Han, Y. Yang, R. Wang and J. Men, Eur. Polym. J., 2021, 145, 110231 CrossRef CAS.
- M. Pan, L. Hong, X. Xie, K. Liu, J. Yang and S. Wang, Macromol. Chem. Phys., 2021, 222, 2000222 CrossRef CAS.
- T. Matsunaga, T. Hishiya and T. Takeuchi, Anal. Lett., 2007, 40, 2633–2640 CrossRef CAS.
- A. Mueller, Molecules, 2021, 26, 5139 CrossRef CAS PubMed.
- G. Wulff and J. Liu, Acc. Chem. Res., 2012, 45, 239–247 CrossRef CAS.
- N. V. Phan, H. F. Sussitz and P. A. Lieberzeit, Biosensors, 2014, 4, 161–171 CrossRef.
- A. N. Hasanah, N. Safitri, A. Zulfa, N. Neli and D. Rahayu, Molecules, 2021, 26, 5612 CrossRef CAS PubMed.
- M. Niu, C. Pham-Huy and H. He, Microchim. Acta, 2016, 183, 2677–2695 CrossRef CAS.
- M. Gagliardi, M. Agostini, F. Lunardelli, L. Lamanna, A. Miranda, A. Bazzichi and M. Cecchini, Sens. Actuators, B, 2023, 379, 133299 Search PubMed.
- M. Gagliardi, M. Agostini, F. Lunardelli, A. Miranda, A. G. Luminare, F. Cervelli and M. Cecchini, Biosensors, 2022, 12, 1010 CrossRef CAS PubMed.
- M. Gagliardi, L. Colagiorgio and M. Cecchini, Biosensors, 2023, 13, 607 CrossRef CAS PubMed.
- M. Agostini, F. Lunardelli, M. Gagliardi, A. Miranda, L. Lamanna, A. G. Luminare and M. Cecchini, Adv. Funct. Mater., 2022, 32, 2201958 CrossRef CAS.
- A. Yarman, S. Kurbanoglu, I. Zebger and F. W. Scheller, Sens. Actuators, B, 2021, 330, 129369 CrossRef CAS.
- S. Akgönüllü, S. Kılıç, C. Esen and A. Denizli, Polymers, 2023, 15, 629 CrossRef PubMed.
- I. LariMojarad, M. Mousavi, M. M. Moeini Manesh, M. Bouloorchi Tabalvandani, M. Badieirostami and M. A. Janjua, ACS Omega, 2024, 9, 16026–16034 Search PubMed.
- V. Kumar and W. Kutner, Chem. Eng. J., 2024, 155828 Search PubMed.
- J. Shang and X. Gao, Chem. Soc. Rev., 2014, 43, 7267–7278 RSC.
- A. A. Vasilyeva, R. A. Buribaev, M. V. Gorbunova, V. V. Apyari, I. I. Torocheshnikova and S. G. Dmitrienko, TrAC, Trends Anal. Chem., 2024, 117538 Search PubMed.
- M. Włoch and J. Datta, Compr. Anal. Chem., 2019, 86, 17–40 Search PubMed.
- J. O. Amode, J. H. Santos, Z. Md. Alam, A. H. Mirza and C. C. Mei, Int. J. Ind. Chem., 2016, 7, 333–345 CrossRef CAS.
- A. Acharya, G. Jeppu, C. Raju, B. Prabhu and A. Girish, Langmuir, 2023, 39, 17862–17878 CrossRef CAS PubMed.
- A. K. Dutta and G. Belfort, Langmuir, 2007, 23, 3088–3094 Search PubMed.
- G. Sauerbrey, Z. Phys., 1959, 155, 206–212 Search PubMed.
- I. Reviakine, D. Johannsmann and R. P. Richter, Langmuir, 2011, 27, 8838–8848 Search PubMed.
- B. D. Vogt, E. K. Lin, W. L. Wu and C. C. White, J. Phys. Chem. B, 2004, 108, 12685–12690 Search PubMed.
- S. Mushtaq, M. A. Abbas, H. Nasir, A. Mahmood, M. Iqbal, H. A. Janjua and N. M. Ahmad, Sci. Rep., 2023, 13, 4572 CrossRef CAS PubMed.
- S. Dutta, M. Gagliardi, L. Bellucci, M. Agostini, S. Corni, M. Cecchini and G. Brancolini, Front. Mol. Biosci., 2022, 9, 1006525 CrossRef CAS PubMed.
- B. M. Lowe, C. K. Skylaris and N. G. Green, J. Colloid Interface Sci., 2015, 451, 231–244 CrossRef CAS PubMed.
- A. A. Choi and K. Xu, J. Am. Chem. Soc., 2024, 146, 10973–10978 CrossRef CAS PubMed.
- M. Agostini, G. Greco and M. Cecchini, Sens. Actuators, B, 2018, 254, 1–7 Search PubMed.
- J. M. McRae, N. Kirby, H. D. Mertens, S. Kassara and P. A. Smith, J. Agric. Food Chem., 2014, 62, 7216–7224 CrossRef CAS PubMed.
- M. Gagliardi, G. Tori, M. Agostini, F. Lunardelli, F. Mencarelli, C. Sanmartin and M. Cecchini, Nanomaterials, 2022, 12, 166 Search PubMed.
- M. Gagliardi, G. Tori, C. Sanmartin and M. Cecchini, J. Sci. Food Agric., 2025, 105, 1476–1483 CrossRef CAS PubMed.
| This journal is © The Royal Society of Chemistry 2025 |