
 Open Access Article
 This Open Access Article is licensed under a
 Creative Commons Attribution 3.0 Unported Licence
Deciphering the electrochemical kinetics of sulfur vacancy-assisted nitrogen-doped NiCo2S4 combined with sulfur-doped g-C3N4 towards supercapacitor applications†
Soumyashree
Pany
,
Amtul
Nashim‡
,
Ritik
Mohanty‡
 and
Kulamani
Parida
*
and
Kulamani
Parida
*
Centre for Nano Science and Nano Technology, Institute of Technical Education and Research, Siksha ‘O’ Anusandhan (Deemed to be University), Bhubaneswar, 751019, India. E-mail: kulamaniparida@soa.ac.in; paridakulamani@yahoo.com
First published on 28th January 2025
Abstract
In this work, an ion exchange-mediated sulfidation technique was adopted for the fabrication of a sulfur vacancy-assisted N-NiCo2S4/S-g-C3N4 nanocomposite (abbreviated as S′N-NCS/S-g-CN). The synergistic integration of S′N-NCS and S-g-CN, its impact on electrochemical capacitive performance and the charge storage mechanism of the nanocomposite were investigated via the power law as well as the Dunn and Trasatti methods. The S′N-NCS/S-g-CN nanocomposite offers the characteristic features of a battery-type electrode material. It delivers a specific capacity of 1034 C g−1 at 1 A g−1 in 2 M aqueous KOH electrolyte, and its performance significantly improved relative to pristine materials. Furthermore, it demonstrates excellent long-term cyclic stability performances and 94.1% capacitive retention after 10![[thin space (1/6-em)]](https://www.rsc.org/images/entities/char_2009.gif) 000 cycles. A completely altered charge storage mechanism was observed from the diffusion-controlled (S′N-NCS) to capacitive-controlled mechanism in the S′N-NCS/S-g-CN electrode. Furthermore, the presence of sulfur vacancies and incorporated g-C3N4 in the S′N-NCS/S-g-CN nanocomposite induces a higher diffusion coefficient value of 2.38 × 10⁻⁷ cm2 s−1 relative to S′N-NCS (i.e., 2.21 × 10⁻⁷ cm2 s−1) and has significant impacts on the performance and efficacy of the electrode material for capacitive performances. This study reveals the energy storage performance of the compositionally engineered S′N-NCS/S-g-CN material in terms of sulfur vacancies, electrochemical kinetics, and the charge storage mechanism.
000 cycles. A completely altered charge storage mechanism was observed from the diffusion-controlled (S′N-NCS) to capacitive-controlled mechanism in the S′N-NCS/S-g-CN electrode. Furthermore, the presence of sulfur vacancies and incorporated g-C3N4 in the S′N-NCS/S-g-CN nanocomposite induces a higher diffusion coefficient value of 2.38 × 10⁻⁷ cm2 s−1 relative to S′N-NCS (i.e., 2.21 × 10⁻⁷ cm2 s−1) and has significant impacts on the performance and efficacy of the electrode material for capacitive performances. This study reveals the energy storage performance of the compositionally engineered S′N-NCS/S-g-CN material in terms of sulfur vacancies, electrochemical kinetics, and the charge storage mechanism.
1. Introduction
Population growth, industrialization, and higher living standards have increased fossil fuel consumption and environmental issues, and this has shifted research focus to zero emissions and adoption of renewable energy resources to mitigate the energy and environmental issues. Renewable sources such as wind, water, and tidal power are promising but intermittent, highlighting the need for high-performance, low-cost energy storage devices.1,2 In this regard, electrochemical energy storage systems are vital. Among them, supercapacitors are notable for their low cost, fast charge–discharge rates, high power density, and long cyclic stability compared to conventional capacitors.3,4 However, further assessment of the practical application of supercapacitors is highly impeded by their energy density in comparison to batteries. Therefore, simultaneously pursuing improvement in energy density, high specific capacitance and power density as well as a wider potential window of the electrode material is often considered a holy grail approach for supercapacitors. Among various electrode materials, transition metal oxides have been widely investigated and intensively studied for supercapacitor application because of their high theoretical capacitance, low cost and nontoxic nature.5,6 However, the foremost bottleneck is poor intrinsic electrical conductivity, which restricts electron transport and results in low-rate performance and low stability, impeding the practical application of oxide-based electrode materials.7,8 Transition metal sulfide (TMS) has gained significant attention as a superior supercapacitor electrode material compared to transition metal oxide because of its remarkable electrochemical performances due to its excellent intrinsic electrical conductivity and high specific capacitance.9–11Among TMSs, NiCo2S4 has earned considerable research attention in the field of supercapacitors.9 However, the electrochemical performance of NiCo2S4 is still unsatisfactory as it is hindered by sluggish ion and electron transport as well as volume expansion during charge–discharge cycles, which increase resistance and disrupt particle contacts. Recently, to enhance intrinsic activity, the engineering of intrinsic defects has been considered a smart strategy to further develop a transition metal compound catalyst. Vacancy engineering emerged as an effective approach to improve the ion/electron transfer paths and ensure fast diffusion kinetics, leading to improvement in the energy storage capacity.12,13 As a kind of special intrinsic defect, anion vacancies have the ability to modify the electronic structure, induce to optimize the adsorption free energy of the catalyst, as well as improve the conductivity and active sites of the catalyst.14–16 It also acts as a negative charge centre, which attracts positive charge ions to accelerate the reaction kinetics and eventually enhance the electrochemical energy storage properties of the electrode material.15,17,18 In spite of the possible benefits of anionic vacancies, the ability to control vacancy concentration and adjust their distribution is one of the prime objectives for vacancy-assisted materials.15 These challenges have promoted researchers to develop compositionally engineered NiCo2S4 electrode materials.
In recent years, the integration of NiCo2S4 with a two-dimensional material (such as graphene, g-C3N4, Mxene, transition metal dichalcogenides) has gained significant attention, as it may enrich energy capabilities, as well as provide new opportunities to develop a potential electrode material for supercapacitor application.19,20 Among all, graphitic carbon nitride (g-C3N4) is analogous to graphene, owing to its interdisciplinary attention as a fascinating 2D material.21,22 The rich concentration of N in g-C3N4 provides a large number of active centres for faradaic reactions, and enhances the surface permeability property, enabling the wettability property of the material as a result of the charge carrier to be adsorbed, transmitted and diffused easily on the surface of the electrode. These properties make g-C3N4 unique, and enables g-C3N4 as a potential active substrate material for supercapacitor application. Moreover, g-C3N4 possesses excellent mechanical strength and structural flexibility properties, and these features significantly impact the long-term stability performance.23,24 However, the poor separation between the HOMO and LOMO of g-C3N4 causes quick annihilation of the electron and hole pair in the material, which effectively hinders the electrochemical performances and is considered as one of the major bottlenecks of g-C3N4.25 Thus, to overcome the conductivity issues of g-C3N4, it has been modified with various hetero atoms. However, the electrochemical performances are still not satisfactory.26–28 So, to augment the property of the material, synergistic integrations of g-C3N4 with other redox-active materials may significantly boost the energy storage performance, and establish it as an eminent electrode material.29,30 Earlier, Zhongchun Li et al. hydrothermally grew NiCo2S4 nanosheets on porous g-C3N4 nanosheets, which showed a specific capacity of 506 C g−1 at 1 A g−1.31 Similarly, Lu-Yin Lin et al. fabricated the NiCo2S4/S-doped g-C3N4 composite using thermal polymerization and hydrothermal reaction techniques, and it offers a specific capacity value of 351.0 F g−1 at 1 A g−1.32
Therefore, by taking inspiration from these concepts, we have fabricated a sulfur vacancy-assisted nitrogen-doped NiCo2S4/S-g-CN [S′N-NCS/S-g-CN] nanocomposite, which synergistically provides conductivity, increases active sites, promotes ion diffusion, suppresses volume expansion, and enhances the structural stability property. Collectively, these properties have a significant impact over the supercapacitor performances. Herein, by using the solvothermal technique for the first time, we have prepared the sulfur vacancy-assisted nitrogen-doped NCS/S-g-CN nanocomposite. Primarily, both pristine material NiCo2O4 and g-C3N4 were prepared through hydrothermal and calcination method. Later, upon solvothermal sulfidation process, both pristine materials form the sulfur vacancy-assisted N-NCS/S-g-CN nanocomposite. The physicochemical and morphological analysis strongly confirms the good integration of the sulfur vacancy-assisted N-NCS/S-g-CN (S′N-NCS/S-g-CN) nanocomposite, which delivers a specific capacity of 1034 C g−1 at 1 A g−1 in 2 M aqueous KOH electrolyte and excellent long term cyclic stability with 94.1% capacitive retention after 10000 cycles. The explored detailed electrochemical kinetics reveal that the S′N-NCS/S-g-CN nanocomposite is capacitively dominant in nature. However, S′N-NCS possesses a diffusion-controlled dominant charge storage mechanism. The dominant capacitive charge storage contribution in the S′N-NCS/S-g-CN electrode might be due to the integration of S′N-NCS with S-g-CN. The integration has an impact over the superior electronic conductivity, promoting the ion diffusion ability and increases the number of actives sites, suppresses the volume expansion of the material, and achieves facile charge carrier transport, which significantly increases the performance and stability of the electrode material. To the best of our knowledge, the proposed synthesis method and the observed result are unique and novel to the scientific community, and have not yet published. Owing to the remarkable electrochemical properties of the S′N-NCS/S-g-CN nanocomposite, this paper can pave a road map towards the design of this class of futuristic material not only in the field of supercapacitors, but also in the domain of HER, OER and electrochemical sensors.
2. Experimental section
2.1. Synthesis of g-C3N4 (g-CN)
In a typical synthesis process, 10 g urea (Merck) was taken in an alumina crucible. The crucible was semi-closed with a lid, and subjected to calcination for 2 h at 600 °C at a heating ramp of 15 °C min−1. The calcined product is abbreviated as g-CN.2.2. Synthesis of NiCo2O4 (NCO)
NiCo2O4 was prepared by adopting the same synthesis method, which was earlier reported by our group.33 In a typical synthesis process, NiNO3·6H2O (Aldrich, 99.0%) (2 mmol) and CoNO3·6H2O (Aldrich, 99.0%) (4 mmol) were dissolved in 70 mL of distilled water. Thereafter, 18 mmol of urea (Merck) was added to it. The above solution was stirred at normal room temperature to obtain a clear pink solution. Subsequently, the above solution was transferred to a Teflon-lined steel autoclave and subjected to a hydrothermal process at 110 °C for 10 h. After cooling, the sample was collected, and simultaneously washed with water and ethanol, followed by drying at 80 °C for 12 h. The dried powder was collected and calcined at 450 °C for 2 h at a heating ramp of 10 °C per minute. The formed product is abbreviated as NCO.2.3. Sulfidation of NiCo2O4 (S′N-NCS)
For the sulfidation process, 63.2 mg of NCO was taken and dispersed in 40 mL of ethanol and sonicated for 10 min. Then, to the suspension, 0.158 gm of thioacetamide (TAA) was added and sonicated for 20 minutes, and sealed in a 50 mL Teflon-lined steel autoclave at 160 °C for 6 h. The Teflon was allowed to cool naturally. Then, the product was washed and collected through centrifugation and dried at 80 °C for 12 h. The dried product was abbreviated as S′N-NCS (Sulfur vacancy-assisted nitrogen-doped NiCO2S4).2.4. Sulfidation of NiCO2O4/g-C3N4 (S′N-NCS/S-g-CN)
Prior to the reaction, 63.2 mg of NCO and 31.64 mg of g-CN was taken and dispersed in 40 mL of ethanol and sonicated for 10 min. Then, to the suspension, 0.158 gm of thioacetamide (TAA) was added and sonicated for 20 minutes, and sealed in a 50 mL Teflon-lined steel autoclave at 160 °C for 6 h. The Teflon was allowed to cool naturally. Then, the product was washed and collected through centrifugation and dried at 80 °C for 12 h. The detailed synthesis process is schematically represented in Scheme 1. The as-prepared compositional engineered material was abbreviated as S′N-NCS/S-g-CN (Sulfur vacancy-assisted nitrogen-doped NiCo2S4/S doped g-C3N4 composite).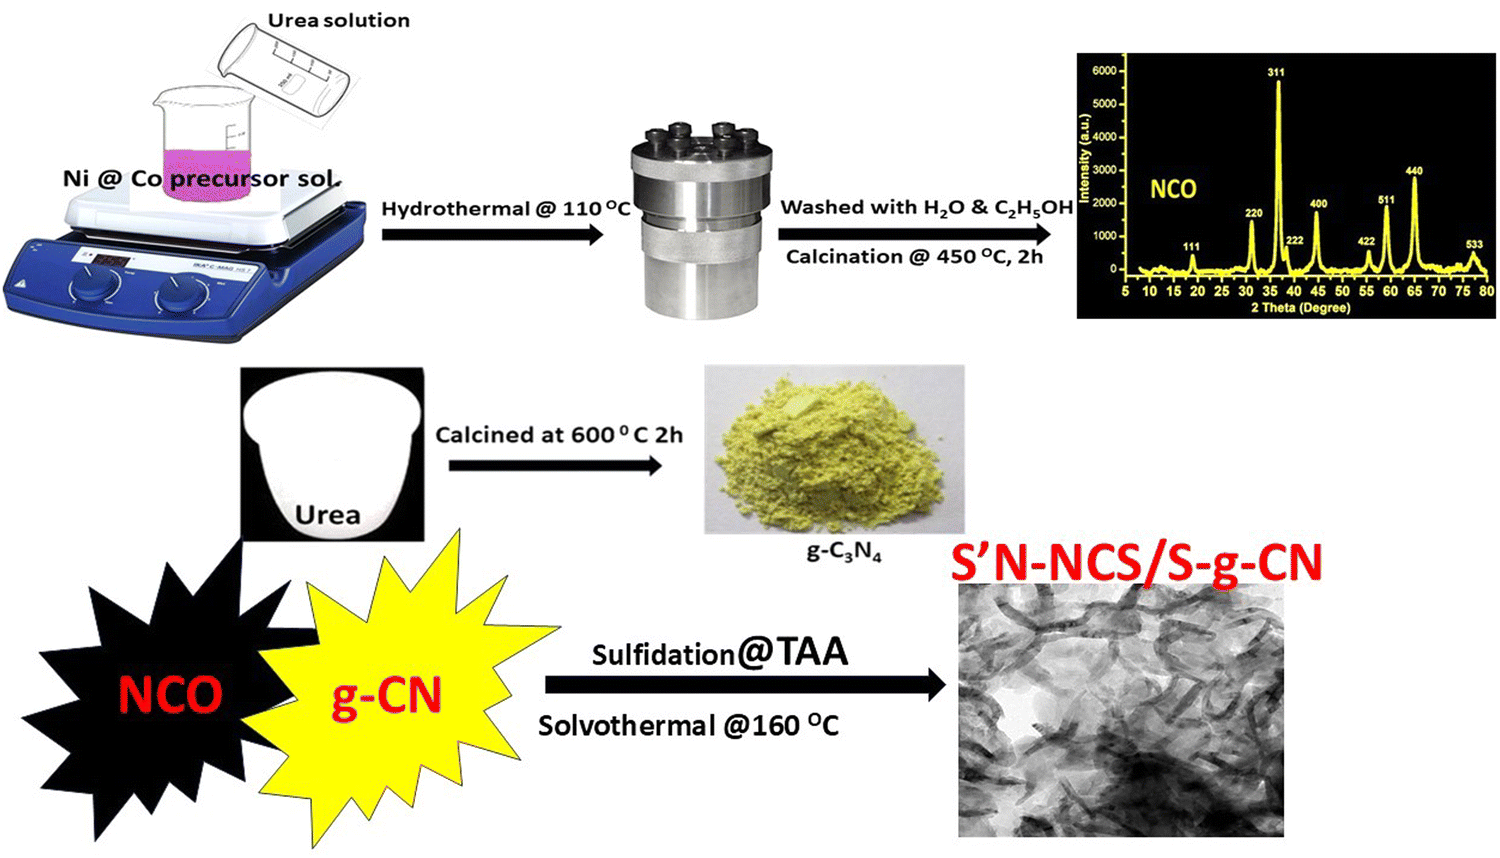 | ||
| Scheme 1 Synthesis process of the S′N-NCS/S-g-CN nanocomposite. | ||
2.5. Sulfidation of g-C3N4 (S-g-CN)
Sulfidation of g-C3N4 (abbreviated as S-g-CN) has been carried out by adopting the same synthesis procedure followed for sulfidation of NiCO2O4/g-C3N4, by ignoring NCO and its weight.3. Characterizations
The synthesized electrode materials were characterized by X-ray diffraction (XRD), X-ray photoelectron spectroscopy (XPS), Fourier transform infrared spectroscopy (FTIR), Field emission scanning electron microscopy (FESEM) and high-resolution transmission electron microscopy (HRTEM). The PXRD patterns of all prepared materials (NCO, g-CN, S′N-NCS, S-g-CN, S′N-NCS/S-g-CN) were recorded on a Rigaku Miniflex powder diffractometer using Cu-Kα radiation within the 2θ range from 10° to 80° at a sweep rate of 0.01° sec−1. HRTEM images were obtained on a Tecnai G2, F30 operated at 300 kV. Prior to HRTEM analysis, samples were sonicated in ethanol for 30 minutes and then drop-dried on a copper grid-coated carbon film. XPS measurements were carried out on an Axis Supra ESCA system (Kratos Analytical, UK) equipped with monochromatic Al-Kα (1486.6eV). The C 1s peak at 284.9 eV was taken as the reference peak, and the main peaks were deconvoluted using Origin Pro 8 software by fitting curves with a Gaussian distribution function. FTIR spectra were measured on a JASCO FT/IR-4600 instrument. N2 adsorption–desorption isotherms were performed at liquid nitrogen temperature (77 K) on an ASAP-2020 (an automated surface area and porosity analyzer). Prior to analysis under vacuum conditions, the samples were degassed at 200 °C for 8 h. FESEM images were collected on a Carl Zeiss Model Supra 55 (Germany). Raman spectra were obtained using a Renishaw InVia Raman Microscope with laser excitation at 532 nm. Electrochemical measurements were carried out with a potentiostat/galvanostat (IVIUM-VERTEX).
3.1. Fabrication of the electrode for the electrochemical supercapacitor
The electrochemical measurements of all prepared samples (NCO, g-CN, S′N-NCS, S-g-CN, S′N-NCS/S-g-CN nanocomposite) were carried out using the three-electrode system at room temperature with aqueous 2 M KOH as the electrolyte. Electrochemical studies were carried out by performing cyclic voltammetry (CV) and galvanostatic charge discharge (GCD) techniques. For electrochemical studies, the electrode was fabricated by adopting the so-called “Latex” method. Primarily, the prepared materials were mixed with carbon black to ensure good conductivity and Nafion to enhance the elasticity property. Here, the weight ratio of the mixture was 80:16:4 for the as-prepared samples:carbon black:Nafion, respectively. In this mixture, ethanol is used as a solvent to prepare a viscous elastic paste. The as-obtained paste was deposited through drop-casting method onto a (1 × 1 cm2) piece of nickel foam. Then, the deposited nickel foam was dried at 80 °C for 12 h to evaporate the used solvent, and mechanically pressed at 10 MPa for 10 s using a hydraulic press. Prior to use, the nickel foam (as a current collector) was properly washed using HCl, distilled water and acetone separately for 10 minutes, and dried at 80 °C for 12 h. As a consequence of this hydraulic press, the applied slurry paste over the Ni foam thoroughly penetrated the pores of the nickel foam, helping to provide an excellent mechanical linkage and ensure a robust electrical contact. The modified nickel foam was used as a working electrode, whereas Pt wire and Hg/HgO were used as the counter and reference electrodes, respectively, in a three-electrode system. Herein, the working potential window is optimized at 0–0.6 V vs. Hg/HgO electrode. The mass deposited on the nickel foam is ∼2 mg.
3.2. Specific capacity calculation
The specific capacity has been calculated from the i–t curves obtained from the constant current charge discharge measurement using eqn (1).33 | (1) |
Here, Qs is the specific capacity (C g−1), I is the discharging current, Δt is the discharge time, and m is the mass of the active deposited material on the nickel foam.
The specific capacity (Qs) in terms of (F g−1) has been estimated using eqn (2).34
 | (2) |
4. Results and discussions
To identify the phase structure of the prepared materials (g-CN, S-g-CN, NCO, S′N-NCS, S′N-NCS/S-g-CN), a powdered X-ray diffraction study was performed and is represented in Fig. 1. The diffraction pattern observed for g-CN reveals two distinct peaks at 13.1° and at 27.3°. The diffraction peak observed at 13.1° is identified as the (100) crystal plane, and arises due to the periodic in-plane packing (d = 0.687 nm) of the tri-s-triazine units in the aromatic system.33 The strong peak appearing at 27.3° is identified as the (002) crystal plane, which corresponds to the long range interplanar stacking (d = 0.325 nm) of the aromatic systems. Notably, a similar diffraction pattern relative to g-CN has been observed for S-g-CN, suggesting the preservation of the g-CN structure. Moreover, a slight shift of the diffraction peak towards higher 2θ value and weakening of the diffraction peak intensity were observed in S-g-CN. The weakened intensity of the diffraction peak found for S-g-CN might be due to modification in the CN network, such as lattice distortion, decreasing distance of CN layers, reduction in the planar size of the layers, and a decrease in the crystallinity.23 The diffraction peaks observed for NCO appeared at 2θ values of 18.8°, 31.1°, 36.7°, 38.4°, 44.6°, 55.4°, 59.1°, 64.9°, and at 77.0°, corresponding to the (111), (220), (311), (222), (400), (422), (511), (440), and (533) crystal planes of the cubic-spinel NiCo2O4 phase (Code No. 20-0781), respectively.33 After sulfidation of NCO with the assistance of thioacetamide (S′N-NCS), a completely different diffraction pattern was found in comparison to NCO. The diffraction peaks are positioned at 2θ values of 16.3°, 26.8°, 31.6°, 38.3°, 50.4° and 55.3°, and are well indexed to the (111), (220), (311), (422) and (440) planes of the cubic phase of NiCo2S4 (Code No. 20-0782), respectively.35 Furthermore, in the S′N-NCS/S-g-CN nanocomposite, a diffraction peak that is similar to that of S′N-NCS and S-g-CN was found, suggesting the formation of S′N-NCS/S-g-CN. However, this peak is weaker in intensity than that of S′N-NCS and S-g-CN, suggesting the lower crystallinity and amorphous nature of S′N-NCS/S-g-CN. No other diffraction peak was found in NCO, S′N-NCS and in S′N-NCS/S-g-CN, suggesting the purity of the prepared materials. | ||
| Fig. 1 XRD patterns of the g-CN, S-g-CN, NCO, S′N-NCS, S′N-NCS/S-g-CN nanocomposites. | ||
The surface morphologies of all materials were evaluated by FESEM, where g-CN shows irregular flake-like structures (Fig. 2(a)). Furthermore, S′N-NCS displays pseudo-spherical or cylindrical particles (Fig. 2(b)). Fig. 2(c) confirms the quasi-three-dimensional structure, resulting from the close interaction of S′N-NCS and g-CN in the composite material. The elemental compositions of S′N-NCS and S′N-NCS/S-g-CN were qualitatively analyzed using the EDAX (Energy Dispersive X-ray spectroscopy) technique, and are presented in Fig. S1 (ESI†). This analysis revealed the distribution of individual components, including C, N, S, Ni, and Co, thereby strongly validating the successful formation of the material with appropriate ratios. Furthermore, HRTEM was used to gain insight into the internal morphology. The clear crumpled flake and sheet-like resemblance structure of g-CN is validated from Fig. 2(d), which occurs as a result of the thermal annealing process of melamine. In the post-sulfidation process, S′N-NCS (Fig. 2(e)) displays agglomerated spherical-like particles, and the HRTEM images presented in Fig. 2(f) confirm the sulfur vacancy from the distorted fringes. In the composite S′N-NCS/S-g-CN (Fig. 2(g)), the materials show a pharaohs snake (i.e., elongated and twisted structure). This particular structure has a high surface-to-volume ratio that directly contributes to enhancing the electrochemical performance, owing to the easy mass transportation and superb ion diffusion. This is due to the thin, crumpled sheet-like structure of g-CN providing a framework-like arrangement for S′N-NCS to grow, which creates branches from its origin and spreads towards S-g-CN. The intimate interaction between S′N-NCS and S-g-CN can be verified from Fig. 2(h), and the HRTEM image presented in Fig. 2(i) shows the d-spacing of the 0.164 nm attributed to the (440) planes of S′N-NCS. The close interaction shown in the S′N-NCS/S-g-CN structure gives rise to superb electrochemical performance, as demonstrated by the long-cyclic stability and high specific capacitance, offering a balanced energy storage ability. Furthermore, the polycrystallinity of S′N-NCS and S′N-NCS/S-g-CN is verified from the SAED (selected area electron diffraction) pattern shown in the insert of Fig. 2(f) and (i). The disorder fringes of the composite also clearly provide evidence of the vacancies present in S′N-NCS/S-g-CN, which show enhanced electrochemical performances.
 | ||
| Fig. 2 FESEM micrographs of (a) g-CN, (b) S′N-NCS, and (c) S′N-NCS/S-g-CN; (d) HRTEM micrograph for g-CN, (e) and (f) HRTEM micrographs for S′N-NCS, (g)–(i) HRTEM micrographs for S′N-NCS/S-g-CN. | ||
XPS measurements were performed to explore the surface chemical oxidation states of S′N-NCS, S′N-NCS/S-g-CN and S-g-CN. The survey scan spectra of S′N-NCS, S′N-NCS/S-g-CN and S-g-CN are represented in Fig. 3(a). The survey scan spectra of S′N-NCS, S′N-NCS/g-CN attest the existence of elements, like Ni, Co, N, O, C and S, as shown in Fig. 3, (B) and (C). As shown in Fig. 3b, (A) and (B), the Ni2p peak is split into two spin–orbit components, i.e., Ni2p3/2 and Ni2p1/2, for S′N-NCS and S′N-NCS/S-g-CN, respectively. Furthermore, each component is deconvoluted into two peaks, corresponding to the Ni3+ and Ni2+ states, along with their respective satellite peaks. The Ni-deconvoluted peaks for Ni2p3/2 appearing at the binding energies of 853.1eV and 856.9 eV indicate the presence of the Ni3+ and Ni2+ states, respectively, for S′N-NCS. Similarly, for the Ni2p1/2 peak appearing at the binding energy of 870.5 eV, this indicates the Ni3+ state and the peak at 874.3 eV denotes the Ni2+ states. Furthermore, the corresponding satellite peaks appearing at 861.9 eV and 880.5 eV correspond to Ni2p3/2 and Ni2p1/2, respectively. However, for S′N-NCS/S-g-CN, there is a slight shift in the binding energies of the Ni3+ and Ni2+ states from the corresponding S′N-NCS peaks. For S′N-NCS/S-g-CN, the Ni3+ peaks appeared at the binding energy values of 853.5 eV, 859.0 eV and 870.6 eV. Similarly, for Ni2+, the peaks appeared at 857.1 eV, 865.3 eV and 875.3 eV. From S′N-NCS to S′N-NCS/S-g-CN, there is a slight increase in the binding energies of the Ni3+ and Ni2+ states. This may be due to the strong interaction between S′N-NCS and S-g-CN. Similarly, Co can be deconvoluted into four peaks, along with two satellite peaks for both S′N-NCS and S′N-NCS/S-g-CN, i.e., 2p3/2 (778.5 eV and 781.3 eV) and 2p1/2 (793.6 eV and 797.5 eV) for S′N-NCS and for S′N-NCS/S-g-CN. The features for 2p3/2 (778.8 eV and 782.2 eV) and 2p1/2 (793.9 eV and 798.5 eV) correspond to the Co3+ and Co2+ states, respectively, as shown in Fig. 3c, (A) and (B). In the case of S′N-NCS/S-g-CN compared to S′N-NCS, an increase in the binding energy of Co3+ and Co2+ is observed as a result of the strong interaction between S′N-NCS and S-g-CN. Fig. 3d, (A), (B), and (C) represent the XPS peaks of N1s for S-g-CN, S′N-NCS and S′N-NCS/S-g-CN, respectively. The peaks present around the binding energy value of 398.7 eV and 400.5 eV may be due to (N–C![[double bond, length as m-dash]](https://www.rsc.org/images/entities/char_e001.gif) N) bonding in the aromatic ring system and the tertiary nitrogen N–(C)3 groups in the C–N network, respectively, for S-g-CN. However, for S′N-NCS, N1s peak is present at the binding energy value of 401.6 eV, which could be assigned to the metal–N bonding, suggesting the successful doping of N into S′N-NCS. The shifting of the N1s XPS peaks of S′N-NCS/S-g-CN may be reflective of the strong electronic interaction between S′N-NCS and S-g-CN, which is beneficial for the energy storage process. Fig. 3e, (A), (B), and (C) represent the XPS peaks of sulfur in S-g-CN, S′N-NCS and S′N-NCS/S-g-CN, respectively. The S2p XPS spectra of S′N-NCS are split into two main peaks, S2p3/2 (161.9 eV) and 2p1/2 (163.1 eV), and a satellite peak at the binding energy of 169.2 eV. The binding energy at 161.9 eV may be due to the sulfur vacancy (S2− in the low coordination state at the surface). The peak at 163.1 eV is attributed to the metal-sulfur bonds. There is a slight shift in the S2P3/2 and S2p1/2 peaks of the composite compared to S′N-NCS towards a lower binding energy (i.e., S2p3/2 at 161.6 eV and S2p1/2 at 162.8 eV), which may be due to a change in the environment during composite formation. The binding energy values found at 169.2 eV and 170.4 eV for S′N-NCS/S-g-CN may be due to the satellite peak and surface sulfur at some higher oxidation state, respectively. The deconvoluted peaks of S-g-CN are found at the binding energy values of 163.1 eV and 168.8 eV. The peak at 163.1 eV corresponds to the C–S bonds of S-g-CN, and the peak at 168.8 eV may be due to the presence of sulfur at a higher oxidation state. However, the corresponding C–S bond of S′N-NCS/S-g-CN is found at a binding energy value of 164.3 eV, which is higher than that of S-g-CN. This may be due to the change in the chemical environment of sulfur during composite formation. The binding energy values at around 284.8 eV, 286.8 eV and 288.1 eV represent the carbon XPS peaks of S-g-CN and S′N-NCS/S-g-CN, as shown in Fig. 3f, (A) and (B), for the sp2 hybridized carbon atom, carbon bonded to nitrogen (C–NH2 or CHN bonds), and tri-s-triazine unit (N–CN) bonds of the S-g-CN structure, respectively. Furthermore, the XPS results of the as-prepared samples were well supported by FTIR (Fig. S2, ESI†) and Raman analysis (Fig. S3, ESI†).
N) bonding in the aromatic ring system and the tertiary nitrogen N–(C)3 groups in the C–N network, respectively, for S-g-CN. However, for S′N-NCS, N1s peak is present at the binding energy value of 401.6 eV, which could be assigned to the metal–N bonding, suggesting the successful doping of N into S′N-NCS. The shifting of the N1s XPS peaks of S′N-NCS/S-g-CN may be reflective of the strong electronic interaction between S′N-NCS and S-g-CN, which is beneficial for the energy storage process. Fig. 3e, (A), (B), and (C) represent the XPS peaks of sulfur in S-g-CN, S′N-NCS and S′N-NCS/S-g-CN, respectively. The S2p XPS spectra of S′N-NCS are split into two main peaks, S2p3/2 (161.9 eV) and 2p1/2 (163.1 eV), and a satellite peak at the binding energy of 169.2 eV. The binding energy at 161.9 eV may be due to the sulfur vacancy (S2− in the low coordination state at the surface). The peak at 163.1 eV is attributed to the metal-sulfur bonds. There is a slight shift in the S2P3/2 and S2p1/2 peaks of the composite compared to S′N-NCS towards a lower binding energy (i.e., S2p3/2 at 161.6 eV and S2p1/2 at 162.8 eV), which may be due to a change in the environment during composite formation. The binding energy values found at 169.2 eV and 170.4 eV for S′N-NCS/S-g-CN may be due to the satellite peak and surface sulfur at some higher oxidation state, respectively. The deconvoluted peaks of S-g-CN are found at the binding energy values of 163.1 eV and 168.8 eV. The peak at 163.1 eV corresponds to the C–S bonds of S-g-CN, and the peak at 168.8 eV may be due to the presence of sulfur at a higher oxidation state. However, the corresponding C–S bond of S′N-NCS/S-g-CN is found at a binding energy value of 164.3 eV, which is higher than that of S-g-CN. This may be due to the change in the chemical environment of sulfur during composite formation. The binding energy values at around 284.8 eV, 286.8 eV and 288.1 eV represent the carbon XPS peaks of S-g-CN and S′N-NCS/S-g-CN, as shown in Fig. 3f, (A) and (B), for the sp2 hybridized carbon atom, carbon bonded to nitrogen (C–NH2 or CHN bonds), and tri-s-triazine unit (N–CN) bonds of the S-g-CN structure, respectively. Furthermore, the XPS results of the as-prepared samples were well supported by FTIR (Fig. S2, ESI†) and Raman analysis (Fig. S3, ESI†).
 | ||
| Fig. 3 XPS spectra of S-g-CN, S′N-NCS and S′N-NCS/S-g-CN: (a) survey scan, (b) Ni 2p, (c) Co 2p, (d) N 1s, (e) S 2p, (f) and C 1s. | ||
The specific surface area of the as-prepared materials has been studied via BET method by N2 adsorption–desorption isotherms at 77 K. Fig. 4 and Fig. S4 (ESI†) represent the N2 sorption isotherm, and the inset represents the pore size distribution curves for S′N-NCS, S′N-NCS/S-g-CN, and g-CN. From the depicted isotherm curves, the samples exhibit Type-II with H3 hysteresis loops. The BET surface areas of g-CN, S′N-NCS, and the S′N-NCS/S-g-CN nanocomposite are 24.84 m2 g−1, 32.29 m2 g−1 and 42.41 m2 g−1, respectively. The inset in Fig. 4 represents the pore size distribution curve, which is calculated by using the BJH equation from the desorption isotherm. From the inset in Fig. 4, a narrow intense pore size with an average pore diameter between (6–30 nm) is observed for S′N-NCS/S-g-CN. This might be due to the well-developed meso-porosity within the material.11 The pore volumes recorded for g-CN, S′N-NCS, and the S′N-NCS/S-g-CN nanocomposite are 0.21 cm3 g−1, 0.213 cm3 g−1, and 0.307 cm3 g−1, respectively. The observed results depict a high surface area and pore volume for S′N-NCS/S-g-CN in comparison to g-CN and S′N-NCS. The enhanced surface area for S′N-NCS/S-g-CN provides more active sites for redox reactions, and helps achieve faster electrolytic ion transportation and a shorter diffusion path for easy channelization, thereby enhancing the capacitive performances.
 | ||
| Fig. 4 N2 adsorption–desorption isotherm of S′N-NCS and S′N-NCS/S-g-CN. | ||
4.1. Electrochemical characterization
To explore the capacitive performance of the as-prepared materials (NCO, S-g-CN, S′N-NCS, S′N-NCS/S-g-CN), a series of electrochemical techniques (such as CV, CD and long-term cyclic stability tests) were conducted using a three-electrode system in 2 M aqueous KOH electrolyte. Prior to the electrochemical assessment of the prepared electrode materials, the substrate material, i.e., nickel foam, was analysed through the same experimental condition and barely contributed towards capacitive performance. Fig. 5(a) represents the comparative CV profiles for NFO, NCO, S-g-CN, S′N-NCS and S′N-NCS/S-g-CN at a sweep rate of 100 mV s−1 within the potential window of 0–0.6 V (vs. Hg/HgO) in 2 M aqueous KOH electrolyte. The redox peak observed from the cyclic voltammetry graph for NCO and S-g-CN indicates the characteristics features of the battery-type electrode material.36 However, in S′N-NCS and S′N-NCS/S-g-CN, a redox peak is observed at a discrete potential difference as compared to NCO and S-g-CN, owing to its improved electronic conductivity properties. Additionally, the integrated CV area for S′N-NCS/S-g-CN is much larger than those for S′N-NCS, NCO and S-g-CN, suggesting the improved electrochemical capacitive performance of S′N-NCS/S-g-CN. This might be because of the synergistic interaction between S-g-CN and S′N-NCS, which promotes channelization. Fig. 5(b) represents the comparative GCD profiles of S′N-NCS/S-g-CN, S′N-NCS, NCO and S-g-CN at a current density of 1 A g−1 within the potential window of 0–0.53 V. The CD curves of all the prepared materials show distinct voltage plateaus. Furthermore, S′N-NCS/S-g-CN has an extended discharge time compared to S′N-NCS, NCO and S-g-CN, respectively, which is consistent with the observed CV profile. These findings suggest that S′N-NCS/S-g-CN may have higher charge storage properties in comparison to S′N-NCS, NCO and S-g-CN. Fig. 5(c) shows the CV profile of S′N-NCS/S-g-CN within the potential window of 0–0.6 V at different scan rates varying from 1 mV s−1 to 50 mV s−1 with reference to the Hg/HgO electrode in 2 M aqueous KOH electrolyte solution. Fig. S5 (ESI†) shows the CV of S′N-NCS under the same conditions. The CV profile of S′N-NCS/S-g-CN displays an increase in redox current with an increase in the scan rate from 1 mV s−1 to 50 mV s−1. Additionally, with the increase in the scan rate, an apparent shift in the oxidation and reduction peaks towards more positive and negative potentials is observed, respectively. This might be due to the lower internal resistance, polarization, and faster ion kinetics of the electrode material.37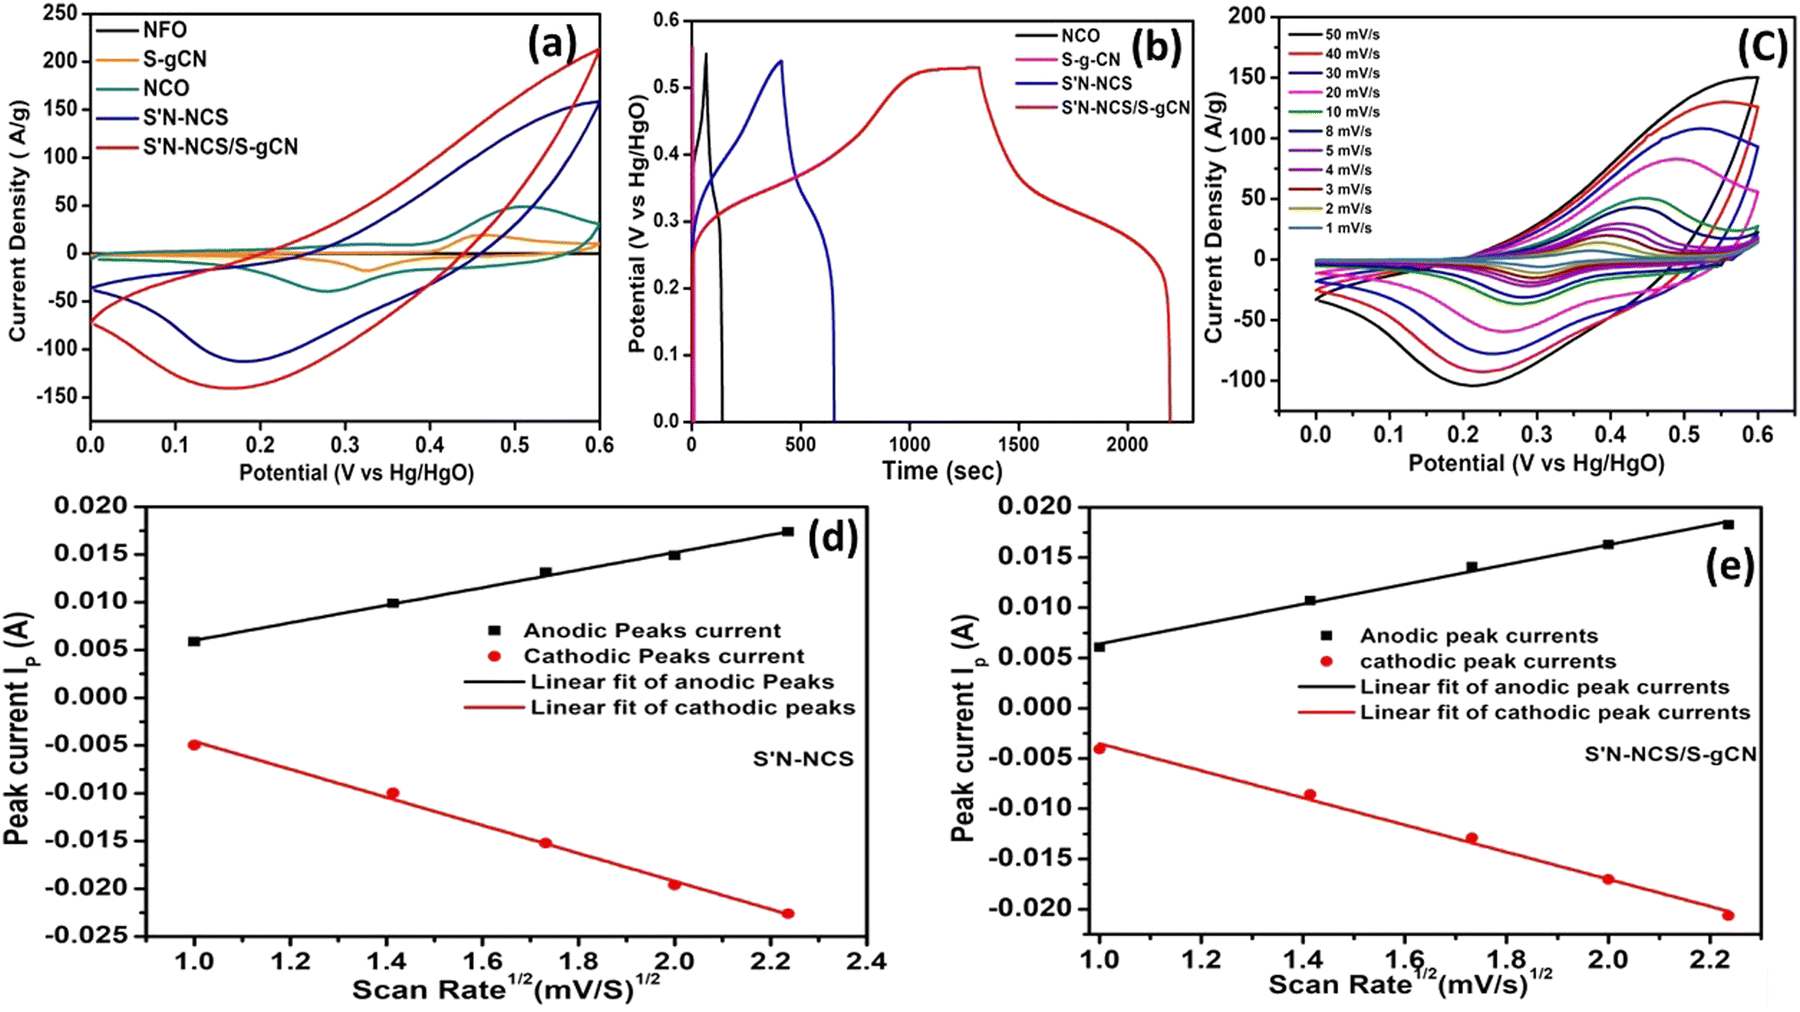 | ||
| Fig. 5 (a) Comparative CV profile for NFO, NCO, S-g-CN, S′N-NCS and S′N-NCS/S-g-CN at 100 mV sec−1. (b) Comparative GCD profile of S′N-NCS/S-g-CN, S′N-NCS, NCO and S-g-CN at a current density of 1 A g−1 within the potential window of 0–0.53 V. (c) CV profile of S′N-NCS/S-g-CN at different scan rates varying from 1 mV s−1 to 50 mV s−1. ((d) and (e)). Randles-Sevcik plot for S′N-NCS and S′N-NCS/S-g-CN. | ||
The CV curve in the lower scan rate region reveals a pair of well-defined redox peaks (Fig. 5(c)), possessing the characteristic features of a battery-type electrode material. A cathodic peak at 0.3 V and an anodic peak at 0.373 V were observed at the scan rate of 1 mV s−1, with a peak potential separation of 73 mV. Ideally, for a one-electron transfer reversible reaction, the peak potential separation should be 59 mV. The larger peak potential separation in S′N-NCS/S-g-CN suggests the quasi-reversible properties of the redox reaction.38 Moreover, as the scan rate increases, there is an increase in the peak potential separation along with the increase in the redox peak current. Fig. 5(d) and (e) shows the Randles–Sevcik plots for S′N-NCS/S-g-CN and S′N-NCS. The Randles–Sevcik graphs were generated by plotting the anodic and cathodic peak currents against the square root of the scan rate. The graph shows that with the increase in the square root of the scan rate, the redox peak current significantly increases, while originating almost from zero current at a low scan rate. The linear relation between the peak current and the square root of the scan rate indicates a regulated electrochemical process with rapid diffusion. To understand the kinetics of the electrode diffusion process, the diffusion coefficients for the electrodes (S′N-NCS/S-g-CN and S′N-NCS) were calculated by adopting the Randles–Sevcik equation shown below:39
| ip = 2.686 × 10⁵ × n3/2AD1/2C0V1/2 |
To investigate the energy storage kinetics of S′N-NCS and the S′N-NCS/S-g-CN electrode material, the power law was used. The power law is related to the scan rate (mV s−1) and the current i represented by the equation i = avb; where i is the current, v is the scan rate, and a and b are adjustable parameters. The value of b is obtained from the slope of the straight line of logi vs. logv, and it is based on the following equation:
| logi = loga + blogv |
The “b” value delivers quantitative information about the kinetics limitations. When b = 0.5, it indicates that the current response of the electrode material is governed by a diffusion-controlled mechanism. When b = 1, the current response of the electrode material is controlled by the capacitive (surface) mechanism. When b falls between 0.5 and 1, it indicates a combination of both capacitive and diffusion contribution mechanisms.40
Here, for S′N-NCS (Fig. 6(a)), the obtained b value is 0.6, which is near the borderline of the diffusion-dominant charge storage mechanism. For S′N-NCS/S-g-CN (Fig. 6(b)), the b value is 0.7, which indicates a mixed charge storage (both capacitive and diffusion) mechanism. Additionally, the quantitative differentiation between the diffusion and capacitive contribution to the total capacitance is corroborated by the Dunn and Trasatti methods. The modified power law can be employed at a fixed potential to the current peak region to quantify the specific amount of charge stored, i.e., capacitive type (kiv) and diffusion controlled (k2v½), and is expressed by the equations below:
| i = k1v + k2v1/2 |
| i/v1/2 = k1v1/2 + k2 |
 | ||
| Fig. 6 Calculation of the b value for (a) S′N-NCS and (b) S′N-NCS/S-g-CN; k1 and k2 calculation for (c) S′N-NCS and (d) S′N-NCS/S-g-CN. | ||
 | ||
| Fig. 7 Dunn's plot: (a) and (c) capacitive contribution for S′N-NCS and S′N-NCS/S-g-CN at 4 mV s−1. Bar diagram of the percentage of capacitive and diffusion-controlled contributions for (b) and (d) S′N-NCS and S′N-NCS/S-g-CN at different scan rates. | ||
The dominated diffusion-controlled mechanism is observed for S′N-NCS, involving electrolyte ion insertion/de-intercalation into S′N-NCS, and is represented in the equation shown below.43
| S′N-NCS + xK+ + xe− ↔ KxS′N-NCS |
In the charging process, K+ ions from the electrolyte diffuse into S′N-NCS, where they are inserted into its lattice or electrochemically surface-active sites. It involves the simultaneous transfer of electrons to maintain charge balance, facilitated by the external circuit. Considering the case of discharging, K+ ions diffuse out of the S′N-NCS structure and back into the electrolyte, reversing the intercalation process. Owing to the released electrons in the external circuit, it produces a current. Owing to the reversibility of the reaction, S′N-NCS can repeatedly undergo ion insertion and removal without significant structural degradation, making it suitable for high-performance supercapacitor applications. In contrast to S′N-NCS, a completely varied observation (i.e., dominated capacitive-controlled mechanism at lower scan rate) has been observed for S′N-NCS/S-g-CN, and is shown in Fig. 7(b). Fig. 7(b) shows that 82% of the entire capacity is due to the capacitive-controlled mechanism, while 18% is contributed by a diffusion-controlled mechanism at the scan rate of 4 mV s−1. Fig. 7(c and d) represents the bar diagram of the diffusion-controlled and capacitive contributions out of the total capacitance of S′N-NCS and S′N-NCS/S-g-CN. The findings show that with an increase in the scan rate, the capacitive-controlled mechanism is dominated over the diffusion-controlled mechanism in S′N-NCS/S-g-CN with current contributions of 70%, 76%, 80%, 82%, 84% and 88% at the scan rates of 1 mV s−1, 2 mV s−1, 3 mV s−1, 4 mV s−1, 5 mV s−1 and 10 mV s−1, respectively. The charge storage mechanism for S′N-NCS can be explained on the basis of the sulfur vacancy, which generates a heterogeneous interface between sulfide and the sulfur vacancy. This vacancy collectively creates an internal electric field within the material, which facilitates the mobility of the electron and ions, as well as enhances the electrochemical active sites to boost the electrocatalytic performances.17 However, for further effective channelization of the electron and ions, integration of S′N-NCS with S-g-CN delivers a contrasting observation in terms of the charge storage mechanism, which might be due to the integration of S′N-NCS with S-g-CN. The thin sheet-like structure of S-g-CN provides a base arrangement for S′N-NCS to grow, which creates branches from its origin and spreads towards the base material of S-g-CN. The elongated and twisted structure of the material resembles a pharaoh's snake-like structure, which facilitates easy mass transportation, leading to higher reaction rates and improving the overall charge storage performance of S′N-NCS/S-g-CN. Moreover, incorporation of sulfur into g-CN makes the material more conductive and increases its ion permeability properties.44 These properties of S-g-CN make the material more pivotal as it provides surface wettability and hydrophilic properties, ensuring easy penetration of the aqueous electrolyte and eventually interacting with S′N-NCS. The capacitive performance is further supported by the high specific surface area of S′N-NCS/S-g-CN in comparison to S′N-NCS. Additionally, conjugation of the thin crumpled sheet and pharaoh's snake-like morphology, as well as the strong interaction between the K+ ion and S− in the S′N-NCS/S-g-CN electrode is beneficial to access the K+ ion. This leads to easy insertion/desertion of K+ into/out of the conjugated morphology and presence of the C, N matrix, ensuring the dominating capacitive-controlled charge storage mechanism.27,45 The mechanism is represented in the equation shown below.
| (S′N-NCS/S-g-CN) surface + K+ + e− ↔ [(S′N-NCS/S-g-CN)-K+] surface |
Moreover, the amount of charge stored in the outer and inner surfaces of S′N-NCS and S′N-NCS/S-g-CN was further investigated through the Trasatti method.41 According to the Trasatti method, the total capacitance performance of the electrode is contributed both by the inner and outer surface capacitances, and it can be expressed as CTotal = CInn + COut. The charge-storing ability of the electrode material was evaluated by plotting the specific capacity as a function of the scan rate. The Trasatti plot was used to quantify the ratio of surface-controlled capacitive charge (Qouter) to the total stored charge (Qtotal), as well as quantify the ratio of diffusion-controlled charge (Qinner) to the total stored charge (Qtotal). When v → 0, it allows the maximum possibility to access the inner surface area of the electrode material, which offers the maximum specific capacity to the material (q → qt). Similarly, when v → α, the particular area available is the outer surface of the electrode, which is the electrode–electrolyte interface that provides specific capacity to the electrode material (q → qo).41
Fig. 8 depicts the specific capacity as a function of v1/2 and v−1/2. The total charge (qtotal) stored within the electrode for S′N-NCS and S′N-NCS/S-g-CN was calculated from the intercept of the linear fitted plot of 1/q vs. v1/2 (Fig. 8(a) and (b)). Moreover, the charge stored at the outer (qouter) electrochemical surface of S′N-NCS and S′N-NCS/S-g-CN was calculated from the intercept of the linear plot of q vs. v−1/2 (Fig. 8(c) and (d)). As per the findings, the total charges stored in S′N-NCS and the S′N-NCS/S-g-CN nanocomposite are 909.09 C g−1 and 1111.11 C g−1, and 390.34 C g−1 and 779.87 C g−1 found for the outer electrochemical charge storage, respectively. Furthermore, the charge stored in the inner surface (qinner) of the electrode was calculated by subtracting the charge stored at the outer surface from the total charge stored, and it was found to be 331.2 C g−1 for S′N-NCS/S-g-CN and 518.8 C g−1 for S′N-NCS C g−1 for NCS. The percentage of the capacitive and diffusion-controlled contribution for S′N-NCS and S′N-NCS/S-g-CN was calculated. For S′N-NCS, the capacitive-controlled and diffusion-controlled contributions are 43% and 57%, respectively. Likewise, for S′N-NCS/S-g-CN, the capacitive-controlled and diffusion-controlled contributions are 70% and 30%, respectively. Here, also, the complete transformation from diffusion-controlled to capacitive-controlled mechanism has been found for S′N-NCS/S-g-CN, and is consistent with the result obtained from the Dunn method.
 | ||
| Fig. 8 (a) and (b) Plot of 1/q vs. v1/2 for S′N-NCS and S′N-NCS/S-g-CN; and (c) and (d) plot q vs. v−1/2 for S′N-NCS and S′N-NCS/S-g-CN. | ||
Further, to quantify the charge storage capabilities of S′N-NCS/S-g-CN, a GCD study was performed within the potential window of 0–0.53 V by varying the current density from 1 to 10 A g−1. Fig. 9(a) depicts the GCD graphs for S′N-NCS/S-g-CN, while Fig. S6 and S7 (ESI†) show those of S′N-NCS and S-g-CN, respectively. It can be seen from the GCD profiles of S′N-NCS/S-g-CN, S′N-NCS and S-g-CN that the GCD profile is nonlinear in nature, suggesting a characteristic battery-like nature, and this observation agrees well with the CV profile. The specific capacities of S′N-NCS/S-g-CN, S′N-NCS and S-g-CN were calculated from the GCD profile at different current densities, and is represented in Table S1 (ESI†). However, the experimental specific capacitance observed for S′N-NCS (242 C g−1 ≅ 403.3 F g−1) is lower than the theoretical capacitance of NiCO2S4 (2532.4 F g−1) (detailed calculation in ESI†). This observation might be to the due to the incomplete utilization of S′N-NCS and insufficient ion transport within the electrode pores. Apart from this, the practical voltage window and real-world conditions vs the assumed theoretical assumptions can cause discrepancies in the specific capacitance value.46,47
 | ||
| Fig. 9 (a) GCD curves of S′N-NCS/S-g-CN, (b) comparative capacitive assessment of S′N-NCS/S-g-CN, S′N-NCS and NCO, and (c) long-term cyclic stability performance of S′N-NCS/S-g-CN. | ||
Fig. 9(b) shows a comparative capacitive assessment of S′N-NCS/S-g-CN, S′N-NCS and S-g-CN. It depicts the gradual decrease in specific capacity values with an increase in the current density, which is due to the faster electrolytic ion absorption over the electrode surface. Moreover, the rate capability performance study of S′N-NCS/S-g-CN reveals that about 70% of the initial capacitance (1 A g−1) is retained even at high current density, i.e., at 10 A g−1, suggesting the excellent rate capability performance of S′N-NCS/S-g-CN. Table S2 (ESI†) summarizes the capacitive assessment of the earlier reported NiCo2S4 and its composite materials, and found that the integration of the sulfur vacancy-assisted nitrogen-doped NiCo2S4 with S-g-CN exhibited superior performance compared to the others. The findings from CV and GCD reveal that the S′N-NCS/S-g-CN electrode material has a high specific capacity in comparison to NCO, S′N-NCS and S-g-CN. The synergistic integration of S′N-NCS and S-g-CN made an effective contribution towards the enhanced performance. To ensure the effectiveness of the S′N-NCS/S-g-CN electrode material, a cyclic stability test was conducted within the potential range of 0 - 0.53 V at a current density of 4 A g−1 in 2 M KOH aqueous electrolyte solution. Fig. 9(c) depicts the long-term cyclic stability performance of the S′N-NCS/S-g-CN electrode material with 94.1% capacitive retention after 10000 cycles. The inset of Fig. 9(c) shows the GCD curve before and after 10000 cycles. The dominant capacitive storage contribution of S′N-NCS/S-g-CN offers high specific capacity values and long-range cyclic stability performances, signifying its potential in the field of emerging electrode materials towards the fabrication of cost-effective supercapacitor electrode materials. The notable electrochemical performance of the S′N-NCS/S-g-CN nanocomposite towards the supercapacitor study has been explained, owing to the compositional engineering between S′N-NCS and S-g-CN, which effectively enhances the surface area. Furthermore, the hetero-morphology provides abundant diffusion paths for e− and ions, allowing the electrolyte to fully penetrate the material and reduce the diffusion paths for electrons and ions. As a result, an enhanced capacitive performance has been observed (Scheme 2).
 | ||
| Scheme 2 View of the energy storage performance of the S′N-NCS/S-g-CN nanocomposite. | ||
Conclusions
The integration of S-g-CN with S′N-NCS endows unique properties to the material, facilitating its potential use in the supercapacitor applications. The electronic characteristics of g-CN in S-g-CN achieves wettability properties in S′N-NCS/S-g-CN. As a result, it enhances the hydrophilic property of the material, which effectively enhances the electrolyte penetration and mass transportation ability in S′N-NCS/S-g-CN. However, heteroatom doping and sulfur vacancy enhanced the conductivity and promoted the ion diffusion, respectively. The XPS results are consistent with the FTIR and Raman studies. The enhanced surface area of S′N-NCS/S-g-CN provided redox active sites, and facilitated faster electrolytic ion transportation and shorter diffusion path. The capacitive performance of S′N-NCS/S-g-CN is supported by the high specific surface area in comparison to the S′N-NCS. Scheme 2 depicts an overview of the present work, highlighting the robust and distinct features of the material that make it a unique and promising future material not only in the field of supercapacitors, but also in the domain of HER, OER and electrochemical sensors.Data availability
Data will be provided upon request.Conflicts of interest
There are no conflicts to declare.Acknowledgements
Dr Soumyashree Pany (File no. PDF/2016/002751) and Dr Amtul Nashim (File no. PDF/2016/002397) are grateful to DST-SERB for funding via N-PDF. Ritik Mohanty is grateful to CSIR, New Delhi, India, for the SRF-direct fellowship (File no-09/0969(18687)/2024-EMR-1). The authors are grateful to Siksha ‘O’ Anusandhan University (Deemed to be university) for providing the platform for performing their research work.References
- H. W. Park and K. C. Roh, J. Power Sources, 2023, 557, 232558 CrossRef CAS.
- Lichchhavi, A. Kanwade and P. M. Shirage, J. Energy Storage, 2022, 55, 105692 CrossRef.
- H. Aydın, U. Kurtan, B. Ustun, S. N. Koc, E. Akgul and M. Demir, J. Energy Storage, 2023, 72, 108306 CrossRef.
- B. Ustun, H. Aydın, S. N. Koc and U. Kurtan, Fuel, 2023, 341, 127735 CrossRef CAS.
- F. Wang, X. Wu, X. Yuan, Z. Liu, Y. Zhang, L. Fu, Y. Zhu, Q. Zhou, Y. Wu and W. Huang, Chem. Soc. Rev., 2017, 46, 6816–6854 RSC.
- A. Noori, M. F. El-Kady, M. S. Rahmanifar, R. B. Kaner and M. F. Mousavi, Chem. Soc. Rev., 2019, 48, 1272–1341 RSC.
- C. Wang, E. Zhou, W. He, X. Deng, J. Huang, M. Ding, X. Wei, X. Liu and X. Xu, Nanomaterials, 2017, 7, 41 CrossRef PubMed.
- R. Mohanty and K. Parida, Electrochim. Acta, 2024, 491, 144327 CrossRef CAS.
- M. Cui and X. Meng, Nanoscale Adv., 2020, 2, 5516–5528 RSC.
- J. Zhou, Y. Wang, J. Zhou, K. Chen and L. Han, Dalton Trans., 2021, 50, 15129–15139 RSC.
- Z. Ma, Z. Sun, H. Jiang, F. Li, Q. Wang and F. Qu, Appl. Surf. Sci., 2020, 533, 147521 CrossRef.
- N. Nwaji, H. Kang, M. Goddati, L. T. Tufa, J. Gwak, A. Sharan, N. Singh and J. Lee, J. Mater. Chem. A, 2023, 11, 3640–3652 RSC.
- Z. Hongyu, Z. Lu, B. Liu, C. Yuan and Y. Cao, Composites, Part B, 2024, 274, 111267 CrossRef.
- X. Zhu, X. Zhang, Y. Li and Y. Liu, J. Energy Storage, 2024, 80, 110350 CrossRef.
- R. Kumar, S. Sahoo, E. Joanni, R. Pandey and J.-J. Shim, Chem. Commun., 2023, 59, 6109–6127 RSC.
- X. Guo, Z. Liu, F. Liu, J. Zhang, L. Zheng, Y. Hu, J. Mao, H. Liu, Y. Xue and C. Tang, Catal. Sci. Technol., 2020, 10, 1056–1065 RSC.
- S. Cao, X. Xu, Q. Liu, H. Zhu and T. Hu, J. Energy Chem., 2024, 95, 596–610 CrossRef.
- J. Hualin, H. Zhou, Q. Ke, P. Chen, S. Wang, B. Rao and G. Wu, Appl. Surf. Sci., 2024, 648, 159063 CrossRef.
- M. Xu, T. Liang, M. Shi and H. Chen, Chem. Rev., 2013, 113, 3766–3798 CrossRef PubMed.
- K. Khan, A. K. Tareen, M. Aslam, R. Wang, Y. Zhang, A. Mahmood, Z. Ouyang, H. Zhang and Z. Guo, J. Mater. Chem. C, 2020, 8, 387–440 RSC.
- H. Asif, M. Sohail, A. E. Jery, K. M. Al-Zaydi, K. F. Alshammari, J. Khan and H. Ali, Chem. Rec., 2023, 23, 202200171 CrossRef.
- P. Suja, J. John, T. P. D. Rajan, G. M. Anilkumar, T. Yamaguchi, S. C. Pillai and U. S. Hareesh, J. Mater. Chem. A, 2023, 11, 8599–8646 RSC.
- M. Tahir, C. Cao, N. Mahmood, F. K. Butt, A. Mahmood, F. Idrees, S. Hussain, M. Tanveer, Z. Ali and I. Aslam, ACS Appl. Mater. Interfaces, 2014, 6, 1258–1265 CrossRef CAS.
- Y. Gong, M. Li and Y. Wang, ChemSusChem, 2015, 8, 931–946 CrossRef CAS PubMed.
- N. Ullah, C. Shunwei and Z. Ruiqin, Appl. Surf. Sci., 2019, 487, 151–158 CrossRef CAS.
- M. Ghaemmaghami and R. Mohammadi, Sustainable Energy Fuels, 2019, 3, 2176–2204 RSC.
- J. Zhang, J. Ding, C. Li, B. Li, D. Li, Z. Liu, Q. Cai, J. Zhang and Y. Liu, ACS Sustainable Chem. Eng., 2017, 5, 4982–4991 CrossRef CAS.
- A. B. Padasalagi, J. S. Doddamani, R. M. Hodlur and M. H. Rabinal, Energy Technol., 2024, 12, 2301197 CrossRef CAS.
- M. Hussain, S. D. Alahmari, F. F. Alharbi, S. R. Ejaz, M. Abdullah, S. Aman, A. G. Al-Sehemi, A. M. A. Henaish, A. Sadaf, H. Muhammad and T. Farid, J. Energy Storage, 2024, 80, 110289 CrossRef.
- E. Hossein, M. Pakzad and F. Afaridoun, J. Energy Storage, 2024, 96, 112692 CrossRef.
- Z. Li, L. Wu, L. Wanga, A. Gua and Q. Zhou, Electrochim. Acta, 2017, 231, 617–625 CrossRef CAS.
- J. S. Ma, H. Yang, S. Kubendhirana and L. Y. Lin, J. Alloys Compd., 2022, 903, 163972 CrossRef CAS.
- S. Pany, A. Nashim, K. Parida and P. K. Nanda, ACS Appl. Nano Mater., 2021, 4, 10173–10184 CrossRef CAS.
- K. Rajalakshmi, J. Yesuraj, S. Muthusamy, N. Selvam, Y. Sik Nam, K. Kim and Y. Xu, J. Energy Storage, 2024, 99, 113424 CrossRef.
- P. A. K. Reddy, H. Han, K. C. Kim and S. Bae, ACS Appl. Energy Mater., 2022, 5, 13751–13762 CrossRef.
- S. Vijayakumar and G. Muralidharan, J. Electroanal. Chem., 2014, 727, 53 CrossRef.
- D. Huang, Z. Lu, X. Liu, J. Gao, Z. Chen, X. Wang and X. Fu, Appl. Surf. Sci., 2022, 605, 154707 CrossRef.
- K. Kannadasan, S. D. Vaithiyanathan, S. Archana, P. Thomas and P. Elumalai, New J. Chem., 2023, 47, 13963–13978 RSC.
- B. Tekin and Y. Topcu, J. Energy Storage, 2024, 77, 109879 CrossRef.
- M. Z. Iqbal, M. M. Faisal, M. Sulman, S. R. Ali, A. M. Afzal, M. A. Kamran and T. Alharbi, J. Energy Storage, 2020, 29, 101324 CrossRef.
- J. Liu, J. Wang, C. Xu, H. Jiang, C. Li, L. Zhang, J. Lin and Z. X. Shen, Adv. Sci., 2018, 5, 1700322 CrossRef.
- N. Zhao, H. Fan, J. Ma, M. Zhang, C. Wang, H. Li, X. Jiang and X. Cao, J. Power Sources, 2019, 439, 227097 CrossRef.
- H. Wang, X. Xu and A. Neville, RSC Adv., 2021, 11, 26273–26283 RSC.
- A. Ramar and F. M. Wang, Graphitic carbon nitride for batteries, Nanoscale graphitic carbon nitride, Elsevier, 2022, vol. 2, pp. 367–392 Search PubMed.
- D. Sarkar, D. Das, S. Das, A. Kumar, S. Patil, K. K. Nanda, D. D. Sarma and A. Shukla, ACS Energy Lett., 2019, 4, 1602–1609 CrossRef.
- Y. Zhao, Q. Zhang, B. Sun, Y. Wang, X. Shu and Z. Dong, J. Energy Storage, 2024, 78, 109995 CrossRef.
- K. V. Sankar and R. K. Selvan, RSC Adv., 2014, 4, 17555 RSC.
Footnotes |
| † Electronic supplementary information (ESI) available. See DOI: https://doi.org/10.1039/d4ma00847b |
| ‡ Equal contribution. |
| This journal is © The Royal Society of Chemistry 2025 |