
 Open Access Article
 This Open Access Article is licensed under a
 Creative Commons Attribution 3.0 Unported Licence
Unlocking the full potential of solar cell materials: parameter sensitivity analysis and optimization using response surface modelling†
Manoj
Kumar
 *acde,
Sanju
Rani
b,
Xu
Wang
*c and
Vidya Nand
Singh
*de
*acde,
Sanju
Rani
b,
Xu
Wang
*c and
Vidya Nand
Singh
*de
aSchool of Basic and Applied Science, IILM University, Knowledge Park-II, Greater Noida, Uttar Pradesh 201306, India
bDepartment of Electrical Engineering, Indian Institute of Technology Mandi, Kamand, Himachal Pradesh 175075, India
cSchool of Engineering, RMIT University, Victoria 3001, Australia. E-mail: xu.wang@rmit.edu.au
dIndian Reference Materials (BND) Division, CSIR-National Physical Laboratory, Dr K. S. Krishnan Marg, New Delhi, 110012, India. E-mail: singhvn@nplindia.org
eAcademy of Scientific and Innovative Research (AcSIR), Ghaziabad, Uttar Pradesh 201002, India
First published on 11th December 2024
Abstract
This study introduces a novel approach for predicting solar cell efficiency and conducting sensitivity analysis of key parameters and their interactions, leveraging response surface modeling to optimize interacting solar cell structure parameters for the best performance. Integrating response surface modeling with solar cell simulation software enhances the efficiency prediction process that enables the solar cell capacitance simulator (SCAPS)-1D software to unlock the true potential of a material. Through the utilization of central composite design (CCD) and response surface modeling (RSM), this research minimizes material waste during synthesis, saves time, and conserves energy. The methodology involves selecting five input parameters within specific ranges, modeling them using the least square method to create a polynomial regression model, and validating the model through efficiency predictions compared to SCAPS-1D simulations. The parameter sensitivity analysis is validated using analysis of variance (ANOVA) test results, demonstrating the precision of the RSM in predicting solar cell efficiency with a maximum error of 1.93%.
Introduction
Simulation is a powerful tool to predict the actual potential of a device under ideal conditions. There are so many solar cell simulation Software packages, including SCAPS-1D,1,2 Silvaco,3 Sentaurus,4etc., to predict the solar cell performance of a device. Generally, it is very hard to predict the best performance with multiple optimized parameters/variables in solar cell simulation software like SCAPS-1D.5,6 Mamta et al.2 simulated Sb2Se3 and Sb2S3 solar cell devices and chose the optimized set of parameters like the thickness of absorber layers (1 μm for both), 1012 and 1016 cm−3 of valence band density of states in Sb2S3 and Sb2Se3, respectively, and so on (at which efficiency was maximum). Similarly, Bhowmik et al.7 selected the parameters near the maximum efficiency value. The general approach is to select the optimal parameters at which the device showed the largest efficiency. Also, the steps taken in parameter changes lead to discrete parameters, and the step length depends on the author's choice. Generally, the authors of previous literature simulated the efficiency of solar cell structures using existing simulation software like Sentarious, SCAPS-1D, etc. They chose the desired range of steps for varying individual parameters well in the practical range of the parameters. They collected the value of individual physical parameters at which the device had the largest efficiency. So, it was assumed that individual sole optimal physical parameters for the largest efficiency can be combined to obtain the maximum efficiency of the device if the physical parameters do not couple with one another or are independent of one another. However, these parameters were indeed interconnected and not independent of one another, therefore, their combination will not be able to produce the maximum efficiency of the device. By applying our proposed method, one can easily locate the maximum efficiency among the many coupled parameters within their range. So, after using the simulation software, one should apply our method (again validated by the ANOVA method) to unlock the device's real potential.The novelty of our method lies in the fact that both the SCAPS-1D and RSM are applied to identify an optimal combination of interconnecting physical parameters of the SnSe-based solar device for producing maximum efficiency for the first time. Hence, the strategy of applying both simulation and modelling offers a precise target of achieving the optimal parameters at which the device offers maximum efficiency. The optimization process by using RSM provides the freedom to look into all possible values within the range of a given parameter offering a continuous parameter value search within the range.
There are many reports on the optimization of device fabrication conditions for the best solar cell performance using RSM.8–15 Suliman et al. used RSM with CCD to optimize the fabrication conditions of organic solar cells.12 Mohammed et al.13 optimized the thickness of the active layer to reduce the series resistance of the tandem solar cell using CCD and RSM. Hunde et al.13 used the SCAPS-1D software along with the Box–Behnken designs (BBD) and RSM methods for the optimization of perovskite solar cells to achieve their best efficiency.
Besides, there are many applications of RSM in the fields of food science, chemometrics, and biochemistry, introduced by Box et al. in 1950.16 It is a technique based on fitting an experimental model from experimental data based on an experimental design.
The uniqueness of the proposed method is being able to fit a regression polynomial model of the solar cell material properties such as the band gap (eV), shallow uniform acceptor density (cm−3), CBO (eV), work function of back contact (eV), and operating temperature (K) to predict the efficiency output from the solar cell material properties. It can be applied to identify the optimal solar cell material property parameter combination to predict the largest efficiency and unlock the full potential of solar cell materials. The proposed method can be used to determine the sensitivity of the input variables and their interactions according to the magnitude sequence of the coefficients of the variables in the regression polynomial model. The sensitivity analysis and RSM model can be validated by its ANOVA. In the proposed solar cell RSM simulation method using the SCAPS-1D software, input parameters are planned and arranged in CCD where the optimal parameter combination and maximum efficiency can be initially determined. However, CCD is not able to generate the regression polynomial parameter model, and RSM is then applied to generate the model for the prediction, conduct a parameter sensitivity study, and verify and refine the initial CCD optimal results.
These features of the proposed method combining RSM with CCD differentiate it from the others in the existing literature, providing an unusual potential for simulation prediction and material property parameter optimization for the best performance. Also, the study suggests the best parameters for the device where the SnSe-based single junction cell offers the maximum efficiency so far.
Methodology
The efficiency of a solar cell depends on many factors like the active layer, fabrication technique, etc. In this paper, optimization is carried out for maximum efficiency by taking into account parameters like band gap, shallow uniform acceptor density of states, conduction band offset (CBO), the work function of the back contact, and operating temperature. In contrast, other parameters like valence band density of states (VBDOS), conduction band density of states (CBDOS), radiative recombination coefficient (RRC), dielectric constant of the material, mobilities of electrons and holes, etc. are taken fixed as per reported values. The variation range of these parameters is shown in Table 1 below. First, the CCD matrix is formed based on the number of variable parameters. The CCD and RSM are applied to model the input parameters and the output efficiency obtained by the SCAPS-1D simulation to get a regression prediction model. RSM is validated by the ANOVA test. Finally, optimization for the input parameters is carried out for maximum efficiency to determine the optimal input variable combination.| Parameters | Varied range of parameter |
|---|---|
| (zi) | (zmin–zmax) |
| z min and zmax denote the minimum and maximum range of the chosen parameter zi for simulations. | |
| Band gap (eV) | 1–1.5 |
| Shallow uniform acceptor density (cm−3) | 9 × 10¹⁵–4 × 10¹⁶ |
| CBO (eV) | −0.1 to 0.3 |
| The work function of back contact (eV) | 4.8–5.4 |
| Operating temperature (K) | 275–320 |
The values in Table 1 are chosen well in the practical range of the parameters. The variation in the band gap of the SnSe can be seen in the literature from 0.95–1.76 eV.17,18 The band gap is an easily tunable parameter and can be tuned by varying the thickness of the film,18–20 deposition method, the crystallinity of film, post-annealing, etc.21,22 We chose the band gap value of SnSe that lies well in the practical range of the parameters.23,24
Generally, shallow energy states are near the valence band maxima and conduction band minima. Dopant energy levels near the valence band maxima form the shallow acceptor density of states, and this density of states is proportional to the dopant concentration. The shallow acceptor density of SnSe can be easily varied by the doping in the SnSe. SnSe is intrinsically p-type due to the vacancy of Sn,23,25 so dopants like Na, Mg, K, Ag, etc. led to the increased shallow acceptor density after substitution at the Sn site.25–28 The shallow uniform acceptor density in the SnSe ranges from 9 × 10¹⁵ to 4 × 1016 cm−3. The value of shallow acceptor density of states is within the range reported by Yadav et al.29 Elementary calculations for the dopant concentration indicate that the shallow acceptor density of states in the range of 9 × 10¹⁵–4 × 1016 cm−3 is roughly equal to the substitution of the one Sn atom by dopants per 4.97 × 10⁷–2.19 × 10⁶ atoms of Sn in the crystal (taking the unit cell volume as 219.19 Å3). During the synthesis of the SnSe (by a physical route), one can easily select the number of the Sn atoms available for the Se to react to form SnSe (following the required number of Sn vacancies). Additionally, the same number of atoms are replaced with the dopants, and under the controlled conditions of the reaction, dopant atoms can be substituted at the place of Sn.30 After getting the desired stoichiometric ratio of Sn and dopant in SnSe, close sublimation and thermal evaporation of the same powder can be carried out to obtain the desired state of SnSe. Also, thermal co-evaporation of Sn and Se can be optimized for the desired range of Sn vacancy, and then dopants can be added via thermal evaporation followed by thermal diffusion processes.31 Technically, such precise doping is impossible to achieve, but one may reach nearby values that do not change the device's efficiency significantly. The work function of the back contacts is selected in the range 4.8–5.4 eV. Generally, metals like Au, Pt, Pd, Ni, Ge, and Co have their work function in this range.32
VBDOS and CBDOS are calculated with the help of the equations below.33
 | (1) |
 | (2) |
 is the effective mass of electrons,
  is the effective mass of holes, KB is the Boltzmann constant, T is temperature, h is Planck's constant, π is 3.1416, NC is the density of states in the conduction band, and NV is the density of states in the valence band.
The values of the effective mass of electrons and holes are taken as 0.15 and 0.16 m0 (ref. 34) (here the direction of transport is taken along the c axis for the vertical solar device; m0 is the mass of a free electron). From eqn (1) and (2), VBDOS and CBDOS are calculated to be 1.6 × 10¹⁸ and 1.45 × 1018 cm−3, respectively.
The radiative recombination coefficient (RRC) is defined as the direct or radiative transitions of excited carriers to the ground states taking place for a defined volume of carriers per second and is calculated using the following formula35
 | (3) |
SnSe is an indirect band gap material having a band gap value of 1.08 eV.36 The value of radiative recombination coefficients B for the indirect band gap materials is very small and generally lies in the value of 10−10 cm−3 s−1 to 10−15 cm−3 s−1, e.g. Si has 7 ×10⁻¹⁵ cm−3 s−1,37 GaAs has 10−10 cm3 s−1.38 For SnSe we have taken radiative recombination coefficient B as a random value of 2.9 × 10⁻¹¹ cm3 s−1. A schematic of the device based on SnSe/TiO2/SnO2 is shown in Fig. 1(a) below. Table S1 (ESI†) incorporates all the variables chosen for the device.
 | ||
| Fig. 1 (a) Schematic of the device, (b) efficiency of the cell for different variables, and (c) efficiency at optimized parameters in (b). | ||
Choosing TiO2 as a buffer layer has one significant role in the device. Ti can reduce the surface oxidized SnSe to the pure non-oxidized SnSe by converting itself to TiO2. The SnSe surface can be easily oxidized at room temperature.22,39 Ti has the potential to reduce the surface oxide of all metal chalcogenides.39
There are four possible reactions for the oxidation of SnSe, with a Gibbs free energy change of ΔG = −432.485 kJ and −328.858 kJ, respectively, for the first and second reactions. The first reaction showed higher possibilities for the formation of a more stable oxide of SnO2.
| SnSe + O2 → SnO2 + Se | (R1) |
| 2SnSe + O2 → 2SnO + 2Se | (R2) |
| 2SnSe + O2 → SnO2 + SnSe2 | (R3) |
| 4SnSe + O2 → 2SnO + 2SnSe2 | (R4) |
The change in Gibbs free energy for the oxidation of Ti is around −880 kJ (ref. 39)
| Ti + O2 → TiO2 |
| SnO2 + Ti → Sn + TiO2 |
| SnSe2 + SnO2 + Ti → Sn + TiO2 + SnSe2 → TiO2 + SnSe |
Details about the algorithm of the SCAPS-1D software can be found in the reports.40–42
Variations in the efficiency of all the above-mentioned parameters are simulated by SCAPS-1D. One can see that the efficiency is maximum at the shallow acceptor density of 4 × 1016 cm−3, the band gap of 1.38 eV, the CBO of 0 eV, temperature of 275 K (but taken more practically to be 300 K for the simulation), and work function of the back contact of 5.4 eV, respectively, as shown in Fig. 1(b). These optimized parameters (Fig. S1(a) and (b), ESI†) are applied to simulate for optimal efficiency. The maximum efficiency obtained is 20.74% (Fig. 1(c)).
Generally, it becomes more cumbersome for researchers to search all the possible combinations of variables for maximum efficiency. It is quite easy to apply all the optimized parameters to calculate the maximum efficiency, but one often does not know about the maximum efficiency of the device within these ranges of parameters. Hence one of the ways to find the global maxima of function (efficiency) with 5 input parameters is via the CCD and RSM method where the multiple objective optimization genetic algorithm with the following steps is used: (1) the initial population is given by the SCAPS-1D software, or a random initial population is generated by itself. This population will be recorded as population zero. (2) Individuals in population zero will be assessed and the individuals with high fitness will be selected and combined into the parent population. (3) A child population is then generated by the program using selection, crossover, and mutation. (4) The parent population (the last generation) and child population will be combined by the program to generate a new population. (5) The new non-dominated population will be sorted by the program and the new front is generated. (6) The optimal population will be picked up by the program based on the crowded distance sorting to calculate new generation.
If the present tolerance of the fitness function is less than the preset tolerance of the fitness function of the optimal population, the output result should be produced. Otherwise, repeat steps 3 to 5.
At last, this optimization could potentially suggest the particular values of the parameters at which the device showed its largest efficiency, but practically using the combination of individual sole optimal parameters make it difficult to achieve the targeted maximum efficiency. This is because these parameters are interconnected. For example, the band gap is a function of the doping concentration and the type of dopant, their concentration, thickness, absorption coefficient, etc. are not independent and interact with one another. So, controlling the device parameter to the desired value of thickness, shallow acceptor density of states, type of dopant, absorption coefficient, and band gap value may not be possible to achieve simultaneously. In this report, we have taken care in selecting the parameter values in the practical range of the parameters which were either reported in the literature or can be achieved by a simple strategy or taking the externally controlled parameters in the simulation to be more achievable (like the work function of the back contact, operating temperature, and conduction band offset). Hence the optimal parameters of the device for the maximum efficiency define the efficiency cap of the device, and one can achieve nearby values by targeting the optimized parameters.
CCD modelling and design of experiments
The central composite design table's size depends on the number of parameters, e.g. for 5 variables, 50 entries are obtained. There are 8 center points and 42 non-center points in Table S2 (ESI†). Centre points are referred to as the middle points of the variable inputs (points in the run of 43 to 50 in Table S3, ESI†). For complete details of the CCD and RSM, please refer to ref. 43. The number of runs can be derived from the following equation| Total runs = 2k + 2k +N |
Input variables (shown in Table S3, ESI†) can be calculated using eqn (4)–(6) below and output variable R1 (efficiency) using the SCAPS-1D simulation for the RSM.
 | (4) |
 | (5) |
 | (6) |
After the simulation of all these row runs and getting their corresponding efficiency using SCAPS-1D, the input parameters and the calculated efficiency results are co-related in the mathematical polynomial formula with the best fit. The magnitude sequence of the coefficients of the polynomial formula of the RSM reflects the sensitivity of the corresponding variables and interactions like least sensitive, sensitive, and highly sensitive variables/parameters. One can find an optimal combination of these parameters/variables in the range of parameters to achieve maximum efficiency. From the utilization of the CCD and RSM, one can easily find more detailed information about the effects of the variables/parameters on efficiency.
In this paper, we run the 5 variables of the SnSe/TiO2/SnO2-based solar cell: band gap, shallow uniform acceptor density, CBO, the device's operating temperature and work function of the back contact. Using the CCD design arrangement (alpha = face-centred, centre point 8, 5 variables), 50 simulation runs are listed in Table S2 (ESI†). All 50 simulation runs are simulated in the SCAPS-1D software to get the corresponding efficiency values listed in the last column of Table S3 (ESI†) as the response (R1). The input and response values of the 50 simulation runs shown in Table S3 (ESI†) below are fitted with a quadratic polynomial formula model that provides a prediction equation of the response (R1 here efficiency) from the various input parameters of the solar cell, which is given by
| η = 19.86 − 3.71x1 + 0.4618x2 + 0.2210x3 + 5.46x4 − 0.6498x5 − 0.3125x1x3 − 0.4744x1x4 + 0.2338x1x5 − 0.2675x2x4 − 0.2513x3x5 − 0.4679x1x1 − 0.4639x2x2 − 0.8615x3x3 | (7) |
From eqn (7), it can be seen that the work function of the back contact (z4/x4) has the largest effect on the efficiency, while the band gap (z1/x1), operating temperature (z5/x5), shallow acceptor density of states (z2/x2), and conduction band offset (z3/x3), are the second, third, fourth, and fifth largest impacting parameters to the efficiency of solar cell. Also, when the band gap (z1/x1) and operating temperature of the device (z5/x5) increase, the efficiency will increase, while increasing the other two parameters (i.e. x1·x3, x1·x4, x2·x4, and x3·x5) results in decreasing efficiency. Linear coupling terms such as coupling (x1x4) of the band gap of the absorber material (z1/x1) and work function of the back contact (z4/x4), and coupling (x1x5) of the band gap (z1/x1) and operating temperature of the device (z5/x5) have the most impact and least impact on the efficiency, respectively.
ANOVA analysis of the RSM
To validate the RSM, the analysis of variance (ANOVA) test can be applied.44 The F-value and p-value are the test indicators of the regression model and its terms. The F-value should be as large as possible, and the p value should be as small as possible (<0.05 at least), respectively, for the RSM and its terms to be valid. The ANOVA analysis results are listed in Table 2.| Source | Sum of squares | df | Mean square | F-value | p-value | |
|---|---|---|---|---|---|---|
| p-values less than 0.0500 indicate the model terms are significant. In this case there are significant model terms. Values greater than 0.1000 indicate the model terms are not significant. If there are many insignificant model terms (not counting those required to support hierarchy), model reduction may improve your model. The model F-value of 213.28 implies the model is significant. There is only a 0.01% chance that an F-value this large could occur due to noise. | ||||||
| Model | 1676.40 | 13 | 128.95 | 213.28 | <0.0001 | Significant |
| x 1 − x1 | 507.36 | 1 | 507.36 | 839.13 | <0.0001 | |
| x 2 − x2 | 7.87 | 1 | 7.87 | 13.01 | 0.0009 | |
| x 3 − x3 | 1.80 | 1 | 1.80 | 2.98 | 0.0929 | |
| x 4 − x4 | 1098.70 | 1 | 1098.70 | 1817.15 | <0.0001 | |
| x 5 − x5 | 15.58 | 1 | 15.58 | 25.77 | <0.0001 | |
| x 1·x3 | 3.13 | 1 | 3.13 | 5.17 | 0.0291 | |
| x 1·x4 | 7.20 | 1 | 7.20 | 11.91 | 0.0014 | |
| x 1·x5 | 1.75 | 1 | 1.75 | 2.89 | 0.0977 | |
| x 2·x4 | 2.29 | 1 | 2.29 | 3.79 | 0.0595 | |
| x 3·x5 | 2.02 | 1 | 2.02 | 3.34 | 0.0759 | |
| x 1 2 | 3.21 | 1 | 3.21 | 5.31 | 0.0271 | |
| x 2 2 | 3.15 | 1 | 3.15 | 5.22 | 0.0284 | |
| x 3 2 | 10.38 | 1 | 10.38 | 17.17 | 0.0002 | |
| Residual | 21.77 | 36 | 0.6046 | |||
| Lack of fit | 21.77 | 29 | 0.7506 | |||
| Pure error | 0.0000 | 7 | 0.0000 | |||
| Cor total | 1698.17 | 49 | ||||
A scattering of the values around the mean is indicated by the R2 value 0.9872 (which should be close to 1). The difference between adjusted R2 (=0.9826) and predicted R2 (=0.9726) should be reasonable if the difference value is less than 0.2. All statistical values show a good fit for the model. From Table 2, it can also be inferred that the individual terms/variables having high F-values and low p-values have a larger influence on efficiency than the other terms/variables. So, from Table 2, the F-value of the work function of the back contact (z4/x4) has the highest value of 1817.15 and p < 0.0001, followed by that of the band gap (z1/x1) with F-value = 839.13, p < 0.0001, then that of the operating temperature of the device (z5/x5) with F-value = 25.77, p < 0.0001.
The coupling term (x1x4) of the band gap of the absorber material (x1) and work function of the back contact (x4) with an F-value of 11.19 is the interaction term with the largest impact on the efficiency, followed by that (x1x3) of the band gap (x1) and CBO (x3) with F-value = 5.17, p = 0.029, then that (x2x4) of the shallow acceptor density of states (x2) and work function of the back contact (x4) with F-value = 3.79, p = 0.0595. All inferences from the ANOVA test results are in agreement with those from the RSM equation. The ANOVA test results validated the RSM in eqn (7), and the sensitivity analysis was based on the magnitude sequence of the coefficients of the individual terms in eqn (7).
The efficiencies obtained by the RSM and the simulation by SCAPS-1D are compared, and their residuals are shown in Fig. 2 below. The scattered data in Fig. 2 show the simulated or actual efficiencies obtained by SCAPS-1D in the x-axis and the predicted efficiencies by the RSM in the y-axis, showing a good correlation of both.
 | ||
| Fig. 2 The efficiencies of the solar cell predicted by the RSM and simulated by SCAPS-1D software. | ||
Parameter optimization for the maximum efficiency and validation
Eqn (7) is used to find the optimal input parameter combination for the maximum R1 using the Design Expert software. The results are listed in Table 3. The optimal input parameter combination gives an efficiency (R) value of 29.01%, as shown in Fig. 3 and listed in Table 3.| (A) Band gap (eV) | 1 |
| (B) Shallow uniform acceptor density of the absorber (cm−3) | 2.89 × 10¹⁶ |
| (C) CBO (eV) | 0.164 |
| (D) Work function of the back contact (eV) | 5.399 |
| (E) Temperature (K) | 300 |
| (R1) Optimized efficiency by RSM (%) | 29.01 |
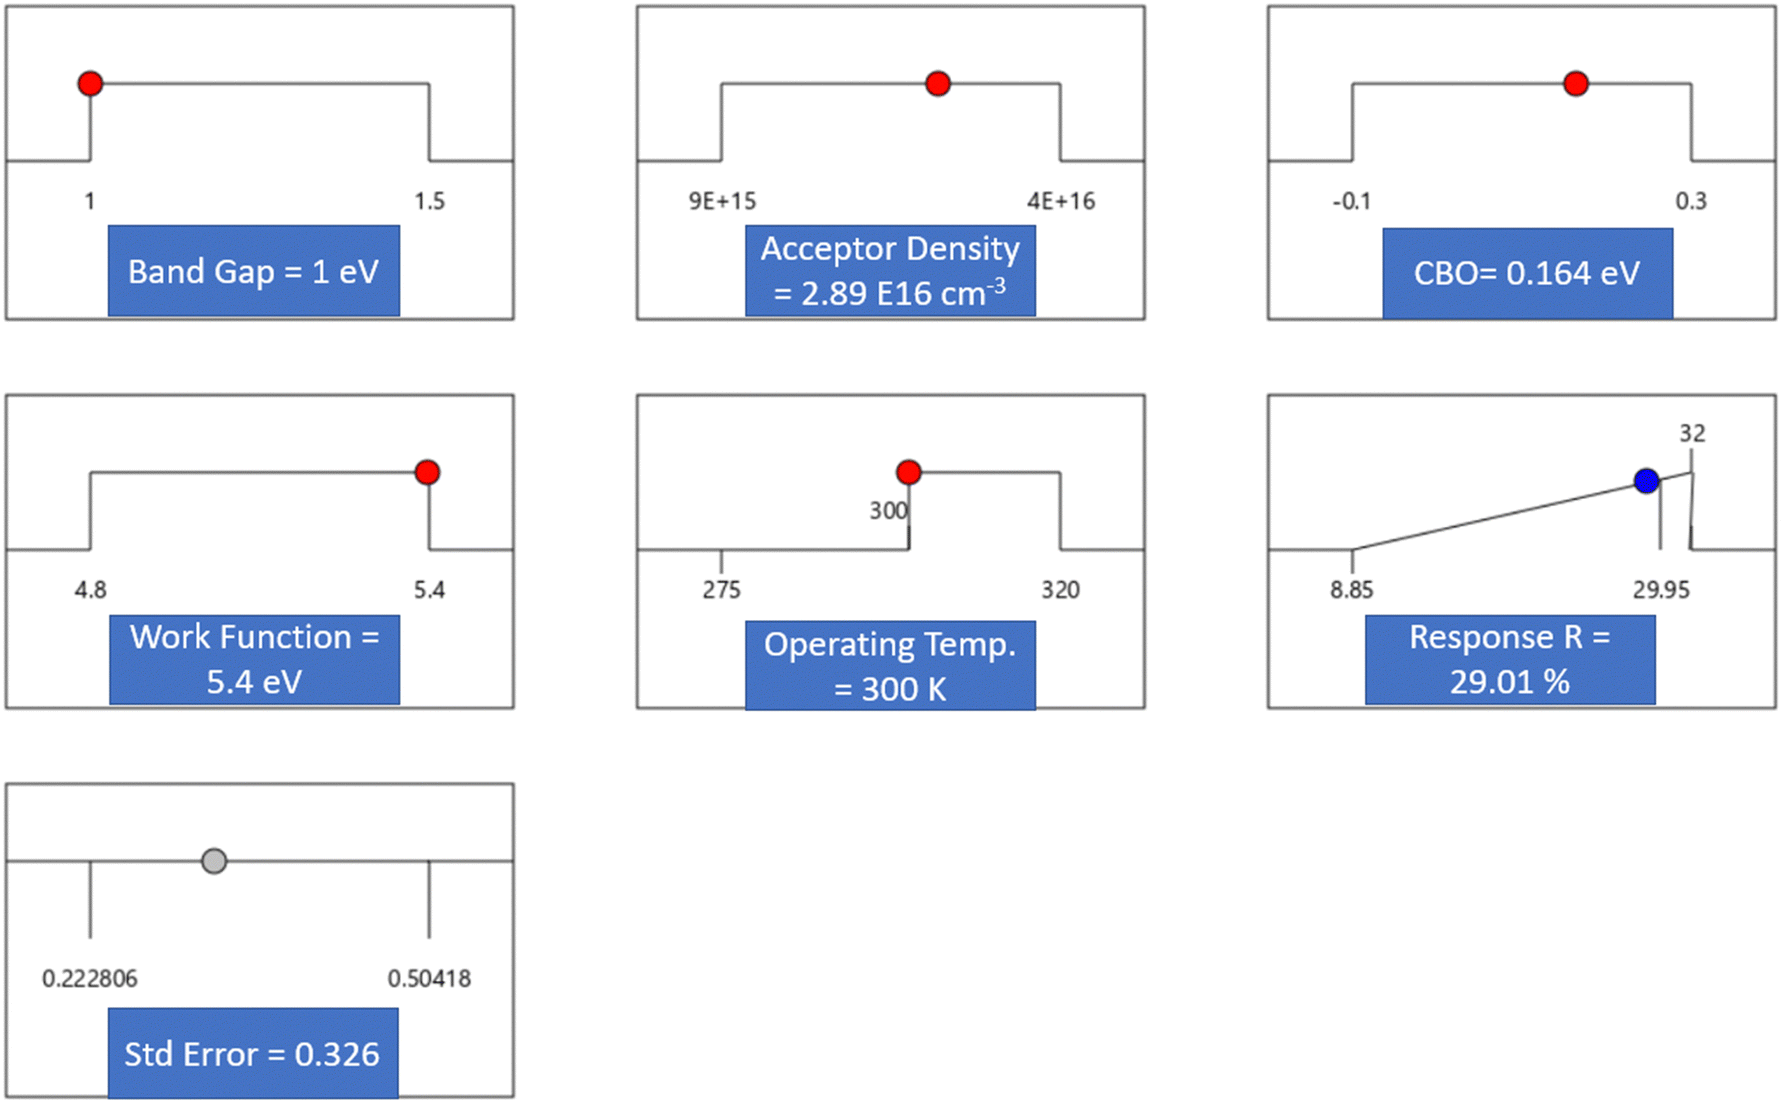 | ||
| Fig. 3 Optimal input parameters using RSM (design expert panel) for the maximum efficiency of 29.01%. | ||
The same optimal input parameter values are used as input of the SCAPS-1D software, and a simulation is run in the software; an efficiency of 28.45% is obtained for the input parameters, as shown in Fig. 4.
 | ||
| Fig. 4 The output panel of the SCAPS-1D showing the open circuit voltage, short circuit current, fill factor, and efficiency. | ||
Input values of the SnSe and TiO2 are shown in Fig. S2 (ESI†). Both the efficiency values predicted by the RSM (eqn (7)) and the SCAPS-1D software are very close (within 1.93% error), and hence the optimization result of the RSM has been verified by the SCAPS-1D software simulation. A formal intuition into the simple variation and chosen optimum values of the variables led to the maximum value efficiency of 20.74%, while the RSM enabled through CCD runs provides the global maxima of the efficiency function i.e. 29.01%. Hence, the proposed CCD and RSM modelling approach enables the SCAPS-1D software to find the real potential of the material.
Conclusions
In conclusion, this study introduces a comprehensive approach to optimizing solar cell performance through parameter sensitivity analysis and response surface modeling. By integrating central composite design (CCD) and response surface methodology (RSM), the research identifies optimal parameter combinations and validates the efficiency predictions using SCAPS-1D simulations. The close agreement between the efficiency values predicted by the RSM and those obtained from SCAPS-1D software demonstrates the effectiveness of the proposed methodology in predicting solar cell efficiency with a high degree of accuracy.Furthermore, the proposed method enables the SCAPS-1D software to unlock the true potential of solar cell materials by systematically arranging input parameters and refining optimization results through RSM. This approach streamlines the optimization process and minimizes material wastage during synthesis, saving valuable time and energy resources. The sensitivity analysis conducted through RSM provides valuable insights into parameter interactions, enhancing the understanding of factors influencing solar cell efficiency.
By validating the RSM through ANOVA tests, this research underscores the precision and reliability of the proposed methodology in optimizing solar cell structures for maximum performance. The findings of this study contribute to advancing the field of solar cell simulation by offering a systematic and efficient approach to predicting and enhancing solar cell efficiency. Overall, integrating CCD, RSM, and SCAPS-1D software presents a promising avenue for future research in optimizing solar cell performance and realizing the full potential of solar cell materials.
Contributions
Manoj Kumar was involved in conceptualization, investigation, methodology, writing – original draft, and writing – reviewing and editing. Sanju Rani was responsible for conceptualization, formal analysis, investigation, software, writing – original draft, and writing – reviewing and editing. Vidya Nand Singh contributed to funding acquisition, supervision, reviewing, and editing. Xu Wang took part in conceptualization, formal analysis, investigation, supervision, reviewing, and editing.Data availability
Data will be made available on request.Conflicts of interest
The authors declare that they have no known competing financial interests or personal relationships that could have appeared to influence the work reported in this paper.Acknowledgements
The authors extend their gratitude to the RMIT-AcSIR Joint Research Program for financial support.References
- Y. Singh, M. Kumar, R. Yadav, A. Kumar and S. Rani, Solar Energy Materials and Solar Cells Enhanced photoconductivity performance of microrod-based Sb2Se3 device, Sol. Energy Mater. Sol. Cells, 2022, 243, 111765, DOI:10.1016/j.solmat.2022.111765.
- Mamta, K. K. Maurya and V. N. Singh, Sb2Se3versus Sb2S3 solar cell: A numerical simulation, Sol. Energy, 2021, 228(August), 540–549, DOI:10.1016/j.solener.2021.09.080.
- A. Talhi, A. Belghachi, H. Moughli, B. Amiri and L. Varani, Numerical simulation of multi-quantum well solar cells GaAs/InAs using silvaco atlas, Dig. J. Nanomater. Biostructures, 2016, 11(4), 1361–1366 Search PubMed.
- M. Filipič, et al., Electrical and optical simulation of nPERT solar cells with epitaxially grown emitters, Energy Procedia, 2017, 124, 38–46, DOI:10.1016/j.egypro.2017.09.337.
- A. Bala Sairam, Y. Singh, Mamta, M. Kumar, S. Rani and V. N. Singh, Investigation of Different Configurations in GeSe Solar Cells for Their Performance Improvement, J. Nanomater., 2023, 2023, 9266072, DOI:10.1155/2023/9266072.
- M. Kumar, S. Rani, P. Vashishtha, G. Gupta, X. Wang and V. N. Singh, Exploring the optoelectronic properties of SnSe: a new insight, J. Mater. Chem. C, 2022, 10(44), 16714–16722, 10.1039/d2tc03799h.
- A. Bhowmik, A. T. Abir, M. A. H. Pappu, S. C. Das, B. K. Mondal and J. Hossain, Modeling and efficiency enhancement of SnSe thin film solar cell with a thin CIS layer, Results Mater., 2024, 21, 100521, DOI:10.1016/j.rinma.2023.100521.
- S. N. F. Zainudin, M. Markom, H. Abdullah, R. Adami and S. M. Tasirin, Optimized synthesis and photovoltaic performance of TiO2 nanoparticles for dye-sensitized solar cell, Particuology, 2013, 11(6), 753–759, DOI:10.1016/j.partic.2012.07.010.
- M. N. Mustafa, S. Shafie, M. H. Wahid and Y. Sulaiman, Optimization of power conversion efficiency of polyvinyl-alcohol/titanium dioxide as light scattering layer in DSSC using response surface methodology/central composite design, Results Phys., 2019, 15, 102559, DOI:10.1016/j.rinp.2019.102559.
- S. B. Patel and J. V. Gohel, Optimization of sol–gel spin-coated Cu2ZnSnS4 (CZTS) thin-film control parameters by RSM method to enhance the solar cell performance, J. Mater. Sci., 2018, 53(17), 12203–12213, DOI:10.1007/s10853-018-2464-4.
- I. Seok, H. J. Kim and G. Byun, Structural optimization of a Cu(In,Ga)Se 2 thin film solar cell using numerical simulation and design of experiment techniques, J. Mech. Sci. Technol., 2012, 26(8), 2557–2563, DOI:10.1007/s12206-012-0637-7.
- R. Suliman, A. F. Mitul, L. Mohammad, G. Djira, Y. Pan and Q. Qiao, Modeling of organic solar cell using response surface methodology, Results Phys., 2017, 7, 2232–2241, DOI:10.1016/j.rinp.2017.04.037.
- A. R. Mohammed and I. S. Fahim, “Tandem Organic Solar Cell Optimization Using Response Surface Methodology,” 2020 Int. Conf. Data Anal. Bus. Ind. W. Towar. a Sustain. Econ. ICDABI 2020, pp. 0–4, 2020 DOI:10.1109/ICDABI51230.2020.9325624.
- B. R. Hunde and A. D. Woldeyohannes, Performance analysis and optimization of perovskite solar cell using SCAPS-1D and genetic algorithm, Mater. Today Commun., 2023, 34, 105420, DOI:10.1016/j.mtcomm.2023.105420.
- B. Singh, et al., Performance Improvement and Optimisation Using Response Surface Methodology (Central Composite Design) of Solar Photovoltaic Module with Reflector and Automatic Water Cooling, Process Integr. Optim. Sustain., 2023, 7(1–2), 343–357, DOI:10.1007/s41660-022-00296-6.
- R. Suliman, Response Surface Methodology and Its Application in Optimizing the Efficiency of Organic Solar Cells, PhD thesis, South Dakota State University, 2017, https://openprairie.sdstate.edu/etd/1734.
- E. Barrios-Salgado, M. T. S. Nair and P. K. Nair, Chemically Deposited SnSe Thin Films: Thermal Stability and Solar Cell Application, ECS J. Solid State Sci. Technol., 2014, 3(8), Q169–Q175, DOI:10.1149/2.0131408jss.
- N. E. Makori, I. A. Amatalo, P. M. Karimi and W. K. Njoroge, Optical and Electrical Properties of SnSe Thin Films for Solar Cell Applications, Am. J. Condens. Matter. Phys., 2014, 4(5), 87–90, DOI:10.5923/j.ajcmp.20140405.01.
- Z. Li, et al., Effect of film thickness and evaporation rate on co-evaporated SnSe thin films for photovoltaic applications, RSC Adv., 2020, 10(28), 16749–16755, 10.1039/d0ra01749c.
- U. Parihar, R. Kumar, K. J. Patel, C. J. Panchal and N. Padha, Effect of Film Thickness on Optical Properties of Tin Selenide Thin Films Prepared by Thermal Evaporation for Photovoltaic Applications, Am. J. Mater. Sci., 2012, 2(1), 41–45, DOI:10.5923/j.materials.20120201.08.
- N. Shahzad, et al., Annealed Tin Selenide (SnSe) Thin Film Material For Solar Cell Application, Chalcogenide Lett., 2020, 17(7), 347–351 CrossRef CAS.
- M. Kumar, S. Rani, A. Kumar, J. Tawale and R. Srivastava, Broadband (NIR-Vis-UV) photoresponse of annealed SnSe films and effective oxidation passivation using Si protective layer, Mater. Res. Bull., 2022, 153, 111913, DOI:10.1016/j.materresbull.2022.111913.
- M. Kumar, S. Rani, Y. Singh, S. Gour and V. Nand, Tin-selenide as a futuristic material: properties and applications, RSC Adv., 2021, 11, 6477–6503, 10.1039/D0RA09807H.
- M. Kumar, et al., Detrapping of the carriers from shallow states in a highly responsive, fast, broadband (UV-vis-NIR), self-powered SnSe/Si photodetector with asymmetric metal electrodes, Mater. Adv., 2024, 5(8), 3220–3227, 10.1039/d3ma01127e.
- G. Duvjir, et al., Origin of p-type characteristics in a SnSe single crystal, Appl. Phys. Lett., 2017, 110, 262106, DOI:10.1063/1.4991003.
- Y. Zhou, et al., Influence of defects on the thermoelectricity in SnSe: A comprehensive theoretical study, Phys. Rev. B:Condens. Matter Mater. Phys., 2018, 97(24), 1–8, DOI:10.1103/PhysRevB.97.245202.
- E. K. Chere, Q. Zhang, K. Dahal, F. Cao, J. Mao and Z. Ren, Studies on thermoelectric figure of merit of Na-doped p-type polycrystalline SnSe, J. Mater. Chem. A, 2016, 4(5), 1848–1854, 10.1039/c5ta08847j.
- V. Q. Nguyen, et al., Unidentified major p-type source in SnSe: Multivacancies, NPG Asia Mater., 2022, 14, 42, DOI:10.1038/s41427-022-00393-5.
- R. K. Yadav, et al., A qualitative study of SnSe thin film solar cells using SCAPS 1D and comparison with experimental results: A pathway towards 22.69% efficiency, Sol. Energy Mater. Sol. Cells, 2022, 244, 111835, DOI:10.1016/j.solmat.2022.111835.
- N. K. Singh, S. Bathula, B. Gahtori, K. Tyagi, D. Haranath and A. Dhar, The effect of doping on thermoelectric performance of p-type SnSe: Promising thermoelectric material, J. Alloys Compd., 2016, 668, 152–158, DOI:10.1016/j.jallcom.2016.01.190.
- G. Jeong, et al., Preparation of single-phase SnSe thin-films and modification of electrical properties via stoichiometry control for photovoltaic application, J. Alloys Compd., 2017, 722, 474–481, DOI:10.1016/j.jallcom.2017.06.094.
- H. B. Michaelson, The work function of the elements and its periodicity, J. Appl. Phys., 1977, 48(11), 4729–4733, DOI:10.1063/1.323539.
- J. L. Gray, The Physics of the Solar Cell, 2011 DOI:10.1002/9780470974704.ch3.
- G. Shi and E. Kioupakis, Quasiparticle band structures and thermoelectric transport properties of p-type SnSe, J. Appl. Phys., 2015, 117, 065103, DOI:10.1063/1.4907805.
- Y. Fang, et al., Ultrafast bulk carrier recombination transients in n-type and semi-insulating 4H-SiC crystals, Appl. Phys. Lett., 2018, 112, 201904, DOI:10.1063/1.5025590.
- M. Kumar, et al., Low bias operated, fast response SnSe thin-film Vis-NIR photodetector on glass substrate using one-step thermal evaporation technique, J. Alloys Compd., 2021, 879, 160370, DOI:10.1016/j.jallcom.2021.160370.
- T. Trupke, M. A. Green, P. P. Altermatt, A. Wang, J. Zhao and R. Corkish, Temperature dependence of the radiative recombination coefficient of intrinsic crystalline silicon, J. Appl. Phys., 2003, 94(8), 4930–4937, DOI:10.1063/1.1610231.
- P. J. Bishop, M. E. Daniels, B. K. Ridley and K. Woodbridge, Radiative recombination in GaAs/AlxGa1−xAs quantum wells, Phys. Rev. B, 1992, 45, 6686–6691, DOI:10.1103/PhysRevB.45.6686.
- Y.-R. Chang, T. Nishimura and K. Nagashio, Thermodynamic Perspective on the Oxidation of Layered Materials and Surface Oxide Amelioration in 2D Devices, ACS Appl. Mater. Interfaces, 2021, 13, 43282–43289, DOI:10.1021/acsami.1c13279.
- M. Burgelman, P. Nollet and S. Degrave, Modelling polycrystalline semiconductor solar cells, Thin Solid Films, 2000, 361, 527–532, DOI:10.1016/S0040-6090(99)00825-1.
- K. Decock, S. Khelifi and M. Burgelman, Modelling multivalent defects in thin film solar cells, Thin Solid Films, 2011, 519(21), 7481–7484, DOI:10.1016/j.tsf.2010.12.039.
- M. Burgelman, K. Decock, S. Khelifi and A. Abass, Advanced electrical simulation of thin film solar cells, Thin Solid Films, 2013, 535, 296–301 CrossRef CAS.
- Response Surface Methodology in Engineering Science, ed. P. Kayaroganam, IntechOpen, 2021, DOI:10.5772/intechopen.90965.
- S. Pathak, R. Zhang, K. Bun, H. Zhang, B. Gayen and X. Wang, Development of a novel wind to electrical energy converter of passive ferrofluid levitation through its parameter modelling and optimization, Sustain. Energy Technol. Assess., 2021, 48, 101641, DOI:10.1016/j.seta.2021.101641.
Footnote |
| † Electronic supplementary information (ESI) available. See DOI: https://doi.org/10.1039/d4ma00728j |
| This journal is © The Royal Society of Chemistry 2025 |