
 Open Access Article
 This Open Access Article is licensed under a
 Creative Commons Attribution 3.0 Unported Licence
Prospective life cycle assessment of organic redox flow batteries†
Shan
Zhang
 *a,
Athul Seshadri
Ramanujam
bcd,
Rickard
Arvidsson
e,
Alessandro
Michieletto
fg and
Ulrich S.
Schubert
fgh
*a,
Athul Seshadri
Ramanujam
bcd,
Rickard
Arvidsson
e,
Alessandro
Michieletto
fg and
Ulrich S.
Schubert
fgh
aDepartment of Energy and Technology, Swedish University of Agricultural Sciences, P.O Box 7032, SE-75007 Uppsala, Sweden. E-mail: shan.zhang@chalmers.se
bElectrochemical Processes Unit, IMDEA Energy, Avda. Ramón de la Sagra 3, 28935 Móstoles, Spain
cEnergy Storage Solutions E22, Avenida de Barajas 32, Parque Empresarial Omega Edificio A, 28108 Alcobendas, Spain
dDepartment of Applied Chemistry, Faculty of Chemistry, University of the Basque Country UPV/EHU, Avda. Manuel de Lardizabal 3, 20018 Donostia-San Sebastián, Spain
eDivision of Environmental Systems Analysis, Department of Technology Management and Economics, Chalmers University of Technology, Gothenburg 41296, Sweden
fLaboratory of Organic and Macromolecular Chemistry (IOMC), Friedrich Schiller University Jena, Humboldtstraße 10, 07743 Jena, Germany
gCenter for Energy and Environmental Chemistry Jena (CEEC Jena), Friedrich Schiller University Jena, Philosophenweg 7a, Jena 07743, Germany
hHelmholtz Institute for Polymers in Energy Applications Jena (HIPOLE Jena), Lessingstrasse 12-14, Jena 07743, Germany
First published on 7th March 2025
Abstract
Redox flow batteries (RFBs) are considered a promising technology for stationary energy storage. Organic redox flow batteries (OFBs) are emerging as alternatives to vanadium redox flow batteries (VFBs), since the former consist of cheap and abundant organic materials with the potential to offer lower environmental impacts. Despite numerous life cycle assessment (LCA) studies of VFBs, there is a lack of LCAs of OFBs. In this study, this gap is addressed by an LCA of an OFB and a hybrid redox flow battery (HFB) based on TEMPO electrolytes. A battery design model and a battery performance model were established to provide part of the inventory data required for the LCA. Compared to VFBs, OFBs and HFBs demonstrated superior cradle-to-gate environmental performance for acidification, human toxicity (carcinogenic), and particulate matter, but inferior performance for climate impact, freshwater ecotoxicity, and resource depletion. The primary environmental hotspots associated with battery production were electrolyte active materials, inverters, and end plates. The cradle-to-use environmental impact results showed that the OFB outperformed the VFB and HFB, primarily because the OFB's low electrolyte capacity fade rate leads to reduced electrolyte consumption during use. Sensitivity analysis indicates that future research should prioritize improvements to the electrolyte capacity fade rate. Given the early development stage of OFB and HFB technologies, there is potential to improve them further into more environmentally friendly energy storage systems.
Broader contextTo support the European Commission's green deal objectives, decarbonizing electricity sources is essential, with an emphasis on integrating renewable energies. This transition drives the development of safe, cost-effective stationary electrochemical energy storage systems. Among these, organic electrolyte-based redox flow batteries are attracting attention from researchers and industry as a promising solution. Despite their potential, the environmental impacts of these technologies remain inadequately addressed. This study conducts a comprehensive environmental assessment of two redox flow batteries with TEMPO-based electrolytes using life cycle assessment (LCA). We developed a battery design model based on industrial equations and a performance model that accounts for electrolyte degradation during the use phase. Furthermore, uncertainty and sensitivity analyses identify the most influential battery performance parameters affecting the LCA results. Redox flow batteries with TEMPO-based electrolytes are found to be promising in cradle-to-use LCA results. The findings also identify opportunities to improve environmental performance by reducing electrolyte capacity fade. The results serve as benchmarks for future research and support ongoing efforts to reduce the environmental footprint of organic redox flow batteries. |
1. Introduction
Society undergoes a rapid energy transition from the use of fossil fuels to renewable energy sources, such as wind and solar power. Based on current policies and market development, the International Energy Agency (IEA) predicts that renewables will be the largest electricity source globally by 2025, accounting for over 90% of global electricity capacity expansion.1 Bogdanov et al. (2019) suggested that solar photovoltaics (PV) and wind are going to be the main electricity generation technologies to achieve a 100% renewable electricity system by 2050.2 However, the intermittent nature of these renewable energy sources poses a challenge for maintaining a stable and uninterrupted electricity supply.3 Moreover, the demand to reduce electricity costs and the availability of government incentives for solar and battery storage systems are driving the rapid development of residential battery energy storage systems.4–6 For instance, in Germany and Italy, over 70% of home solar systems now include batteries, significantly reducing the need for grid upgrades.4 This highlights the importance of residential-scale energy storage solutions in optimizing the use of renewable energy technologies. Redox flow batteries (RFBs) constitute a potential solution for stationary and household energy storage because of their unique ability to tailor power and energy separately, coupled with their prolonged lifespan, minimal self-discharge, and robust safety features.7,8 Among the range of RFBs, the vanadium redox flow battery (VFB) is a well-established type that has been commercially utilized for several decades.7 Despite its high level of maturity, the widespread adoption of VFBs is constrained by high upfront costs and the volatile supply of vanadium.9–11 These challenges have encouraged researchers to investigate new charge-storage materials based on abundant elements, such as organic compounds. Reflecting this shift, several companies, including CMBlu, Kemiwatt, Redflow, and e-Zinc, are now actively working to commercialize organic flow batteries (OFBs) and hybrid flow batteries (HFBs).Among different organic components, anthraquinone (AQ) derivatives, 2,2,6,6-tetramethylpiperidine-1-oxyl (TEMPO) based organic molecules, and viologens have been widely explored as promising energy storage materials. AQ derivatives features with their reversible two-electron redox reaction (AQ/AQ−/AQ2−), high chemical stability, and large molecular structure that can suppress crossover.12 AQ derivatives often perform effectively in acidic or alkaline conditions,13–16 and significant research efforts have been made to develop AQ derivatives stable in neutral pH environment.13,17,18 TEMPO-based organic materials have also attracted significant attention as electrolyte candidate for RFBs.13,19,20 TEMPO-based nitroxide radicals and viologen are particularly promising pairs for RFB applications, as they can operate effectively at neutral pH, achieve high concentrations, and deliver relatively high potentials in aqueous solutions, bringing TEMPO/viologen systems closer to industrial implementation.9,10,13
Given the increasing interest in TEMPO-based RFBs, environmental assessment studies on such systems remain limited. To date, most life cycle assessment (LCA) studies have focused on VFBs,21–25 with one study assessing an AQ-based HFB26 and another evaluating TEMPO-based OFB.27 Moreover, data for battery composition and performance are often derived from simplified estimations. This study aims to evaluate the environmental performance of two emerging TEMPO-based RFBs: an all-organic redox flow battery (OFB) and a hybrid redox flow battery (HFB), using LCA combined with battery design and performance models. The battery design and performance model was developed under the assumption that these two emerging batteries are already being produced at an industrial scale. Additionally, this study aims to identify key battery performance parameters that contribute to uncertainties in the environmental impact results. The environmental performance of OFB and HFB was benchmarked against VFBs. These results can help guide flow battery developers and companies in improving the environmental performance of these technologies and serve as a benchmark for future LCA studies of OFBs.
2. Materials and methods
The methodological framework, as depicted in Fig. 1, consists of three core components: (i) a battery design model (green dashed-line box), (ii) a battery performance model (blue dashed-line box), and (iii) a LCA model (purple dashed-line box). The outputs of the battery design model (dark green box) and the battery performance model (dark blue boxes) serve as inputs for the LCA model. Various parameters (yellow boxes) are required as inputs for these models. Subsequently, a LCA is performed to quantify the environmental impacts of the three studied RFBs (OFB, HFB and VFB). This section is structured as follows: the battery technology is first described (section 2.1), followed by the battery performance (section 2.2), and the LCA phases (section 2.3). This study includes the four key LCA phases: goal and scope definition (section 2.3.1), life cycle inventory analysis (LCI) (section 2.3.2), life cycle impact assessment (LCIA) (section 2.3.3), and interpretation (section 2.3.4). As part of the interpretation, an uncertainty analysis (UA) and sensitivity analysis (SA) are performed to quantify uncertainty in the model's results and to identify the battery performance-related parameters that contribute the most to it28 (yellow boxes with bold black texts). | ||
| Fig. 1 Methodological framework schematic. Yellow boxes denote input data for sub-models, with those featuring bold black text signifying parameters included in the SA. Blue, green, and purple dashed-line boxes correspond to the battery performance model, battery design model, and LCA model, respectively. Dark blue, dark green and dark purple boxes represent the respective model outputs. | ||
2.1 Redox flow battery design
This study developed a RFB design model to calculate the amounts of battery materials required for each component, ensuring a fair comparison between the three studied RFB types. The RFBs were designed with a power rating of 5 kW and a theoretical capacity of 40 kW h (i.e., an energy-power ratio of 8![[thin space (1/6-em)]](https://www.rsc.org/images/entities/char_2009.gif) :1). The intended application was a residential energy storage connected to rooftop solar systems. The RFBs comprise three main parts: a power subsystem (cell stack), an energy subsystem including electrolytes and container tanks, and a periphery with ancillary components (Fig. 2). The electrolytes stored in the tanks differ in terms of both the dissolved active materials and redox potentials. The electrolyte passing through the positive electrode is called posolyte, while the electrolyte passing through the negative electrode is called negolyte.
:1). The intended application was a residential energy storage connected to rooftop solar systems. The RFBs comprise three main parts: a power subsystem (cell stack), an energy subsystem including electrolytes and container tanks, and a periphery with ancillary components (Fig. 2). The electrolytes stored in the tanks differ in terms of both the dissolved active materials and redox potentials. The electrolyte passing through the positive electrode is called posolyte, while the electrolyte passing through the negative electrode is called negolyte.
 | ||
| Fig. 2 Schematic representation of a RFB stack and a conventional laboratory-scale breakdown of unit cell. | ||
The power subsystem consists of a single stack of unit cells connected in series. The number of unit cells and electrode sizes were determined based on rated power, discharge voltage, and current densities. Relevant data for the VFB were provided by the company Energy Storage Solutions S.L. (E22), while data for the OFB and HFB were collected from the literature, considering factors such as solubility of active species, operable current density, and long-term cycling stability.19,29 For example, different electrolyte concentrations were selected for the three studied flow battery systems based on values reported in long-term cyclability tests, as these concentrations represent the optimal balance between maximizing battery capacity and ensuring stable operation over extended cycles. Each unit cell includes an ion-exchange membrane, two graphite felt electrodes, two bipolar plates made of carbon-composite material serving as the contact between two cells in series, two copper current collectors acting as battery terminals, a plastic flow frame directing the electrolyte towards the felt, and two end plates compressing and sealing all battery components together. Details of the compositions are presented in Table 1.
| Component | VFB | OFB | HFB |
|---|---|---|---|
| MV = methyl viologen or N,N-dimethyl-4,4-bipyridinium dichloride. TEMPTMA = N,N,N-2,2,6,6-heptamethylpiperidinyl oxy-4-ammonium chloride. TEMPO-4-SO3K = 2,2,6,6-tetramethylpiperidone-4-sulfate potassium. | |||
| Power subsystem (cell stack) | |||
| Membrane | Nafion 212 | Fumasep FAA-3-PE-30 | Fumasep F-930-RFD |
| Bipolar plates | Graphite | ||
| Electrodes | Graphite felt | Graphite felt | Graphite felt & zinc foil |
| Current collector | Copper | ||
| Flow frames/current collector housing | Polypropylene | ||
| End plates | Aluminium | ||
| Seals | FKM rubber | ||
| Screws | Steel | ||
| Energy subsystem | |||
| Negolyte active material | 0.9 M V2O5 | 2 M MV | 2 M ZnCl2 |
| Posolyte active material | 0.9 M V2O5 | 2 M TEMPTMA | 1 M TEMPO-4-SO3K |
| Solvent | H2O | ||
| Additive 1 | 0.05 M H3PO4 | 0.3 M NaCl | 1 M NH4Cl |
| Additive 2 | 2.1 M H2SO4 | — | 2 M ZnCl2 |
| Tank | HDPE | ||
| Periphery | |||
| Pipes | Polyvinyl chloride | ||
| Pumps | Cast iron & steel | ||
| Inverters | Aluminium, copper, steel, polypropylene | ||
| Electrical cables | Copper | ||
In operation, RFBs function in two modes: charging, where they receive electricity from the PV panels, and discharging, where they supply electricity. An inverter converts the direct current (DC) produced by the cell stack into alternating current (AC) for households and vice versa. Negolyte and posolyte stored in container tanks are pumped through the stack, generating a potential difference between the membrane, which enables ion exchange but prevents electrolyte mixing.
Membrane, bipolar plate, and current collector areas were designed to be 20%, 10%, and 10% larger than the electrode area, respectively.30 Such design promotes optimal contact between the components and minimize electrolyte leakage.30,31 Additionally, electrolyte tanks were sized slightly larger than the electrolyte volume, with inert gas filling the surplus volume to prevent atmospheric oxygen contamination.32 The technical data and final battery compositions (in wt%) are presented in Table 2 and Fig. 3, respectively. The model equations used for calculating battery dimensions are from company E22, which cannot be presented for confidentiality reasons. The additional battery dimension results can be found in the ESI 1 (section S1†).
 | ||
| Fig. 3 Composition (in wt%) of three studied RFBs. | ||
| Technical parameters | VFB | OFB | HFB |
|---|---|---|---|
| Power (kW) | 5 | 5 | 5 |
| Theoretical capacity (kW h) | 40 | 40 | 40 |
| Energy density (W h kg−1) | 27 | 16 | 15 |
| Discharge voltage per cell (V) | 1 | 1 | 1.25 |
| Number of cells | 13 | 13 | 11 |
| Weight (kg) | 1476 | 2470 | 2616 |
2.2 Redox flow battery performance
The battery performance parameters can affect the total electricity delivered throughout the operational lifespan of the RFB, the electrolyte replacement frequency, and the electricity required during use. These factors could, in turn, influence the environmental impacts of RFBs. Battery performance parameters considered in this study are the energy efficiency (EE), operating state-of-charge range (ΔSoC), state-of-health (SOHlimit), and electrolyte degradation, specifically in terms of capacity fade per cycle (CF).3 EE in this study refers to the net round-trip efficiency, including the efficiency of power consumption of pumps, inverter, and transformer.33 ΔSoC refers to the ratio of its charged capacity each cycle to its theoretical capacity. SOHlimit represents the minimum allowable capacity relative to the original capacity, indicating the end-of-life (EoL) of electrolytes. The estimated value of each parameter for the studied RFBs and their respective probability density functions (PDFs) used in the sensitivity analysis were summarized in Tables 3 and 4. The most likely value in the PERT distribution was used as the estimated parameter value. High-performance laboratory data were used to estimate the potential performance that flow batteries could achieve at an industrial scale. References used to determine the parameter values can be found in the ESI 1 (section S2.2†).| Parameters | VFB | OFB | HFB |
|---|---|---|---|
| Energy efficiency (%) | 80 | 73 | 70 |
| Operating state-of-charge range (%) | 70 | 90 | 100 |
| State of health (%) | 73 | 73 | 73 |
| Capacity fade (% per cycle) | 0.07 | 0.037 | 0.085 |
| Parameters | VFB | OFB | HFB |
|---|---|---|---|
| Energy efficiency | Uniform (min: 50%, max: 90%) | Uniform (min: 50%, max: 90%) | Uniform (min: 50%, max: 90%) |
| Operating state-of-charge range | PERT (min: 60%, mode: 70%, max: 100%) | PERT (min: 60%, mode: 90%, max: 100%) | PERT (min: 60%, mode: 100%, max: 100%) |
| State of health | PERT (min: 65%, mode: 73%, max: 80%) | PERT (min: 65%, mode: 73%, max: 80%) | PERT (min: 65%, mode: 73%, max: 80%) |
| Capacity fade | PERT (min: 0%, mode: 0.07%, max: 0.1%) | PERT (min: 0%, mode: 0.037%, max: 0.1%) | PERT (min: 0%, mode: 0.085%, max: 0.1%) |
It was assumed in the battery performance model that the electrolyte tank, cell stack and peripheral components have a duration of 20 years for the three studied RFBs. This aligns with assumptions used in previous studies.21,22,34 Energy arbitrage using battery storage system usually assumes a daily cycling rate of around 1.35 An average daily cycling rate (n) of 1.12 cycles was expected for the three studied RFBs.36,37 Furthermore, it was assumed that each cycle leads to a specific degree of capacity fade in the electrolyte. Consequently, the electrolyte will be replaced when it reaches the predefined SoHlimit. This replacement practice continues until other battery components reach their EoL, i.e. after 20 years.
With the predefined cell stack lifetime Lstack and the average daily cycling rate n, the electrolyte replacement frequency (N) though the RFB's lifetime can be calculated as:
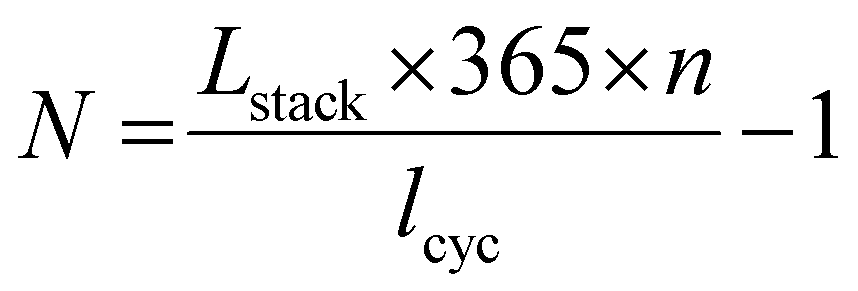 | (1) |
Note that the results for N were rounded up to the next integer for decimal values. lcyc is the number of cycles a RFB can perform without significant capacity loss or the number of cycles a RFB can reach before the electrolyte replacement, which can be calculated as:
| (1 − q)lcyc ≥ SOHlimit | (2) |
The cell stack and the periphery parts will reach their EoL at the same time or before the electrolytes reached their SOHlimit in the last electrolyte replacement round. Therefore, the number of cycles a RFB can perform after the last electrolyte replacement lcyc,last is less than or equal to lcyc, which can be calculated as:
| lcyc,last = Lstack × 365 × n − lcyc × N | (3) |
The total amount of energy that can be expected from a RFB over its lifespan (WB,total) can be calculated as:
| WB,total = WB,lcyc× N + WB,lcyc,last | (4) |
 | (5) |
 | (6) |
W 0B refers to the nominal capacity at the first charge–discharge cycle, which can be calculated as:
 | (7) |
ΔSoC and ηEE are the percentage of the capacity that the battery can deliver in each charging cycle and energy efficiency, respectively, of which the latter is calculated as:
 | (8) |
2.3 Life cycle assessment
As presented in eqn (9), the total impact for environmental category c with FU1 was calculated as the sum of the life cycle environmental impact scores (IS) associated with the RFB production, divided by the theoretical storage capacity. The total impact for environmental category c with FU2 was calculated as the sum of IS associated with battery production, electrolyte replacement and electricity losses in the use phase, divided by the lifetime electricity delivered by the RFBs (WB,total) (eqn (10) and (11)).
 | (9) |
 | (10) |
| ISc, use phase = ISc, electricity loss + ISc, electrolyte replacement | (11) |
The electricity used to power RFBs were from solar panels. Other electricity consumed in the foreground was the average European electricity mixture. Based on the time it took for the first generation of lithium-ion batteries to go from innovation to the market,41 and considering the fast development in battery technology, we estimated that the OFBs and HFBs could reach the highest TRL (i.e., 9) in the next decade, e.g., 2030–2035. The LCA was calculated using Brightway.42
The negolyte active material for the OFB, MV, was modelled using a LCI for bipyridylium-compound production (RER) from Ecoinvent 3.9. The LCI for the posolyte active materials of the OFBs and HFBs was established based on the production chain illustrated in Fig. 4. Initially, triacetone amine (TAA), a precursor for both posolyte active materials, was synthesized through the reaction of acetone and ammonia.47 For TEMPTMA, the posolyte active material of the OFB, production processes described by ref. 48 were followed: TAA was reacted with dimethylamine to yield 4-dimethylamino-2,2,6,6-etramethylpiperidine (intermediate 1). Intermediate 1 then reacted with chloromethane to form N,N,N-2,2,6,6-heptamethylpiperidin-4-ammonium chloride (intermediate 2). Subsequently, TEMPTMA was produced by reacting intermediate 2 with H2O2. To prepare the posolyte active material of the HFB, TEMPO-4-SO3K, TAA was first reduced by H2 to form 4-hydroxy-TEMP.49 Following this, 4-hydroxy-TEMPO was synthesized through the reaction with EDTA disodium salt dehydrate.50 Finally, TEMPO-4-SO3K was produced by reacting 4-hydroxy-TEMPO with concentrated sulfuric acid and KHCO3.29 Detailed descriptions of unit processes and energy consumption calculations are provided in ESI 1 (section S2), with the full inventory available in ESI 2.†
 | ||
| Fig. 4 Production process of electrolyte active materials. Intermediate 1 refers to 4-dimethylamino-2,2,6,6-etramethylpiperidine. Intermediate 2 refers to N,N,N-2,2,6,6-heptamethylpiperidin-4-ammonium chloride. 4-Hydroxy-TEMPO refers to 4-hydroxy-2,2,6,6-tetramethylpiperidine-N-oxyl. 4-Hydroxy-TEMP refers to 4-hydroxy-2,2,6,6-tetramethylpiperidine. TAA refers to 2,2,6,6-tetramethyl-4-piperidone/triacetone amine. | ||
The uncertainty analysis started by generating 1000 samples for each battery performance parameter based on their respective PDFs. These randomly generated samples were input into the battery performance model to produce intermediate parameters. These intermediate parameters were subsequently used in the LCA model to run Monte Carlos simulation, as implemented by the Python package presamples, to compute 1000 times of LCA using Brightway. The delta moment independent method proposed by Borgonovo53,54 was employed to evaluate the influence of battery performance parameters on the corresponding LCA results, using Python package SALib.55 The delta moment independent method quantifies the influence of a model's input uncertainties on the output uncertainty, taking into account the interactions between inputs. Unlike one-at-a-time (OAT) approaches, which vary one parameter at a time while keeping all other parameters constant, the delta method provides a more thorough analysis by allowing parameters to vary across their full distributions.56 Compared to other SA methods, such as Sobol method, delta method considers the uncertainties in input parameters on the entire distribution shape, rather than just on moments like variance.
3. Results and interpretation
3.1 Cradle-to-gate impacts
Fig. 5(a) displays the comparison of three studied RFBs using a FU of 1 kW h of theoretical storage capacity. Despite the significantly lower TRL of the OFB and HFB, they demonstrate lower impacts compared to the commercially available VFB for several impact categories. Fig. 5(b) presents the relative contribution of battery components. Overall, the energy subsystem, comprising the negolyte and posolyte active materials, additives, and electrolyte tank, is the primary contributor (58 to 96% of the total impacts) for three studied RFBs in most of the impact categories except resource depletion (11 to 51% of the total impact). This can be attributed to the high per-kg environmental impacts of the electrolyte active materials, as well as the relatively large quantities of electrolyte active materials used in the RFBs (15 to 28% of total weight, Fig. 3). While solvents (deionized water) account for 56 to 60% of the total weight of RFBs, their impacts were not considered in the analysis due to their negligible contributions (<0.1%). | ||
| Fig. 5 (a) Comparative environmental impacts of three RFBs, with a functional unit (FU1) of 1 kW h storage capacity. The impacts of VRB are set to 1.0 for comparison. (b) Breakdown of the environmental impacts from manufactering the three RFBs to battery components, with a FU of 1 kW h energy storage capacity. VFB = vanadium redox flow battery, OFB = organic redox flow battery, HFB = hybrid redox flow battery. | ||
In the HFB, the posolyte active material, TEMPO-4-SO3K, is the largest contributor, accounting for 40% of the total impact. This primarily stems from the production of 4-hydroxy-TEMPO (Fig. 4), which alone accounts for 24% of the total impact. Additional contributing chemicals include ethyl acetate (6%), sulfuric acid (4%), and acetone (2%). The cell stack (20%) is another key contributor, primarily due to the use of aluminium (13%) as the end plate material. Periphery components account for 19% to the impact, with the inverter circuit being the major factor, responsible for this high contribution (16%). ZnCl2, serving as both the negolyte active material and additive, accounts for 15% of the acidification. Due to the relatively lower acidification contribution from electrolyte active materials, the cell stack and periphery components of the HFB exhibit relatively higher contribution as compared to the OFB.
In the case of HFB, 59% of the impact can be attributed to the posolyte active material TEMPO-4-SO3K, driven by the high energy consumption (e.g., steam, heat, electricity) and the generation of substantial waste requiring treatment throughout the production chain. Additionally, 17% of the impact is associated with the cell stack, with 9% stemming from end plates, 4% from cell flow frames, and 3% from seals. Production of ZnCl2 accounts for approximately 8% of the climate change impact. Periphery components contribute 9% to the climate impact, with the inverter being the primary contributor.
For the HFB, the high freshwater ecotoxicity results can predominantly be traced to the use of ZnCl2 (52%) as both the negolyte active material and electrolyte additive. This impact can be linked to upstream processes associated with mining, processing and refining of the element zinc (51%), resulting in considerable emissions of hydrogen sulfide that impacts aquatic ecosystems. The use of TEMPO-4-SO3K (28%) as the posolyte material represents another major contributor, primarily due to the use of potassium bicarbonate as a raw material, as well as the related waste treatment processes. The periphery components account for 14% of the freshwater ecotoxicity, while the cell stack contributes 4%.
For the HFB, ZnCl2 emerges as the largest contributor, making up 32% of the human toxicity (carcinogenic). This dominance is mainly attributed to toxic emissions during zinc mining operations. The posolyte material TEMPO-4-SO3K follows as the second most significant contributor, accounting for 26% of the human toxicity (carcinogenic), followed by the cell stack (21%), and the periphery components (18%).
Additionally, for the OFB, approximately 18% of the impact is caused by the production of energy subsystem, which is due to the production of constructions such as buildings and chemical plants used for producing the precursor chemicals. Materials such as copper and gold used as construction materials lead to high resource depletion. For the HFB, the energy subsystem (51%) has similar contribution as the periphery components. This can be attributed to the use of ZnCl2 as both the negolyte active material and electrolyte additive in HFB, leading to a significantly higher metal resource depletion for the HFB compared to VFB and OFB.
3.2 Cradle-to-use impacts
In addition to the impacts of battery production, the cradle-to-use impacts of the RFBs considers impacts caused during battery use phase, including the electrolyte replacements over the battery lifetime, as well as electricity loss. The electrolyte replacement frequency, the total energy delivered throughout the battery's lifespan and the amount of electricity loss in use phase are calculated by the battery performance model, and the results are presented in Table 5.| VFB | OFB | HFB | |
|---|---|---|---|
| Electrolyte replacement frequency (times) | 18 | 9 | 22 |
| Number of cycles the flow battery can perform before electrolyte replacement (cycles) | 450 | 851 | 371 |
| Total energy delivery (MW h) | 157 | 185 | 196 |
The impacts per kW h of energy delivered over the lifetime (FU2) is shown in Fig. 6(a). In most impact categories, the OFB demonstrates superior performance compared to the VFB, except for freshwater ecotoxicity. This is due to the high freshwater ecotoxicity assocaited with the OFB's electrolyte active material and a large amount of electrolyte consumed in the use phase. When comparing the LCA reuslts with FU2 to FU1, the OFB exhibits better relative environmental performance among the studied RFBs. This can be attributed to its less frequent electrolyte replacements and the relatively higher lifetime energy delivered. In the comparison between FU2 and FU1 results for the HFB and VFB, the difference in environmental performance between the two batteries is enlarged across most impact categories. This is because electrolyte is the main contributor to the environmetal impacts of battery production across various impact categories, with electrolyte replacement considered in the FU2 further amplifying these impacts. Therefore, it is not suprising to observe a substantial increase in the relative contribution of electrolyte active materials in the LCA results with FU2 compared to FU1, regardless of battery chemistries and impact categories. The electrolyte active materials account for 80 to 97% of the total impacts in FU2 in most impact categories except resource depletion. Consequently, the relative contribution of power subsystem and periphery subsystem is reduced, and the hotspots are otherwise similar to those described in section 3.1. However, the electricity loss in the use phase emerges as an additional main contributor, especially for resource depletion. This is because the studied RFBs are asseumed to store electricity generated by rooftop photovoltaic systems, which require minerals like copper in their production processes.
 | ||
| Fig. 6 (a) Comparative environmental impacts of three RFBs, with a functional unit (FU2) of 1 kW h energy delivered over lifetime. The impacts of VRB are set to 1.0 for comparison. (b) Breakdown of environmental impacts from manufactering three RFBs to battery components, with a FU of 1 kW h energy delivered over lifetime. VFB = vanadium flow battery, OFB = organic flow battery, HFB = hybrid flow battery. | ||
3.3 Uncertainty analysis and sensitivity analysis
The results highlight CF as the predominant parameter contributing to the results uncertainty, regardless of battery chemistries and impact categories (Fig. 7). Moreover, the resource depletion results for the VFB also indicate significant contributions to uncertainty from other battery performance parameters. | ||
| Fig. 7 Sensitivity analysis results with delta sensitivity index. The index values represent contributions to uncertainty in the impact scores, with 0 being the lowest (negligible) contribution. | ||
4. Discussion
The lack of LCA studies on OFBs presents a challenge when searching for studies to compare with. Additionally, variations in FUs, LCIA methods, LCI databases, and assumptions regarding battery performance across previous studies make comparisons challenging. To ensure relevant comparisons, we converted all LCA results from previous studies to the same FU (per kW h energy storage, i.e. FU1), and converted our inventory to the same LCIA method used in the previous studies.First, we compared our VFB results with previous studies to ensure our benchmark falls in a plausible value range. When comparing to ref. 23, this study revealed results for acidification, climate impact, and human toxicity (carcinogenic) at 93%, 85%, and 73% of their findings, respectively. The disparities in these impact categories can be attributed to the updated background database used in our study. Furthermore, our comparison with57 yielded findings at 84%, 91%, 84%, 114%, and 97% of their results for impact categories acidification, climate change, human toxicity (carcinogenic), resource depletion, and particulate matter, respectively. Discrepancies may stem from them having a global scope, whereas we focused on Europe.
Subsequently, we compared our OFB and HFB results with non-VFBs, using our VFB as benchmark, as shown in Fig. 8. The differences in environmental performance among different flow batteries can be attributed to two factors: the use of different materials, and variations in specific energy. The first factor determines the environmental impacts per unit of material, while the later factor determines the amount of materials required for the selected FU (per kW h energy capacity). Note that higher specific energy indicates less quantity of materials needed per FU.
 | ||
| Fig. 8 Comparison with results from other studies. All results are converted to a functional unit of per kW h of energy capacity, using ReCiPe 2016 (H), then normalized based on the results of the VFB in this study for each impact categories. VFB = vanadium redox flow battery, OFB = organic redox flow battery, HFB = hybrid redox flow battery, LFB = lead redox flow battery, IFB = all-iron redox flow battery, ZBFB = zinc-bromine flow battery, BEDFB = bipolar electrodialysis flow battery. Inventory data are collected from ref. 58 (for LFB), ref. 26 (for semi-OFB), ref. 57 (for IFB and ZBFB), and ref. 37 (for BEDFB). | ||
Compared to another semi-organic battery (semi-OFB) with anthraquinone-based electrolyte materials, our two RFBs with TEMPO-based electrolytes demonstrated lower impacts, despite the semi-OFB's slightly higher specific energy (18.72 W h kg−1 for semi-OFB vs. 16 and 15 W h kg−1 for OFB and HFB, respectively). However, when compared to all-iron redox flow batteries (IFBs) and zinc-bromine redox flow batteries (ZBFBs), our OFBs and HFBs generally exhibited higher impacts, except for particulate matter, where the HFB had slightly lower impacts compared to the ZBFBs. This is due to the low environmental impacts associated to the production of electrolyte materials used in IFBs, and ZBFBs. In comparison to lead redox flow batteries (LFBs), HFBs and OFBs are outperformed across most impact categories, except for freshwater ecotoxicity and resource depletion. Notably, HFBs and OFBs showed the best performance among all batteries in the human toxicity (carcinogenic) impact category. However, it is important to bear in mind the high uncertainty associated with toxicity-related impact methods.59 BEDFBs performed best in acidification and climate impact among all batteries, although their human toxicity potential is 4–5 times higher than that of our RFBs.
It should to be noted that the absolute cradle-to-use (FU2) impacts of VFB are several times higher compared to previous studies.23,57 This discrepancy arises from our assumption regarding electrolyte degradation, which previous studies did not consider, as they assumed no degradation during the use phase. By incorporating electrolyte degradation and replacement in the use phase, our study reveals substantially higher environmental impacts. This highlights the need for recirculating flow battery electrolytes and developing effective recycling methods.
SA results highlight the high influence of the CF on the uncertainty in the LCA results. The CF directly affects electrolyte replacement frequency and total energy delivery over the battery's lifespan. A lower CF rate implies less frequent electrolyte replacement throughout the battery's lifetime, thereby enhancing user experience and reducing environmental impacts associated with electrolyte production. This has particular importance for RFBs using electrolyte materials with high environmental impacts. This explains why the OFB exhibits improved environmental performance among studied batteries after considering battery performance in the LCA model. Despite its significance, the CF has often been excluded or assumed negligible in previous studies.24,26,37 We recommend future studies to consider this parameter in LCA models of RFBs or, at minimum, in sensitivity analyses. Additionally, uncertainties in the emerging battery performance also indicate opportunities for improvement. Thus, the SA results also suggest that future research should prioritize improving electrolyte CF in order to reduce environmental impacts of both VFBs and RFBs with TEMPO-based electrolyte. In line with this, significant research effort have been dedicated to developing approaches for electrolyte stabilization.60–63
Several uncertainties and limitations exist in the study. First, this study excluded the EoL stage because the treatment of organic-based electrolytes is still under research.16,64 While there are more mature EoL treatments for VFB electrolytes, such as replenishment or rebalancing, achieved through partial remixing of the posolyte and negolyte,65,66 this method is applicable only to RFBs with similar active species in both electrolytes, such as vanadium for VFBs. For OFBs and HFBs with distinct (asymmetrical) active species in the negolyte and posolyte, suitable EoL treatments are still in early development and remain to be explored. In recent years, novel electrolyte rebalancing methods have been proposed for AQ-based RFBs,64,67 however, there is a lack of method established for TEMPO-based RFBs. This exclusion may potentially influence comparative outcomes among batteries.68 Further LCA studies are therefore recommended once relevant EoL technology for organic electrolytes has been developed. Another uncertainty lies in the use of current background databases to assess emerging technologies. One possible approach to address this issue is to use prospective LCA databases such as the ones generated by Premise. However, these databases primarily focus on future changes related to climate impacts.69 Such inconsistency in databases pose challenges when assessing multiple environmental impacts as in this study. Additionally, while the toxicity impacts of battery components were assessed using available characterization factors from the EF method (USEtox model), certain active materials, particularly novel organic electrolytes, may not yet be fully represented in existing LCIA databases. As a result, the potential toxicity of the battery components themselves could be underestimated. This is an intrinsic limitation of the LCIA model. Furthermore, the choice of LCIA method affects battery environmental performance comparisons. Resource depletion and freshwater ecotoxicity methods from EF and ReCiPe 2016 (H) yield contrasting results, as results shown in Fig. 5(a) and 8. This is due to the intrinsic differences in the applied LCIA model approaches. For example, the EF method use the abiotic depletion potential (ultimate reserve) to measure the relative contribution of a product system to mineral resource depletion, whereas ReCiPe uses surplus ore potential to assess the relative consequences of a product system on changing mineral resource quality.70
5. Conclusion
Based on a functional unit of 1 kW h of storage capacity, this LCA study shows that both the OFB and HFB exhibit significantly better environmental performance in acidification, human toxicity (carcinogenic), and particulate matter compared to the VFB. While the OFB and HFB also show better environmental performance relative to anthraquinone-based semi-OFB across all impact categories, their performance varies across different impact categories when compared to other RFB chemistries. Key environmental hotspots in the battery production stage include the production of electrolyte active materials and inverter circuits. For the HFB, additional impacts stem from electrolyte additives and aluminum end plates. When the battery use phase is considered, the OFB outperforms both the HFB and VFB across most impact categories, largely due to its low electrolyte CF, which reduces the frequency of electrolyte replacement. Consequently, the environmental contribution of electrolyte active materials rises to 80–97% in most impact categories (except resource depletion) due to the increased impact of electrolyte replacement. Sensitivity analysis suggests that CF is the most significant contributor to total uncertainty among battery performance parameters, highlighting its potential for improving the environmental performance of both VFBs and TEMPO-based RFBs.Abbreviations
| VFB | Vanadium redox flow battery |
| PCS | Power conversion system |
| TMS | Thermal management system |
| OCV | Open circuit voltage |
| TAA | Total active area |
| N c | Number of cells |
| AAC | Active area per cell |
| ΔSoC | Operating state-of-charge range |
| SoH | State of health |
| CF | Capacity fade |
| HDPE | High density polyethylene |
| V2O5 | Vanadium pentoxide |
| H2SO4 | Sulfuric acid |
| H3PO4 | Phosphoric acid |
| RFBs | Redox flow batteries |
| TEMPTMA | N,N,N-2,2,6,6-Heptamethylpiperidin-4-ammonium chloride |
| TEMPO | 2,2,6,6-Tetramethylpiperidine-1-oxyl |
| TEMPO-4-SO3K | 2,2,6,6-Tetramethylpiperidone-4-sulfate potassium |
| Intermediate 1 | 4-Dimethylamino-2,2,6,6-etramethylpiperidine |
| Intermediate 2 | N,N,N-2,2,6,6-Heptamethylpiperidin-4-ammonium chloride |
| 4-Hydroxy-TEMP | 4-Hydroxy-2,2,6,6-tetramethylpiperidine |
| 4-Hydroxy-TEMPO | 4-Hydroxy-2,2,6,6-tetramethylpiperidine-N-oxyl |
| TAA | 2,2,6,6-Tetramethyl-4-piperidone/triacetone amine. |
Data availability
The data supporting this article have been included as part of the ESI.†Conflicts of interest
There are no conflicts to declare.Acknowledgements
The authors kindly thank researchers at company Energy Storage Solutions (E22) for their valuable insights into RFB design. Shan Zhang acknowledges support from the Department of Energy and Technology, at Swedish University of Agricultural Sciences and STandUp for Energy. We (Athul Seshadri Ramanujam, Alessandro Michieletto and Ulrich S. Schubert) gratefully acknowledge the support of the POLYSTORAGE project. This project has received funding from the European Union's Horizon2020 research and innovation program under the Marie Skłodowska-Curie grant agreement no 860403. Rickard Arvidsson kindly thanks the Swedish Energy Agency for providing funding through grant no. P2019-90221. The authors would like to thank Carlos Felipe Blanco Rocha for his invaluable guidance in the uncertainty analysis and providing important inputs to this paper.References
- Y. Abdelilah, H. Bahar, T. Criswell, P. Bojek, F. Briens, J. Moorhouse and L. M. Martinez, Renewables 2022: Analysis and forecast to 2027, Paris, 2023 Search PubMed.
- D. Bogdanov, J. Farfan, K. Sadovskaia, A. Aghahosseini, M. Child, A. Gulagi, A. S. Oyewo, L. D. N. S. Barbosa and C. Breyer, Nat. Commun., 2019, 10, 1–16 CrossRef PubMed.
- Y. X. Yao, J. F. Lei, Y. Shi, F. Ai and Y. C. Lu, Nat. Energy, 2021, 6, 582–588 CrossRef.
- N. Nsitem., J. Chase and Y. Sekine. Scaling the Residential Energy Storage Market, BloombergNEF, 2023 Search PubMed.
- B. Chreim, M. Esseghir and L. Merghem-Boulahia, Energy Rep., 2024, 11, 250–260 CrossRef.
- J. Figgener, P. Stenzel, K. P. Kairies, J. Linssen, D. Haberschusz, O. Wessels, G. Angenendt, M. Robinius, D. Stolten and D. U. Sauer, J. Energy Storage, 2020, 29, 101153 CrossRef.
- M. Park, J. Ryu, W. Wang and J. Cho, Nat. Rev. Mater., 2017, 2, 1–18 CrossRef PubMed.
- C. C. Ye, A. Q. Wang, C. Breakwell, R. Tan, C. G. Bezzu, E. Hunter-Sellars, D. R. Williams, N. P. Brandon, P. A. A. Klusener, A. R. Kucernak, K. E. Jelfs, N. B. McKeown and Q. L. Song, Nat. Commun., 2022, 13, 3184 CrossRef CAS PubMed.
- T. Janoschka, N. Martin, U. Martin, C. Friebe, S. Morgenstern, H. Hiller, M. D. Hager and U. S. Schubert, Nature, 2015, 527, 78–81 CrossRef CAS PubMed.
- T. B. Liu, X. L. Wei, Z. M. Nie, V. Sprenkle and W. Wang, Adv. Energy Mater., 2016, 6, 1501449 CrossRef.
- K. E. Rodby, R. L. Jaffe, E. A. Olivetti and F. R. Brushett, Int. J. Inf. Manage., 2023, 70, 232605 Search PubMed.
- W. Wang, W. Xu, L. Cosimbescu, D. W. Choi, L. Y. Li and Z. G. Yang, Chem. Commun., 2012, 48, 6669–6671 RSC.
- Z. N. Li, T. L. Jiang, M. Ali, C. X. Wu and W. Chen, Energy Storage Mater., 2022, 50, 105–138 CrossRef.
- M. R. Gerhardt, L. C. Tong, R. Gómez-Bombarelli, Q. Chen, M. P. Marshak, C. J. Galvin, A. Aspuru-Guzik, R. G. Gordon and M. J. Aziz, Adv. Energy Mater., 2017, 7, 1601488 CrossRef.
- B. Huskinson, M. P. Marshak, C. Suh, S. Er, M. R. Gerhardt, C. J. Galvin, X. D. Chen, A. Aspuru-Guzik, R. G. Gordon and M. J. Aziz, Nature, 2014, 505, 195–198 CrossRef CAS PubMed.
- D. G. Kwabi, Y. L. Ji and M. J. Aziz, Chem. Rev., 2020, 120, 6467–6489 CrossRef CAS PubMed.
- S. J. Jin, Y. Jing, D. G. Kwabi, Y. L. Ji, L. C. Tong, D. De Porcellinis, M. A. Goulet, D. A. Pollack, R. G. Gordon and M. J. Aziz, ACS Energy Lett., 2019, 4, 1342–1348 CrossRef CAS.
- B. Hu, J. Luo, M. W. Hu, B. Yuan and T. L. Liu, Angew. Chem., Int. Ed., 2019, 58, 16629–16636 CrossRef CAS PubMed.
- T. Janoschka, N. Martin, M. D. Hager and U. S. Schubert, Angew. Chem., Int. Ed., 2016, 55, 14427–14430 CrossRef CAS PubMed.
- B. Hu, M. W. Hu, J. Luo and T. L. Liu, Adv. Energy Mater., 2022, 12, 2102577 CrossRef CAS.
- L. D. Lima, M. Quartier, A. Buchmayr, D. Sanjuan-Delmas, H. Laget, D. Corbisier, J. Mertens and J. Dewulf, Sustainable Energy Technol., 2021, 46, 101286 Search PubMed.
- N. Blume, M. Becker, T. Turek and C. Minke, J. Ind. Ecol., 2022, 26, 1796–1808 CrossRef CAS.
- S. Weber, J. F. Peters, M. Baumann and M. Weil, Environ. Sci. Technol., 2018, 52, 10864–10873 CrossRef CAS PubMed.
- J. Gouveia, E. Silva, T. Mata, A. Mendes, N. Caetano and A. Martins, Energy Rep., 2020, 6, 87–94 CrossRef.
- M. Dieterle, P. Fischer, M. N. Pons, N. Blume, C. Minke and A. Bischi, Sustainable Energy Technol., 2022, 53, 102457 Search PubMed.
- G. Di Florio, I. Pucher, P. Todeschi, M. C. Baratto, R. Basosi and E. Busi, J. Cleaner Prod., 2022, 343, 130899 CrossRef CAS.
- G. Rodriguez-Garcia, H. C. Fu, P. Sullivan, C. J. Chen, Z. N. Song, J. Q. Chen, Y. F. Yan, D. W. Feng, S. Jin and I. Celik, J. Cleaner Prod., 2023, 397, 136533 CrossRef CAS.
- C. F. B. Rocha, Doctor Doctor thesis, Universiteit Leiden, 2022.
- J. Winsberg, C. Stolze, A. Schwenke, S. Muench, M. D. Hager and U. S. Schubert, ACS Energy Lett., 2017, 2, 411–416 CrossRef CAS.
- J. Xiong, M. Jing, A. Tang, X. Fan, J. Liu and C. Yan, J. Energy Storage, 2018, 15, 133–144 CrossRef.
- R. Gundlapalli and S. Jayanti, J. Energy Storage, 2021, 33, 102078 CrossRef.
- M. Guarnieri, A. Trovò, A. D'Anzi and P. Alotto, Appl. Energy, 2018, 230, 1425–1434 CrossRef CAS.
- Q. Xu, T. S. Zhao and P. K. Leung, Appl. Energy, 2013, 105, 47–56 CrossRef CAS.
- J. Gouveia, A. Mendes, R. Monteiro, T. M. Mata, N. S. Caetano and A. A. Martins, Energy Rep., 2020, 6, 95–101 CrossRef.
- Y. Hu, D. S. Soneira and M. J. Sánchez, J. Energy Storage, 2021, 35, 102262 CrossRef.
- M. Baumann, J. F. Peters, M. Weil and A. Grunwald, Energy Technol., 2017, 5, 1071–1083 CrossRef CAS.
- M. A. Morales-Mora, J. J. H. Pijpers, A. C. Antonio, J. D. Soto and A. M. A. Calderón, J. Energy Storage, 2021, 35, 102339 CrossRef.
- M. M. Rahman, A. O. Oni, E. Gemechu and A. Kumar, Energy Convers. Manage., 2020, 223, 113295 CrossRef CAS.
- S. Cucurachi, C. F. Blanco, B. Steubing and R. Heijungs, J. Ind. Ecol., 2022, 26, 374–391 CrossRef.
- S. Wickerts, R. Arvidsson, A. Nordelöf, M. Svanström and P. Johansson, ACS Sustainable Chem. Eng., 2023, 11, 9553–9563 CrossRef CAS.
- R. Gross, R. Hanna, A. Gambhir, P. Heptonstall and J. Speirs, Energy Policy, 2018, 123, 682–699 CrossRef.
- C. Mutel, et al., Brightway LCA Software Framework, https://docs.brightway.dev/en/latest/.
- L. Tschümperlin, P. Stolz and R. Frischknecht, Life cycle assessment of low power solar inverters, 2016 Search PubMed.
- C. Capello, S. Hellweg, B. Badertscher and K. Hungerbuhler, Environ. Sci. Technol., 2005, 39, 5885–5892 CrossRef CAS PubMed.
- G. Geisler, T. B. Hofstetter and K. Hungerbuhler, Int. J. Life Cycle Assess., 2004, 9, 101–113 CrossRef CAS.
- F. Piccinno, R. Hischier, S. Seeger and C. Som, J. Cleaner Prod., 2016, 135, 1085–1097 CrossRef CAS.
- J. Niemeyer, M. Neumann, V. Brehme, M. Michel and C. Schwarz, EP2706056A1, 2012.
- U. S. Schubert, T. Janoschka, N. Martin and M. Hager, Worldwide Pat., 2016 Search PubMed.
- Z. Xiang, C. Zhang, X. Hu, J. Wang and B. Su, China Pat, CN115010650A, 2022 Search PubMed.
- S. D. Pastor, A. R. Smith and K. M. Bessonen, US5629426A, 1995.
- J. Porzio and C. D. Scown, Adv. Energy Mater., 2021, 11, 21000771 Search PubMed.
- S. Ebner, S. Spirk, T. Stern and C. Mair-Bauernfeind, ChemSusChem, 2023, 16, e202201818 CrossRef CAS PubMed.
- E. Borgonovo, Reliab. Eng. Syst. Saf., 2007, 92, 771–784 CrossRef.
- E. Plischke, E. Borgonovo and C. L. Smith, Eur. J. Oper. Res., 2013, 226, 536–550 CrossRef.
- T. Iwanaga, W. Usher and J. Herman, Socio-Environ. Syst. Modell., 2022, 4, 18155–18155 Search PubMed.
- A. Saltelli, M. Ratto, T. Andres, F. Campolongo, J. Cariboni, D. Gatelli, M. Saisana and S. Tarantola, Global sensitivity analysis: the primer, John Wiley & Sons, 2008 Search PubMed.
- H. Y. He, S. Tian, B. Tarroja, O. A. Ogunseitan, S. Samuelsen and J. M. Schoenung, J. Cleaner Prod., 2020, 269, 121740 CrossRef CAS.
- E. Shittu, R. Suman, M. K. Ravikumar, A. K. Shukla, G. L. Zhao, S. Patil and J. Baker, J. Cleaner Prod., 2022, 337, 130503 CrossRef CAS.
- R. K. Rosenbaum, T. M. Bachmann, L. S. Gold, M. A. J. Huijbregts, O. Jolliet, R. Juraske, A. Koehler, H. F. Larsen, M. MacLeod, M. Margni, T. E. McKone, J. Payet, M. Schuhmacher, D. van de Meent and M. Z. Hauschild, Int. J. Life Cycle Assess., 2008, 13, 532–546 CrossRef CAS.
- W. J. Li, S. W. Liao, Z. P. Xiang, M. B. Huang, Z. Y. Fu, L. B. Li and Z. X. Liang, Chem. Eng. Sci., 2023, 270, 118534 CrossRef CAS.
- G. G. Tang, W. Y. Wu, Y. H. Liu, K. Peng, P. P. Zuo, Z. J. Yang and T. W. Xu, Nat. Commun., 2025, 16, 47 CrossRef PubMed.
- M. B. Huang, W. J. Li, D. H. Lin, K. Wan, Z. Y. Fu, Z. P. Xiang and Z. X. Liang, Energy Storage Mater., 2024, 67, 103267 CrossRef.
- Y. F. Liu, X. Z. Yuan, M. B. Huang, Z. P. Xiang, S. Z. Hu, Z. Y. Fu, X. H. Guo and Z. X. Liang, Ind. Eng. Chem. Res., 2022, 61, 14508–14514 CrossRef CAS.
- Y. Jing, E. W. Zhao, M. A. Goulet, M. Bahari, E. M. Fell, S. J. Jin, A. Davoodi, E. Jónsson, M. Wu, C. P. Grey, R. G. Gordon and M. J. Aziz, Nat. Chem., 2022, 14, 1103–1109 CrossRef CAS PubMed.
- M. Skyllas-Kazacos and M. Kazacos, J. Power Sources, 2011, 196, 8822–8827 CrossRef CAS.
- A. Bhattarai, P. C. Ghimire, A. Whitehead, R. Schweiss, G. G. Scherer, N. Wai and H. H. Hng, Batteries, 2018, 4, 48 CrossRef CAS.
- M. Cantera, L. Lubián, K. Cavusoglu, R. Rubio-Presa, R. Sanz, V. Ruiz, J. M. Cámara and E. Ventosa, Batteries Supercaps, 2024, 7, e202400086 CrossRef.
- N. Blume, O. Zielinski, M. Becker and C. Minke, Energy Technol., 2023, 2300750 Search PubMed.
- B. Steubing, A. M. Beltran and R. Sacchi, Int. J. Life Cycle Assess., 2023, 28, 1092–1103 CrossRef.
- M. A. J. Huijbregts, Z. J. N. Steinmann, P. M. F. Elshout, G. Stam, F. Verones, M. Vieira, M. Zijp, A. Hollander and R. van Zelm, Int. J. Life Cycle Assess., 2017, 22, 138–147 CrossRef.
Footnote |
| † Electronic supplementary information (ESI) available. See DOI: https://doi.org/10.1039/d4eb00027g |
| This journal is © The Royal Society of Chemistry 2025 |