
 Open Access Article
 This Open Access Article is licensed under a Creative Commons Attribution-Non Commercial 3.0 Unported Licence
RedCat, an automated discovery workflow for aqueous organic electrolytes†
Murat Cihan
Sorkun‡
 a,
Xuan
Zhou‡
a,
Joannes
Murigneux
a,
Nicola
Menegazzo
b,
Ayush Kumar
Narsaria
c,
David
Thanoon
d,
Peter A. A.
Klusener
b,
Kaustubh
Kaluskar
c,
Sharan
Shetty
c,
Efstathios
Barmpoutsis
e and
Süleyman
Er
*a
a,
Xuan
Zhou‡
a,
Joannes
Murigneux
a,
Nicola
Menegazzo
b,
Ayush Kumar
Narsaria
c,
David
Thanoon
d,
Peter A. A.
Klusener
b,
Kaustubh
Kaluskar
c,
Sharan
Shetty
c,
Efstathios
Barmpoutsis
e and
Süleyman
Er
*a
aDIFFER – Dutch Institute for Fundamental Energy Research, De Zaale 20, Eindhoven, 5612 AJ, Netherlands. E-mail: s.er@differ.nl
bShell Global Solutions International B.V., Energy Transition Campus Amsterdam, Grasweg 31, Amsterdam, 1031 HW, Netherlands
cShell India Markets Pvt. Ltd, Mahadeva Kodigehalli, Bengaluru, 562149, Karnataka, India
dShell Information Technology International Inc., 3333 Highway 6 South, Houston, TX 77082, USA
ePolymer Technology Group Eindhoven B.V. (PTG/e), P.O. Box 6284, Eindhoven, 5600 HG, Netherlands
First published on 13th June 2025
Abstract
Developing cost-effective organic molecules with robust redox activity and high solubility is crucial for widespread acceptance and deployment of aqueous organic redox flow batteries (AORFBs). We present RedCat, an automated workflow designed to accelerate the discovery of redox-active organic molecules from extensive molecular databases. This workflow employs structure-based selection, machine learning models for predicting redox reaction energy and aqueous solubility, and dynamically integrates up-to-date pricing data to prioritize candidates. Applying this workflow to 112 million molecules from the PubChem database, we identified 261 promising anolyte candidates. We validated their battery-related properties through first-principles and molecular dynamics calculations and experimentally tested two electrochemically active molecules. These molecules demonstrated higher energy densities than previously reported compounds, confirming the robustness of our workflow in discovering electrolytes. With its open-access code repository and modular design, RedCat is well-suited for integration into self-driving labs, offering a scalable framework for autonomous, data-driven electrolyte discovery.
1 Introduction
Redox flow batteries (RFBs) are an emerging energy storage technology characterized by decoupled power and energy components, rendering them particularly suitable for long-duration storage.1–3 However, the availability, cost, and environmental burden associated with mining of the metal ore have impelled the search of new electroactive energy storage materials.4 Electroactive organic molecules, like quinones, alloxazines, and phenazines, have been extensively screened for high-performance candidates in advanced aqueous organic redox flow batteries (AORFBs) due to their potential advantage toward achieving low-cost synthesis at scale, structural diversity, and tailorability.5–7Data-driven workflows, empowered by algorithms, computational tools, and machine learning (ML) models, have been comprehensively applied in material discovery.8–10 The design of a workflow, including the selection of applied methods and tools, needs to be tailored to align with the material class and its intended application.11 For the discovery of AORFB electrolyte materials, customized workflows that account for electrolyte-related properties have been designed in previous studies.12,13 With the rapid advancement of ML in battery materials research, ML-assisted DFT and molecular dynamics simulations are increasingly integrated into data-driven workflows to predict physicochemical properties and understand kinetic behavior,14,15 thereby shifting electrolyte materials design from trial-and-error to rational strategies. Library generation has been frequently integrated into the data-driven workflows as the starting point of the discovery process, focusing on a subset of core structures within a known organic family and their substituents, which are enumerated using selected electron-withdrawing or donating groups. Therefore, screenings by the workflows based on virtual library generation confined to predefined or localized chemical spaces. Furthermore, the molecules identified through this approach may either be commercially unavailable or exist only virtually, and thus have not yet been synthesized. For example, simple functional groups such as –NH2, –OH, –F, –COOH, –SO3H, and –PO3H2 are widely chosen in library design. The introduction of intricate chemical groups such as –O(CH2)3COOH, –O(CH2)3PO3H2, –C(CH3)2CH2COOH, –(CH2)2SO3H2, –(CH2)2COOH, and –(CH2)2PO3H2 was not considered until recent experimental findings16,17 demonstrated their potential to enhance the stability and solubility of quinone-based electrolytes in AORFBs. Consequently, breakthroughs in data-driven discovery have been largely driven by chemical intuition and experimental knowledge.
Publicly available chemical databases contain repositories of millions of unique molecules, offering an extensive spectrum of molecular diversity in redox moieties and functional groups. However, identifying suitable electroactive molecules from such an extensive dataset is akin to searching for a needle in a haystack and requires intelligent strategies to efficiently screen the entire database.
Recent advancements in materials science and electrochemistry have highlighted the transformative potential of self-driving laboratories (SDLs) in accelerating discovery.18,19 Despite their potential, current SDLs face significant challenges. Many existing systems are designed for specific tasks and lack the flexibility needed to coordinate complex, multi-component workflows in fully autonomous labs.20,21 To realize the full capabilities of SDLs, it is essential to develop a modular, scalable infrastructure that can seamlessly integrate AI, DTs, and orchestration systems for efficient and autonomous lab operations. In this study, we propose an SDL-compatible automated workflow, RedCat, to screen large databases for potential AORFB electrolytes without human intervention.
In the following sections, we present the results of applying our proposed RedCat workflow to the PubChem22 database. We begin by detailing the workflow's filtering steps, which include similarity-based, property-based, and availability-based filtering, followed by physics-based simulations. These filtering stages along with the number of molecules selected at each step are illustrated in Fig. 1. Finally, we discuss the experimental results of the two top-ranking molecules.
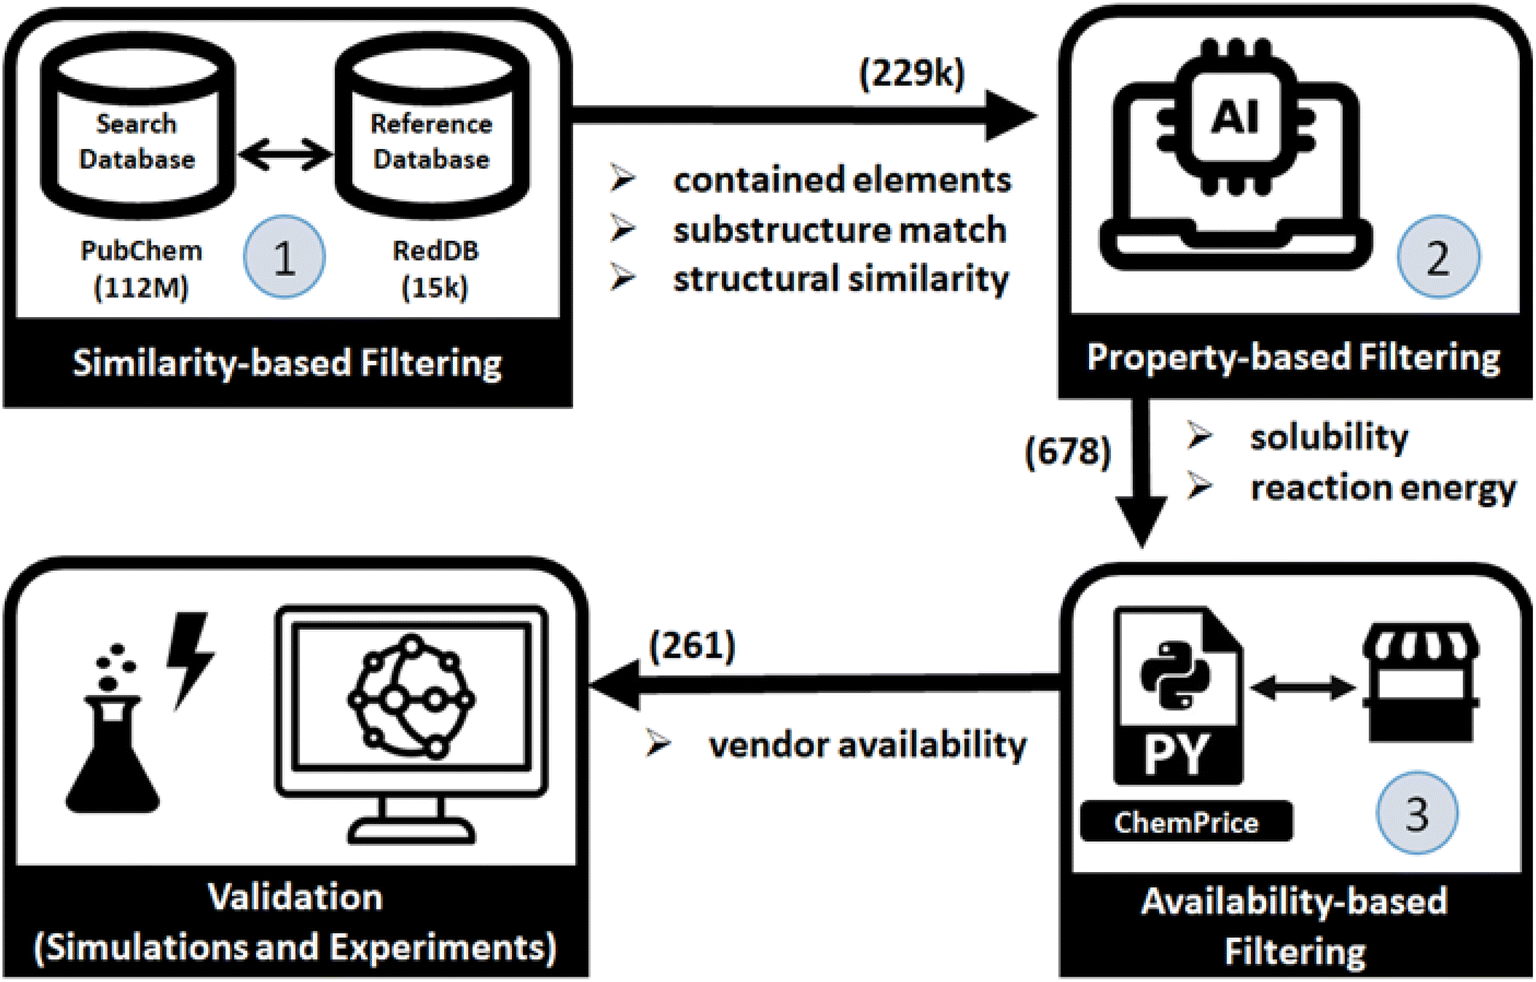 | ||
| Fig. 1 Schematic overview of the study. The numbers within the blue circles represent each distinct filtering step, while the numbers in parentheses next to the arrows indicate the number of remaining molecules after each filtering stage. | ||
2 Results
2.1 Similarity-based filtering
The objective of this step is to identify molecules in PubChem that are similar to those in the reference database, RedDB,23 which contains electroactive compounds. Fig. 2 shows the similarity-based filtering process of the RedCat workflow. We established three criteria for filtering PubChem molecules based on their similarity to RedDB molecules: | ||
| Fig. 2 Screening of organic electroactive molecules from the PubChem database based on their similarity to molecules in the reference database, RedDB. | ||
• Chemical elements present in the structure
• Redox-active substructure match
• Structural similarity
Our reference database, RedDB, consists of molecules containing only carbon (C), hydrogen (H), oxygen (O), fluorine (F), nitrogen (N), and sulfur (S). Therefore, we excluded any PubChem molecules that contained elements outside of this set. Additionally, we removed compounds identified as mixtures, which are indicated by the presence of “.” character in the SMILES notation. This filtering reduced the dataset from 112 million to approximately 78 million molecules.
Next, we eliminated molecules that have no matching redox-active substructure from the substructure list derived from RedDB. We used 52 core structures from RedDB to extract these redox-active substructures, as detailed in the Data section. Two sets of substructures were used for filtering:
• Set-1: Minimum substructure. These are substructures associated with potential redox activity.
• Set-2: Minimum full ring substructure. These are substructures that include the complete redox-active ring.
As a result of filtering based on substructure matching, approximately 40M molecules remained in set-1 and 6M in set-2.
Then, we filtered molecules based on their structural similarity to RedDB molecules using the Tanimoto similarity of ECFP24 fingerprints (see eqn (1) in the Methods section). The process involved several key steps. First, for each PubChem molecule that remained after substructure filtering, the Tanimoto similarity was calculated against every RedDB molecule individually. Next, each PubChem molecule was assigned with the highest similarity value obtained from these comparisons. Molecules with similarity values below the chosen cut-off thresholds were then excluded. The cut-off values were selected to balance the number of selected molecules with their similarity to the reference database, favoring a looser threshold to maintain diversity. For set-1, which focused on minimum substructure matching, a Tanimoto similarity cut-off of 0.5 was applied. For set-2, which required minimum full ring substructure matching, a cut-off of 0.4 was used, as stricter filtering had already ensured the presence of complete redox-active ring structures. After this structural similarity filtering, approximately 60k molecules remained in set-1, and 217k molecules in set-2. Finally, we combined the two sets of molecules and removed any duplicates, resulting in a dataset of nearly 229k molecules.
2.2 Property-based filtering using machine learning predictions
In this step, we filtered the molecules based on two key properties, namely reaction energy, which is used as a proxy for redox potential, and solubility in water. These properties significantly influence the energy density of AORFBs. Fig. 3 shows the property-based filtering process, and the data distribution based on these properties. To obtain the reaction energy and solubility values, we used two ML models developed in previous studies, namely RedPred25 and AqSolPred.26 Detailed information about these ML models integrated into the RedCat workflow is provided in the Methods section. We selected molecules that have reaction energy less than 0 eV and solubility in water in terms of log![[thin space (1/6-em)]](https://www.rsc.org/images/entities/char_2009.gif) S higher than −1 (i.e., greater than 0.1 mol L−1). Applying these criteria resulted in 678 molecules.
S higher than −1 (i.e., greater than 0.1 mol L−1). Applying these criteria resulted in 678 molecules.
 | ||
| Fig. 3 Selection of molecules based on predicted properties and vendor availability. Reaction energy and solubility were predicted using the RedPred and AqSolPred ML models, respectively. Shaded areas in the histograms indicate molecules excluded due to the applied cut-off for ML-predicted properties. The bar chart illustrates the proportion of molecules that are either unavailable or available with pricing information from vendors. | ||
2.3 Availability-based filtering
The goal of this step is to identify molecules that are commercially available. To achieve this, we integrated ChemPrice,27 a Python library designed to programmatically collect information on molecule availability and pricing, into the RedCat workflow. ChemPrice aggregates data from ChemSpace, Mcule, and Molport which collectively source information from over 100 suppliers. We conducted a price search for the 678 molecules obtained from the property-based filtering step. For these molecules, 1248 price instances were collected from various vendors. Molecules without available price information were then filtered out, narrowing the selection to 261 commercially available molecules.2.4 Validation of selected molecules by physics-based simulations
Physics-based simulations were performed using the Schrödinger Materials Science Suite (SMSS) to rank the 261 selected molecules. By visualizing the molecular geometries in SMSS, we identified and removed 12 redox-inactive molecules. Although these 12 molecules contained the same substructure (O![[double bond, length as m-dash]](https://www.rsc.org/images/entities/char_e001.gif) C–CC–CO) as quinones, their moieties featured dual carboxyl groups in the ortho position of a ring, resulting in reversible redox-inactivity. Additionally, we excluded 27 steric conformers using the Filter Duplicates tool in SMSS. This process left us with 222 electroactive molecules, which were then subjected to density functional theory (DFT) simulations.
C–CC–CO) as quinones, their moieties featured dual carboxyl groups in the ortho position of a ring, resulting in reversible redox-inactivity. Additionally, we excluded 27 steric conformers using the Filter Duplicates tool in SMSS. This process left us with 222 electroactive molecules, which were then subjected to density functional theory (DFT) simulations.
We calculated the DFT-level reaction energies of these molecules and further determined the DFT-based redox potentials using eqn (2), as described in the Methods section. The scatter plot in Fig. 4a shows the distribution of the 222 molecules based on the calculated redox potential values (E0DFT) and the ML-predicted solubility (SML) values. The same cut-off criterion applied to the ML-predicted reaction energy values (Fig. 3) was used for the DFT-computed reaction energies. Applying eqn (2) with a cut-off criterion of E0DFT < −0.63 V vs. RHE, we selected 160 molecules located to the right of the vertical line in Fig. 4a.
 | ||
| Fig. 4 Computational screening and analysis of 222 organic molecules. (a) Distribution of molecules based on ML-predicted solubility (SML) and DFT-calculated redox potential (E0DFT). The vertical line marks the ΔErxn = 0 eV cut-off applied in the current study, and the shaded rectangle denotes the region of filtered-out molecules. (b) Representative structures of five redox moiety types identified among the 160 retained molecules. (c) Distribution of carbonyl-based moieties (#1 and #2). (d) Distribution of aza-aromatic moieties (#3, #4, and #5). Colored circles denote the top five molecules per moiety type, ranked by theoretical energy density. | ||
To evaluate the thermodynamic stability of the selected 160 electroactive molecules and their corresponding hydrogenated (e.g., electrochemically reduced) products, we performed molecular dynamics (MD) simulations. We used the average root mean square deviation (RMSD) of all atoms and the maximum root mean square fluctuation (RMSF) of heavy atoms as proxies for stability.28 The scatter plot showing the distribution of the 160 molecules based on these metrics is provided in ESI Fig. S1.† The results show that the average RMSD values for all reactant and product molecules are below 1.5 Å, and the maximum RMSF values are under 2.4 Å, indicating favorable molecular stability at 300 K and 1 atm.
The selected 160 molecules comprise five types of redox moieties, with types #1 and #2 being carbonyl-based and the remaining being aza-aromatic (Fig. 4b). These moieties are distributed as follows: seven molecules for type #1, eight for type #2, ninety-two for type #3, thirty-seven for type #4, and sixteen for type #5. The distributions of these moiety groups based on their ML-predicted solubility values and DFT-calculated redox potential values are given in Fig. 4c and d.
2.5 Experimental validation of top-ranking molecules
In the final step, we analyzed the top five molecules for each type of redox moiety, ranked based on their predicted energy density as detailed in the Methods. These molecules are marked by circled dots in Fig. 4c and d, and their 2D structural representations and numerical data, including predicted redox potential, solubility, energy density, average RMSD, maximum RMSF, and available experimental values are listed in Table 1.| # | PubChem CID | 2D representation | E 0DFT (V vs. RHE) | S ML (mol L−1) | W pre (Wh L−1) | Average RMSD (Å) | Maximum RMSF (Å) | E 0exp (V vs. RHE) |
|---|---|---|---|---|---|---|---|---|
| #1 | 6712 |
|
−0.23 | 1.03 | 32.3 | 0.2 | 1.0 | −0.21 (ref. 29) |
| 0.3 | 0.9 | |||||||
| 412447 |

|
−0.25 | 0.33 | 10.9 | 0.7 | 1.3 | −0.30 (ref. 29) | |
| 0.5 | 1.5 | |||||||
| 8329 |

|
−0.24 | 0.34 | 10.8 | 0.2 | 0.4 | −0.18 (ref. 29) | |
| 0.8 | 1.4 | |||||||
| 84406 |

|
−0.18 | 0.23 | 6.7 | 0.6 | 1.5 | ||
| 0.6 | 1.5 | |||||||
| 84473 |

|
−0.18 | 0.22 | 6.3 | 0.6 | 1.6 | ||
| 0.5 | 1.5 | |||||||
| #2 | 136476 |
|
−0.60 | 0.32 | 16.3 | 0.1 | 0.1 | |
| 0.1 | 0.1 | |||||||
| 44718968 |

|
−0.58 | 0.14 | 7.3 | 0.3 | 0.8 | ||
| 0.3 | 0.5 | |||||||
| 65163 |

|
−0.52 | 0.13 | 6.1 | 0.4 | 0.8 | ||
| 0.5 | 0.9 | |||||||
| 21399352 |

|
−0.38 | 0.14 | 5.7 | 0.2 | 1.3 | ||
| 0.3 | 1.3 | |||||||
| 44718969 |

|
−0.63 | 0.11 | 5.6 | 1.2 | 1.7 | ||
| 1.1 | 1.7 | |||||||
| #3 | 20389456 |
|
−0.56 | 0.78 | 38.4 | 0.7 | 1.0 | |
| 0.7 | 0.8 | |||||||
| 13910894 |

|
−0.55 | 0.74 | 36.1 | 1.0 | 1.1 | −0.48 | |
| 0.8 | 1.2 | |||||||
| 292282 |

|
−0.56 | 0.56 | 27.5 | 0.8 | 0.9 | −0.47 | |
| 0.7 | 0.9 | |||||||
| 104277027 |

|
−0.60 | 0.39 | 19.8 | 0.5 | 0.9 | ||
| 1.3 | 1.2 | |||||||
| 19797048 |

|
−0.47 | 0.37 | 16.4 | 0.8 | 1.3 | ||
| 0.6 | 1.0 | |||||||
| #4 | 23498776 |

|
−0.58 | 0.57 | 28.6 | 0.7 | 0.9 | |
| 0.8 | 0.7 | |||||||
| 67291481 |

|
−0.62 | 0.48 | 25.3 | 0.4 | 0.8 | ||
| 0.7 | 1.1 | |||||||
| 269369 |

|
−0.40 | 0.42 | 17.3 | 0.2 | 0.6 | ||
| 0.3 | 0.6 | |||||||
| 82418574 |

|
−0.42 | 0.35 | 14.7 | 0.2 | 0.5 | ||
| 0.3 | 0.9 | |||||||
| 115736040 |

|
−0.49 | 0.26 | 11.8 | 0.3 | 0.5 | ||
| 0.3 | 0.3 | |||||||
| #5 | 12649778 |

|
−0.61 | 0.66 | 34.3 | 0.1 | 0.1 | |
| 0.5 | 0.6 | |||||||
| 88038927 |

|
−0.57 | 0.33 | 16.5 | 0.6 | 0.9 | ||
| 0.7 | 0.9 | |||||||
| 107845553 |

|
−0.57 | 0.20 | 10.1 | 0.9 | 1.7 | ||
| 0.9 | 1.8 | |||||||
| 70140281 |

|
−0.10 | 0.32 | 8.0 | 0.1 | 0.2 | ||
| 0.4 | 1.0 | |||||||
| 81964837 |

|
−0.62 | 0.15 | 7.9 | 0.7 | 1.4 | ||
| 1.0 | 1.8 |
Among the 25 molecules, those containing the #1 redox moiety exhibited high redox potential, while those with the #3 redox moiety demonstrated high energy density due to their elevated solubility. The average RMSD and maximum RMSF values for all 25 molecules and their product molecules were below 1.40 Å and 1.80 Å, respectively. In addition, vibrational frequency calculations for the optimized geometries of these molecules showed no imaginary frequencies, confirming that the structure optimizations converged to stable minima. Given the goal of identifying candidate compounds for energy-dense AORFB electrolytes, we selected two diaza compounds (group #3), (2-aminoethyl)[(pyrazin-2-yl)methyl]amine and N-[(pyrazin-2-yl)methyl]formamide, based on their predicted energy density, cost, and availability, and then experimentally tested them to validate the workflow's output.
Redox activity was measured via cyclic voltammetry (CV) using 1 mmol L−1 pyrazine solutions in 1 mol L−1 KCl, whereby oxidation and reduction waves pertaining to the molecule were observed compared to the background current (Fig. S2†). Fig. 5 shows the CVs recorded for the two pyrazines. It is worthwhile noting that heterogeneous electron transfers for pyrazines can occur at potentials outside the thermodynamic stability for water, resulting in reactions at carbon surfaces (e.g., partial reduction of oxidized species, hydrogen adsorption and evolution30,31) that produce background currents overlapping with the CV response of the pyrazines. This effect is seen in Fig. 5, where both oxidation and reduction peaks for the two pyrazines appear exclusively in the cathodic (i.e., negative) current range. Additionally, a peak separation greater than 0.4 V is observed in the CV, indicating sluggish electron transfer, which could lead to lower voltaic efficiencies in an AORFB. However, for the purpose of validating the RedCat workflow, the calculated redox potentials align well with the experimentally determined values, with differences of less than 0.1 V (Table 1).
 | ||
| Fig. 5 Electrochemical characterization of two selected organic molecules. (a) Cyclic voltammogram of 1 mM (2-aminoethyl)[(pyrazin-2-yl)methyl]amine in 1 M KCl aqueous solution. (b) Cyclic voltammogram of N-[(pyrazin-2-yl)methyl]formamide under the same conditions. Both voltammograms were recorded at a scan rate of 20 mV s−1. | ||
Extended voltametric cycling provides a cursory indication of reversibility, as the pyrazine's redox waves persist, suggesting that battery electrolytes using the molecules could undergo several charging and discharging cycles. Nonetheless, a slight increase in peak separation for both species and a tendency toward hydrogen gas evolution (particularly for (2-aminoethyl)[(pyrazin-2-yl)methyl]amine) may result in lower round-trip efficiency in a working AORFB system. Visual inspection at the end of the cycling regime did not reveal coloration of the solution or film formation on the electrode surface, suggesting that the electrochemical changes observed in the CVs are likely due to alterations in functional groups at the glassy carbon electrode surface. Precisely quantifying energy storage characteristics, including any evolution in overpotentials or hydrogen gas, is beyond the scope of this study and will require further analysis in a flow cell configuration under appropriate conditions.
In addition to redox potential, the concentration of the dissolved molecule in the electrolyte determines its volumetric capacity (Ah L−1). Solubility was determined using UV-vis spectroscopy by constructing a calibration curve based on serial dilution of stock solutions. Using this method, the solubility for N-[(pyrazin-2-yl)methyl]formamide was measured to be 10.4 ± 0.1 mol L−1, translating to an anolyte with a theoretical capacity of 557 Ah L−1, which is more than ten times higher than the incumbent vanadium(II/III) system. In contrast, (2-aminoethyl)[(pyrazin-2-yl)methyl]amine is a liquid at room temperature and fully miscible with water. An anolyte composed solely of this pyrazine32 (without additional solvent) would have a volumetric capacity of approximately 400 Ah L−1, significantly higher than that of current systems. In comparison to other aqueous organic anolytes, a recent review by P. Fischer and co-workers provides a graphical summary of indicative volumetric capacities based on solubility for commonly used compounds in flow battery electrolytes. Therein, most reported values fall between 10 and 100 Ah L−1.33 Additional recent examples include 2,6-D2PEAQ, a substituted anthraquinone with a theoretical capacity of 107 Ah L−1,34 AZON3, an N-alkylated fluorenone (46.4 Ah L−1 (ref. 35)), 2,3-O-DBAP, a phenazine derivative (32 Ah L−1 (ref. 36)) and MBPE-Vi, a bisphosphonated viologen (38.9 Ah L−1 (ref. 37)). However, the volumetric capacities reported for the two pyrazines studied here may be overly optimistic. In practical flow cell operation, factors such as overpotentials, cell configuration, and electrolyte viscosity are likely to reduce the accessible capacity and overall round-trip efficiency. Nonetheless, the estimated capacity values for pyrazine-based anolytes are notable and warrant continued investigation into this class of materials. Furthermore, the high solubility and miscibility observed in a near pH-neutral medium have practical implications for flow batteries, as strongly acidic or alkaline electrolytes require special considerations in terms of battery materials and electrolyte handling procedures. Near-neutral pH electrolytes simplify several of these constraints.
3 Discussion
In this study, we propose RedCat, an SDL-compatible automated workflow for identifying promising organic electroactive molecules for AORFBs. As a proof of concept, we implemented this workflow using two databases: PubChem as the search database and RedDB as the reference database. However, this workflow is highly adaptable and can be used with other databases. For example, the search databases are represented as lists of molecules in SMILES notation, a universally recognized format used in nearly all molecular databases. Thus, by simply substituting the search database (the list of SMILES), the same screening process can be applied to different chemical search spaces. Additionally, the set of target structures can be expanded by adding new redox-active core structures, represented by SMARTS notations, to the reference database. This modular approach allows the workflow to be used for screening new databases and reevaluating previously screened databases in search of new chemical motifs.Through screening the PubChem database, we identified two molecules for potential use as AORFB electrolytes. We experimentally validated their electrochemical activity and solubility. Notably, (2-aminoethyl)[(pyrazin-2-yl)methyl]amine is liquid at room temperature and fully miscible with water. From an application perspective, identification of (2-aminoethyl)[(pyrazin-2-yl)methyl]amine could be immensely useful as the electrochemically active liquid can be used directly as a flow battery anolyte with minimal or no solvent, resulting in a highly energy-dense electrolyte.32 However, in general, deploying highly concentrated solutions may not be practical, as electrochemical side reactions can be exacerbated, reducing the lifetime of the electrolyte. Additionally, high electrolyte viscosity or low ionic conductivity can lead to lower roundtrip efficiency of the battery system.32,38,39
Our workflow successfully identified two high-potential molecules, and several others may also be worth exploring. To understand why some known molecules were excluded, we retrospectively analyzed a dataset of 64 AORFB molecules (see Table S1†) previously reported in the literature.29,40–44 Out of these, only three molecules passed the full screening workflow, as shown in Fig. S4.† This analysis revealed that most exclusions resulted from the strict filtering thresholds applied. However, these thresholds are not fixed and can be easily customized based on research needs. For example, adjusting the Tanimoto similarity threshold could allow structurally distinct molecules, such as benzoquinones, to advance to later stages. Similarly, relaxing the solubility cut-off from −1 to −2logS, would increase the number of retained candidates from six to sixteen. The extent to which literature-reported molecules are retained can serve as a useful guide for calibrating threshold values. All relevant parameters are accessible through a configuration file included with the code, allowing users to re-screen the molecular dataset using customized settings tailored to their objectives.
The property filtering phase relies on ML predictions, making the accuracy of these predictions crucial for molecule selection. While the accuracies of ML models have been reported for specific test sets,25,26 their predictions may not be as robust for chemical spaces that are less familiar to these models. Therefore, it is recommended to consider the trade-off between the coverage of the applied chemical spaces and the determined cut-off values. This requires a prior analysis by comparing the diversity between the chemical space coverage of the training data sets (ML models) and the screened molecules.45 Another limitation arises from solubility models, particularly for predictions of extremely large values. This stems from the fact that experimental values for highly soluble molecules used in training are often reported as “higher than” indications rather than exact values, which constrains the prediction range of the model. For example, the predicted solubility values of the two proposed molecules were 0.74 mol L−1 and 0.56 mol L−1, while their experimental measurements were 10.4 mol L−1 and fully miscible in water, respectively. Despite these apparent discrepancies, the predicted solubility values ranked among the top 0.1% soluble molecules within the screened set (Fig. 3). Given this limitation, it is important to evaluate a molecule's predicted solubility relative to the predicted solubilities of other molecules rather than relying on standalone values.
When evaluating electrochemical redox potentials, we conducted a literature survey for experimental redox potentials and identified three of the 25 highest-performing molecules that had been previously evaluated experimentally. This provided a means of validating our DFT calculations. Comparing the calculated redox potentials with those reported in the literature revealed differences of only 0.02, 0.05, and 0.06 V, for 1,8-anthraquinonedisulfonic acid, 1,5-dihydroxy-9,10-anthraquinone-2,6-disulfonic acid and 1,5-anthraquinonedisulfonic acid, respectively.29 Additionally, the differences between the calculated and experimental redox potentials for the two proposed molecules, (2-aminoethyl)[(pyrazin-2-yl)methyl]amine and N-[(pyrazin-2-yl)methyl]formamide, were 0.07 and 0.09 V, respectively. These minor discrepancies underscore the reliability of the DFT calculated redox potentials. In this study, three descriptors were used for high throughput screening: reaction free energy (a proxy for redox potential), aqueous solubility, and structural stability derived from molecular dynamics simulations. While this triage captures the key thermodynamic prerequisites for high energy density anolytes, practical performance also depends on kinetic parameters such as electron transfer rates and diffusion coefficients, membrane crossover, and overall round trip efficiency. Incorporating these additional descriptors into future versions of RedCat, along with flow cell validation, will further accelerate the discovery of commercially viable aqueous organic electrolytes.
4 Method
4.1 Data
932 reversible two-electron two-proton redox reaction pairs, with their reaction energies calculated by quantum chemical methods. The database is built on 52 core structures, and all molecules within RedDB are derived through the R-group functionalization of these core structures. We extracted redox-active substructures from these 52 core structures to use as reference structures when screening the PubChem database.
4.2 Similarity-based filtering methods
 | (1) |
4.3 Machine learning predictions
For the prediction of reaction energy values, we used RedPred25 model, trained on RedDB23 data. This model was tested on two separate datasets based on chemical space coverage calculated by ChemPlot,45 achieving a mean absolute error of 0.99 eV within the training chemical space and 1.16 eV outside it. For the prediction of solubility values, we used AqSolPred26 model, trained using AqSolDB,48 which contains nearly 10000 molecules with curated experimental aqueous solubility values. This model comprises a consensus of three different ML models and achieved a mean absolute error of 0.348 logS on a widely accepted dataset.49
4.4 Physics-based simulations
4.5 Energy-related performance calculations
| E0DFT (V vs. RHE, pH = 7) = [−0.41 × ΔErxn (eV)] − 0.63 | (2) |
| Wpre (Wh L−1) = nCFV/μv | (3) |
| Wpre (Wh L−1) = 26.8 × n × SML × (0.36 − E0DFT) | (4) |
4.6 Experimental methods
Data availability
The reproducibility of the automated RedCat workflow can be verified by executing the provided scripts on Code Ocean (https://codeocean.com/capsule/8660050/tree).Author contributions
M. C. S. and X. Z. contributed equally to this work. Conceptualization, S. E.; methodology, S. E., M. C. S., and X. Z.; algorithm-based programming and validation, M. C. S., J. M. and A. K. N.; physics-based modeling and validation, X. Z.; experiments and validation, E. B. and N. M.; formal analysis and discussion, M. C. S., X. Z., S. E., S. S., A. K. N., K. K., N. M., and P. A. A. K.; writing – original draft preparation, M. C. S. and X. Z. (computational part), N. M. and E. B. (experimental part); writing – review and editing, M. C. S., X. Z., S. E. S. S., A. K. N., K. K., N. M., P. A. A. K., and E. B.; supervision, S. E.; project administration, S. E.; funding acquisition, S. E. All the authors have read and agreed to the published version of the manuscript.Conflicts of interest
Patent application has been submitted based on the results reported in this paper.Acknowledgements
DIFFER is part of the institute organization of NWO. This work was sponsored by NWO Exact and Natural Sciences for the use of supercomputer facilities. The authors acknowledge funding from Shell Global Solutions International B.V.References
- Z. X. Zhu,
et al., Rechargeable batteries for grid scale energy storage, Chem. Rev., 2022, 122, 16610–16751 CrossRef CAS PubMed
.
- A. A. Kebede, T. Kalogiannis, J. Van Mierl and M. Berecibar, A comprehensive review of stationary energy storage devices for large scale renewable energy sources grid integration, Renewable Sustainable Energy Rev., 2022, 159, 112213 CrossRef CAS
- E. Sánchez-Díez,
et al., Redox flow batteries: Status and perspective towards sustainable stationary energy storage, J. Power Sources, 2021, 481, 228804 CrossRef
- J. Winsberg, T. Hagemann, T. Janoschka, M. D. Hager and U. S. Schubert, Redox-flow batteries: From metals to organic redox-active materials, Angew. Chem., 2017, 56, 686–711 CrossRef CAS
- J. Kim,
et al., Organic batteries for a greener rechargeable world, Nat. Rev. Mater., 2023, 8, 54–70 CrossRef
- G. J. Yang,
et al., Organic electroactive materials for aqueous redox flow batteries, Adv. Mater., 2023, 35, 2301898 CrossRef CAS PubMed
- Q. R. Chen,
et al., Organiac electrolytes for pH-neutral aqueous organic redox flow batteries, Adv. Funct. Mater., 2022, 32, 2108777 CrossRef CAS
- Z. Wang,
et al., Data-driven materials innovation and applications, Adv. Mater., 2022, 34, 35451528 Search PubMed
- R. Pollice,
et al., Data-driven strategies for accelerated materials design, Acc. Chem. Res., 2021, 54, 849–860 CrossRef CAS PubMed
- L. Himanen, A. Geurts, A. S. Foster and P. Rinke, Data-driven materials science: Status, challenges, and perspectives, Adv. Sci., 2019, 6, 1900808 CrossRef PubMed
- J. Schaarschmidt,
et al., Workflow engineering in materials design within the battery 2030+ project, Adv. Energy Mater., 2022, 12, 2102638 CrossRef CAS
- Q. Zhang,
et al., Data-driven discovery of small electroactive molecules for energy storage in aqueous redox flow batteries, Energy Storage Mater., 2022, 47, 167–177 CrossRef
- Q. Zhang, A. Khetan, E. Sorkun and S. Er, Discovery of aza-aromatic anolytes for aqueous redox flow batteries via high-throughput screening, J. Mater. Chem. A, 2022, 10, 22214–22227 RSC
- X. Chen, X. Y. Liu, X. Shen and Q. Zhang, Applying machine learning to rechargeable batteries: From the microscale to the macroscale, Angew. Chem., Int. Ed., 2021, 60, 24354–24366 CrossRef CAS PubMed
- N. Yao, X. Chen, Z. H. Fu and Q. Zhang, Applying classical, ab initio, and machine-learning molecular dynamics simulations to the liquid electrolyte for rechargeable batteries, Chem. Rev., 2022, 122, 10970–11021 CrossRef CAS PubMed
- F. Hasan, V. Mahanta and A. A. Abdelazeez, Quinones for aqueous organic redox flow battery: A prospective on redox potential, solubility, and stability, Adv. Mater. Interfaces, 2023, 10, 2300268 CrossRef CAS
- J. C. Xu, S. Pang, X. Y. Wang, P. Wang and Y. L. Ji, Ultrastable aqueous phenazine flow batteries with high capacity operated at elevated temperatures, Joule, 2021, 5, 2437–2449 CrossRef CAS
- F. Delgado-Licona and M. Abolhasani, Research acceleration in self-driving labs: Technological roadmap toward accelerated materials and molecular discovery, Adv. Intell. Syst., 2023, 5, 2200331 CrossRef
- M. Abolhasani and E. Kumacheva, The rise of self-driving labs in chemical and materials sciences, Nat. Synth., 2023, 2, 483–492 CrossRef CAS
- G. Tom,
et al., Self-driving laboratories for chemistry and materials science, Chem. Rev., 2024, 124, 9633–9732 CrossRef CAS
- Y. Xie, K. Sattari, C. Zhang and J. Lin, Toward autonomous laboratories: Convergence of artificial intelligence and experimental automation, Prog. Mater. Sci., 2023, 132, 101043 CrossRef
- S. Kim,
et al., PubChem substance and compound databases, Nucleic Acids Res., 2016, 44, D1202–D1213 CrossRef CAS PubMed
- E. Sorkun, Q. Zhang, A. Khetan, M. C. Sorkun and S. Er, RedDB, a computational database of electroactive molecules for aqueous redox flow batteries, Sci. Data, 2022, 9, 718 CrossRef CAS PubMed
- D. Rogers and M. Hahn, Extended-connectivity fingerprints, J. Chem. Inf. Model., 2010, 50, 742–754 CrossRef CAS PubMed
- M. C. Sorkun, E. N. Ghassemi, C. Yatbaz, J. V. A. Koelman and S. Er, RedPred, a machine learning model for the prediction of redox reaction energies of the aqueous organic electrolytes, Artif. Intell. Chem., 2024, 2, 100064 CrossRef
- M. C. Sorkun, J. M. A. Koelman and S. Er, Pushing the limits of solubility prediction via quality-oriented data selection, iScience, 2021, 24, 101961 CrossRef CAS PubMed
- M. C. Sorkun, B. Saliou and S. Er, ChemPrice, a Python package for automated chemical price search, Chem. Methods, 2025, 5, e202400005 CrossRef
- X. Zhou, R. A. Janssen and S. Er, Virtual screening of organic quinones as cathode materials for sodium-ion batteries, Energy Adv., 2023, 2, 820–828 RSC
- D. P. Tabor,
et al., Mapping the frontiers of quinone stability in aqueous media: Implications for organic aqueous redox flow batteries, J. Mater. Chem. A, 2019, 7, 12833–12841 RSC
- F. Hine, M. Yasuda and M. Iwata, Chlorine and oxygen electrode processes on glasslike carbon, pyrolytic graphite, and conventional graphite anodes, J. Electrochem. Soc., 1974, 121, 749 CrossRef CAS
- M. Noel and P. N. Anantharaman, Voltammetric studies on glassy carbon electrodes i: Electrochemical behaviour of glassy carbon electrodes in H2SO4, Na2SO4 and NaOH media, Surf. Coat. Technol., 1986, 28, 161–179 CrossRef CAS
- J. H. Huang,
et al., Liquid catholyte molecules for nonaqueous redox flow batteries, Adv. Energy Mater., 2014, 5, 1401782 CrossRef
- P. Fischer, P. Mazúr and J. Krakowiak, Family tree for aqueous organic redox couples for redox flow battery electrolytes: a conceptual review, Molecules, 2022, 27, 560 CrossRef CAS PubMed
- E. F. Kerr,
et al., High energy density aqueous flow battery utilizing extremely stable, branching-induced high-solubility anthraquinone near neutral ph, ACS Energy Lett., 2023, 8, 600–607 CrossRef CAS
- M. Artault,
et al., Azoniafluorenones: A new family of two-electron storage electrolytes for sustainable near-neutral pH aqueous organic flow battery, Adv. Energy Mater., 2024, 14, 2401635 CrossRef CAS
- T. Y. Kong,
et al., Enabling long-life aqueous organic redox flow batteries with a highly stable, low redox potential phenazine anolyte, ACS Appl. Mater. Interfaces, 2024, 16, 752–760 CrossRef CAS
- G. Gonzalez,
et al., Redox-active bisphosphonate-based viologens as negolytes for aqueous organic flow batteries, Chem.–Eur. J., 2025, 31, e202404122 CrossRef CAS PubMed
- D. G. Kwabi, Y. L. Ji and M. J. Aziz, Electrolyte lifetime in aqueous organic redox flow batteries: A critical review, Chem. Rev., 2020, 120, 6467–6489 CrossRef CAS PubMed
- V. Singh, S. Kim, J. Kang and H. R. Byon, Aqueous organic redox flow batteries, Nano Res., 2019, 12, 1988–2001 CrossRef CAS
- K. X. Lin,
et al., A redox-flow battery with an alloxazine-based organic electrolyte, Nat. Energy, 2016, 1, 16102 CrossRef CAS
- M. R. Gerhardt,
et al., Anthraquinone derivatives in aqueous flow batteries, Adv. Energy Mater., 2017, 7, 1601488 CrossRef
- K. Wedege, E. Dražević, D. Konya and A. Bentien, Organic redox species in aqueous flow batteries: Redox potentials, chemical stability and solubility, Sci. Rep., 2016, 6, 39101 CrossRef CAS PubMed
- J. R. T. J. Wass, E. Ahlberg, I. Panas and D. J. Schiffrin, Quantum chemical modeling of the reduction of quinones, J. Phys. Chem. A, 2006, 110, 2005–2020 CrossRef PubMed
- J. J. Hasford and C. J. Rizzo, Linear free energy substituents effect on flavin redox chemistry, J. Am. Chem. Soc., 1998, 120, 2251–2255 CrossRef CAS
- M. Cihan Sorkun, D. Mullaj, J. M. V. A. Koelman and S. C. Er, a python library for chemical space visualization, Chem. Methods, 2022, 2, e202200005 CrossRef CAS
- PubChem FTP Server, URL https://ftp.ncbi.nlm.nih.gov/pubchem, accessed 2022-08-14.
- RDKit: Open-Source cheminformatics software, URL http://www.rdkit.org.
- M. C. Sorkun, A. Khetan and S. Er, AqSolDB, a curated reference set of aqueous solubility and 2D descriptors for a diverse set of compounds, Sci. Data, 2019, 6, 143 CrossRef PubMed
- J. Huuskonen, Estimation of aqueous solubility for a diverse set of organic compounds based on molecular topology, J. Chem. Inf. Comput. Sci., 2000, 40, 773–777 CrossRef CAS PubMed
- C. Lu,
et al., OPLS4: Improving force field accuracy on challenging regimes of chemical space, J. Chem. Theory Comput., 2021, 17, 4291–4300 CrossRef CAS PubMed
- F. Mohamadi,
et al., Macromodel – an integrated software system for modeling organic and bioorganic molecules using molecular mechanics, J. Comput. Chem., 1990, 11, 440–467 CrossRef CAS
- S. M. Bachrach, Jaguar 5.5, J. Am. Chem. Soc., 2004, 126, 5018 CrossRef CAS
- J. P. Perdew, K. Burke and M. Ernzerhof, Generalized gradient approximation made simple, Phys. Rev. Lett., 1996, 77, 3865–3868 CrossRef CAS PubMed
- P. J. Hay and W. R. Wadt, Ab initio effective core potentials for molecular calculations. potentials for K to Au including the outermost core orbitals, J. Chem. Phys., 1985, 82, 299–310 CrossRef CAS
- B. Marten,
et al., New model for calculation of solvation free energies: correction of self-consistent reaction field continuum dielectric theory for short-range hydrogen-bonding effects, J. Phys. Chem., 1996, 100, 11775–11788 CrossRef CAS
-
K. J. Bowers
et al., Scalable algorithms for molecular dynamics simulations on commodity clusters, Proceedings of the 2006 ACM/IEEE Conference on Supercomputing 84–es, 2006 Search PubMed
- H. C. Andersen, Molecular dynamics simulations at constant temperature and pressure, J. Chem. Phys., 1980, 72, 2384 CrossRef CAS
- W. G. Hoover, Canonical dynamics: Equilibrium phase-space distributions, Phys. Rev. A, 1985, 31, 1695–1697 CrossRef PubMed
- Q. Zhang, A. Khetan and S. Er, Comparison of computational chemistry methods for the discovery of quinone-based electroactive compounds for energy storage, Sci. Rep., 2020, 10, 22149 CrossRef CAS PubMed
- J. Luo, B. Hu, M. W. Hu, Y. Zhao and T. L. Liu, Status and prospects of organic redox flow batteries toward sustainable energy storage, ACS Energy Lett., 2019, 4, 2220–2240 CrossRef CAS
Footnotes |
| † Electronic supplementary information (ESI) available. See DOI: https://doi.org/10.1039/d5dd00111k |
| ‡ These authors contributed equally to this work. |
| This journal is © The Royal Society of Chemistry 2025 |