 Open Access Article
Investigating naproxen removal from pharmaceutical factory effluents using UVA/MIL-88-A/PS and solar/MIL-88-A/PS systems†
Sarah
Ghazali
a,
Abbas
Baalbaki
 a,
Weam
Bou Karroum
a,
Alice
Bejjani
a,
Weam
Bou Karroum
a,
Alice
Bejjani
 *b and
Antoine
Ghauch
 *a
*a
aAmerican University of Beirut, Faculty of Arts and Sciences, Department of Chemistry, P. O. Box 11-0236, Riad El Solh, 1107-2020 Beirut, Lebanon. E-mail: antoine.ghauch@aub.edu.lb; Fax: +961 1 365217; Tel: +961 1 350000
bLebanese Atomic Energy Commission, CNRS, Research and Development Department, P. O. Box 11-8281, 1107-2260 Riad EL Solh, Beirut, Lebanon. E-mail: abejjani@cnrs.edu.lb; Fax: +961 1 450810; Tel: +961 1 450811
First published on 23rd November 2023
Abstract
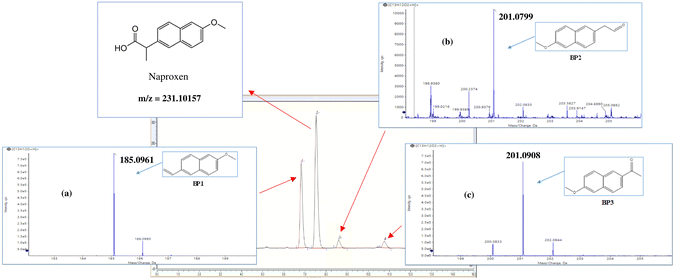
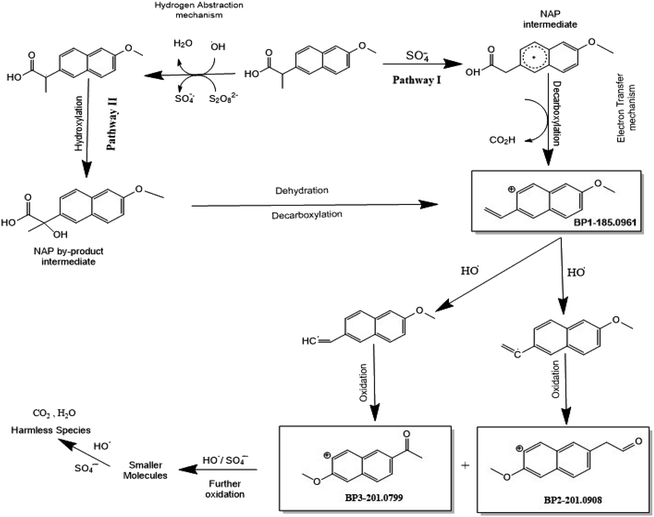
MIL-88-A, an iron-based metal–organic framework (MOF), was synthesized and investigated for its potential as a mediator in a solar-powered system for the activation of persulfate (PS). Solar/MIL-88-A/PS and UVA/MIL-88-A/PS systems were evaluated for the degradation of naproxen (NAP) in water. Control experiments were conducted to study the activation of PS by MIL-88-A in the absence and presence of either UVA lamps or sunlight. Both systems were optimized and tested for their recyclability and matrix variations by varying water-quality parameters, including pH, salinity, bicarbonates, and phosphates. The results indicated that (i) 87% of NAP ([NAP]0 = 50 mg L−1) was degraded within a period of 100 min in UVA/MIL-88-A/PS system, whereas complete degradation occurred in 10–15 min in solar/MIL-88-A/PS system; (ii) MIL-88-A can be recycled over five cycles for PS activation without any regeneration process; and (iii) carbonates and phosphates have inhibitory effect on the degradation of NAP in both systems. The degradation mechanism was elucidated using EPR, TOF-SIMs, and HPLC-MS, which revealed that the degradation mechanism is based on oxidation by hydroxyl (HRs) and sulfate radicals (SRs). Three NAP degradation products were identified using an HPLC-QTOF high-resolution mass spectrometer.
Environmental significancePharmaceutical industries are encountering the challenge of efficiently treating wastewater containing PPCPs. Biological treatment is not effective; therefore, chemical treatments such as Fenton and AOPs, particularly persulfate-based AOPs, have been the treatments of choice. Persulfate treatment is energy intensive, and solarization is not yet a viable option. This study investigated solar powered persulfate treatment using MIL-88-A as an energy mediator. |
1. Introduction
The environmental contamination with pharmaceuticals and personal care products (PPCPs) has raised major concerns among scientific and regulatory communities during the last three decades, and a significant number of studies have been conducted to determine the environmental and human health effects of PPCPs present in nature.1 PPCPs of several categories, including hormones, antibiotics, NSAIDs, and fragrances, among others, have been classified as emerging contaminants owing to their possible hazard to the aquatic environment and human health. Once in the aquatic environment, PPCPs have been found to alter the physiological processes in fish by binding to their nuclear receptors, which modify molecular mechanisms at the transcription and/or translation levels.2,3 Their increased global occurrence is attributed to the increasing human population and the increase in life expectancy.4–6 All these factors contribute to an increase in the quantity and variety of pharmaceuticals ingested and subsequently released into the environment. PPCPs can enter the environment through different routes; however, significant quantities are produced from manufacturing facilities and wastewater treatment plants.7,8 Active pharmaceutical ingredients (APIs) from different PPCPs were found in wastewater treatment plants in quantities ranging from ng L−1 to μg L−1 (ref. 4) in several countries around the world.9–13 Conventional wastewater treatment technologies proved to be ineffective for the removal of PPCPs since the compounds are designed to have high chemical stability.6Nonsteroidal anti-inflammatory drugs (NSAIDs), such as naproxen, ibuprofen, and ketoprofen, are a major category of PPCPs.6 They are frequently used owing to their inexpensive cost, over-the-counter availability, and minor side effects. As a result, considerable amounts of NSAIDs and their metabolites enter groundwater and surface and drinking water.14,15 These products have pKa values ranging from 4.1–4.9; therefore, they exist as soluble ions at the neutral pH of surface water, causing them to be more resistant to removal.
Advanced oxidation processes (AOPs) have recently acquired an increasing interest in wastewater treatment technologies since they have shown efficiency in the elimination of organic compounds that can be hard to remove by conventional wastewater treatment technologies.14 AOPs generate reactive species, such as hydroxyl radicals (HRs), which rapidly and non-selectively degrade a wide range of organic pollutants via oxidation.3,9,16 Common AOPs currently used in industrial WWTPs include UV-based processes (UV/H2O2, UV/H2O2/O3, etc.), ozonation, Fenton's reaction (Fe2+/H2O2), and, more recently, persulfate-based AOPs (PS-AOPs).17–19
PS-AOPs have been increasingly recognized as powerful strategies for the remediation of organic pollutants. These approaches harness persulfates as precursors, which, upon activation, give rise to highly reactive oxidants. Sulfate radicals (SRs) are one of the most potent highly reactive oxidants, possessing an oxidation potential (E0) of 2.6 V, which allows them to engage in rapid and efficient oxidation reactions with a wide array of organic compounds.12,13
Three primary persulfate compounds are employed in PS-AOPs: peroxydisulfate (PDS), peroxymonosulfate (PMS), and sulfite. Each of these precursors has unique chemical characteristics, influencing their activation requirements and the diversity of reactive species they produce:
(1) Peroxydisulfate (PDS) – PDS is a robust oxidizing agent that can be activated thermally, chemically, or using radiation to produce sulfate radicals. The PDS activation energy is relatively high, which necessitates strong initiating conditions but results in the generation of powerful radicals capable of degrading complex organic molecules. PDS is characterized by its affordability, stability, ease of transport/safety, and commercial availability at a mass scale, allowing it to be a better choice compared to competitors such as H2O2 and peroxymonosulfate (PMS).20,21
(2) PMS, also known as OXONE®, can be activated under milder conditions compared to PDS. It can generate both sulfate radicals and other reactive species under ambient conditions, offering versatility in treatment applications but causing it to be more reactive and difficult to handle than PDS; additionally, it is more expensive.20,21
(3) Sulfite, while less commonly used, distinguishes itself from previously mentioned precursors by generating reductive species such as sulfite radicals, hydrated electrons, and hydrogen radicals upon UV activation and has been effectively used for the removal of several organic and inorganic contaminants.22
Non-radical species, such as singlet oxygen (1O2), which can be formed alongside or instead of radicals depending on the activation conditions and the type of persulfate used, also contribute to the pollutant degradation process. Singlet oxygen has considerable oxidizing potential and reacts with a multitude of organic compounds, further broadening the scope of PS-AOPs in treating complex wastewater streams.23
Upon activation, PDS (E0 = 2.1 V) generates sulfate radicals (E0 = 2.6 V).12,13 This technique is environmentally friendly compared to other chemical processes.16 Radical species, mainly sulfate radicals (SRs), can be formed in homogeneous systems via electron transfer by chemical activation of persulfate (eqn (1)),24,25 photolysis (UV254 nm) (eqn (2)),26–28 thermolysis (eqn (3)),29–31 or in heterogeneous systems where chemical activation can be accomplished using zero-valent iron particles, bi-metallics and tri-metallics iron-based systems,32 MOFs,33,34 or magnetite.35,36
| S2O82− + Fe2+ → SO42− + SO4˙− + Fe3+ (chemical activation) | (1) |
 | (2) |
| S2O82− → 2SO4˙− (thermal activation) 30 °C < T < 99 °C | (3) |
Metal–organic frameworks (MOFs)37–39 are a novel class of porous materials composed of a metal ion or a cluster of metal ions connected to an organic molecule termed the linker. MOFs were considered coordination polymers in early studies, but it was later discovered that the inorganic part possesses a larger dimensionality that can form layers and frameworks, rather than only chains.40,41 MOFs are characterized by their high surface area (up to 10![[thin space (1/6-em)]](https://www.rsc.org/images/entities/char_2009.gif) 000 m2 g−1) and high porosity (0.99 cm3 g−1 for MIL-88-A).42,43 These properties allowed their use in a wide range of applications, such as drug delivery,44,45 magnetism,46 polymerization,47 catalysis,48 and multiple other applications. One of these applications is the elimination of organic contaminants and dyes from wastewater using adsorption.40 MOFs-containing metals such as iron and cobalt can be used to activate PS, and several studies investigated the use of MOFs as heterogeneous photocatalysts for the removal of hazardous organic contaminants such as dyes and phenol using Fe-MOF-74,49 methylene blue using MIL-53,50 and rhodamine B using MIL-100.51 In our pursuit of greener alternatives for heterogeneous persulfate activation, we have identified metal–organic frameworks (MOFs) as promising candidates, particularly MIL-88-A. This MOF is synthesized via a hydrothermal process, which is a more environmentally benign method since it circumvents the need for toxic organic solvents. MIL-88-A comprises iron (Fe) as the metal center and fumaric acid as the organic linker. Both constituents are selected for their relatively low toxicity, minimal environmental footprint, and affordability. Moreover, iron's role in persulfate activation is well-documented and leveraged in MIL-88-A to facilitate the degradation of organic pollutants. The incorporation of fumaric acid not only contributes to the stability and porosity of the MOF structure but also resonates with our commitment to sustainable treatment methodologies. By employing MIL-88-A, we harness the synergistic effect of its components to enhance the activation of persulfate, providing an efficient and eco-friendly approach to wastewater remediation.52
000 m2 g−1) and high porosity (0.99 cm3 g−1 for MIL-88-A).42,43 These properties allowed their use in a wide range of applications, such as drug delivery,44,45 magnetism,46 polymerization,47 catalysis,48 and multiple other applications. One of these applications is the elimination of organic contaminants and dyes from wastewater using adsorption.40 MOFs-containing metals such as iron and cobalt can be used to activate PS, and several studies investigated the use of MOFs as heterogeneous photocatalysts for the removal of hazardous organic contaminants such as dyes and phenol using Fe-MOF-74,49 methylene blue using MIL-53,50 and rhodamine B using MIL-100.51 In our pursuit of greener alternatives for heterogeneous persulfate activation, we have identified metal–organic frameworks (MOFs) as promising candidates, particularly MIL-88-A. This MOF is synthesized via a hydrothermal process, which is a more environmentally benign method since it circumvents the need for toxic organic solvents. MIL-88-A comprises iron (Fe) as the metal center and fumaric acid as the organic linker. Both constituents are selected for their relatively low toxicity, minimal environmental footprint, and affordability. Moreover, iron's role in persulfate activation is well-documented and leveraged in MIL-88-A to facilitate the degradation of organic pollutants. The incorporation of fumaric acid not only contributes to the stability and porosity of the MOF structure but also resonates with our commitment to sustainable treatment methodologies. By employing MIL-88-A, we harness the synergistic effect of its components to enhance the activation of persulfate, providing an efficient and eco-friendly approach to wastewater remediation.52
In this study, we investigated the total degradation of NAP in UVA/MIL-88-A/PS and solar/MIL-88-A/PS systems and methodologically assessed the oxidation process efficiency. Furthermore, we assessed the effect of water spectator ions (matrix) on NAP degradation. Finally, we proposed a degradation mechanism of NAP based on the identification of the transformation products of NAP along with the characterization of the MIL-88-A after the reaction using TOF-SIMS.
2. Chemical reagents
Naproxen sodium (NAP) (C14H13NaO3), sodium persulfate (PS) (Na2S2O8, purity ≥99%), phosphate buffer monobasic (H2NaO4P assay ≥99.0%), and dibasic (HNaO4P assay: 98–100.5%) were purchased from Sigma-Aldrich. Fumaric acid (C4H4O) and iron(III) chloride (FeCl3) (both reagent grade >97%) used in the synthesis of MIL-88-A were acquired from Sigma-Aldrich (France and Switzerland, respectively). Ethanol (absolute) was purchased from Scharlau (Spain). Formic acid and acetonitrile used as HPLC mobile phases were acquired from Loba Chemie (India) and Honeywell (Germany), respectively. Millipore deionized water (DI) was used in the preparation of all solutions. To evaluate the matrix effect, sodium bicarbonate (NaHCO3) and sodium chloride (NaCl) were acquired from Fluka (Netherlands). Furthermore, hydrochloric acid (HCl) and sodium hydroxide used to adjust the pH were purchased from Fluka (Switzerland and Germany, respectively).3. Synthesis and characterization methodology of MIL-88-A
MIL-88-A was synthesized using the hydrothermal technique.36,43,53 This method was selected since it is more environmentally friendly than the conventional solvothermal method. This was performed by adding 1949 mg of fumaric acid and 4544 mg of ferric chloride to a beaker filled with 84 mL of DI. The mixture was stirred for 1 h using a magnetic stirrer at 300 rpm for homogenization. Next, the mixture was transferred to a 100 mL PTFE-lined stainless-steel autoclave bomb, heated at 85 °C for 24 h, and left to cool to room temperature. The solid product was collected and washed with 1![[thin space (1/6-em)]](https://www.rsc.org/images/entities/char_2009.gif) :
:![[thin space (1/6-em)]](https://www.rsc.org/images/entities/char_2009.gif) 1 ethanol and DI in a beaker and left undisturbed for 2 h. Next, the solution containing MIL-88-A suspended crystals was transferred to 50 mL Falcon tubes, and the crystals in each tube were recovered by centrifugation at 4000 rpm (2200g) for 10 min. The collected crystals were then washed three times with 390 mL of ethanol/DI (1
1 ethanol and DI in a beaker and left undisturbed for 2 h. Next, the solution containing MIL-88-A suspended crystals was transferred to 50 mL Falcon tubes, and the crystals in each tube were recovered by centrifugation at 4000 rpm (2200g) for 10 min. The collected crystals were then washed three times with 390 mL of ethanol/DI (1![[thin space (1/6-em)]](https://www.rsc.org/images/entities/char_2009.gif) :
:![[thin space (1/6-em)]](https://www.rsc.org/images/entities/char_2009.gif) 1) solution and twice with DI to ensure that all unreacted fumaric acid and ferric chloride were completely removed. Finally, the MOF was dried in a vacuum oven at 85 °C for 24 h and yielded 2350 ± 220 mg of pure MIL-88-A, which was characterized to ensure its purity. Synthesized MIL-88-A characterization methodology was part of a previously conducted research in our laboratory.33,34
1) solution and twice with DI to ensure that all unreacted fumaric acid and ferric chloride were completely removed. Finally, the MOF was dried in a vacuum oven at 85 °C for 24 h and yielded 2350 ± 220 mg of pure MIL-88-A, which was characterized to ensure its purity. Synthesized MIL-88-A characterization methodology was part of a previously conducted research in our laboratory.33,34
4. Reaction setup
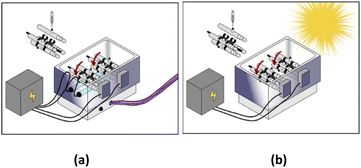
All experiments were conducted in 110 mL homemade watertight borosilicate tubes that were attached radially to a Labquake rotisserie shaker spinning at 8 rpm. All the “stirring” in our experiments was performed using this rotisserie setup. Reactors were placed in a stainless-steel reflector, with two commercial T5 8 watts near-ultraviolet (UVA) fluorescent lamps placed under the reactors (Fig. 1a). The major emission in this spectrum was between 350–450 nm, which is within the UVA-Vis range. Regarding the solar system, UV lamps were removed, and irradiation relied only on direct solar beams without the use of any sunlight concentrator (Fig. 1b). The solar UV (290–390 nm) flux measured at the start and the end of the experiment was equal to 3840 μW cm−2 and 3490 μW cm−2, respectively. The solar UV flux was measured using a UV light meter (Lutron UV-340A). This mixing setup was implemented to keep MIL-88-A suspended during irradiation.5. Experimental conditions and procedures
All solutions were prepared on a daily basis using DI. NAP stock solution (100 mg L−1) was prepared by dissolving 109.5 mg of NAP sodium in a 1000 mL volumetric flask and stirring overnight in the absence of light. PS stock solution (100 mM) was prepared by dissolving 2.381 mg of sodium PS in a 100 mL volumetric flask. Regarding the experiments that were conducted in the presence of UVA, the required volume of NAP stock for the desired concentration was added with the corresponding amount of DI to a 110 mL homemade watertight borosilicate recipient containing the essential amount of MIL-88-A. It was attached radially to a Labquake rotisserie shaker of 8 rpm speed and left to stir for 1 h to reach equilibrium adsorption. The medium was then spiked with the required volume of PS stock solution, where continuous mixing was maintained to ensure solution uniformity. Next, 1.5 mL samples were collected 30 s before and after the addition of MIL-88-A, 30 s after the addition of PS, and every 20 min thereafter for the next 1 h and 40 min. All samples were filtered using 0.45 μm PTFE 13 mm disc filters (Jaytee Biosciences Ltd., UK) and stored in amber-coloured HPLC vials at 4 °C before analysis.Regarding experiments conducted under solar irradiation, the following changes were performed: the total reaction time was 2 h, the equilibration period of 1 h occurred in the absence of solar radiation in a shaded area, and samples were collected in 5 min intervals for 25 min after spiking with PS and every 10 min thereafter for the rest of the runtime. Sample collection times were varied based on different experimental requirements. Control experiments were conducted either in the absence of PS and/or MIL-88-A and/or UV. All experiments were performed in triplicates, and each sample was analysed twice for uncertainty determination.
6. Chemical analysis
Quantification of NAP was performed using an HPLC/DAD system (Thermo Ultimate 3000 UHPLC) equipped with a quaternary pump, a vacuum degasser, an autosampler unit maintained at a temperature of 4 °C, and a thermally controlled column compartment set at a temperature of 30 °C. The column used was a C-18 reverse phase column (5 μm; 4.6 mm in internal diameter × 250 mm in length) connected to a security guard column HS C-18 (5 μm; 4.0 mm in internal diameter × 20 mm in length). The detector used was a DAD-3000 (RS) diode-array detector (DAD). The mobile phases consisted of 0.1% (v/v) formic acid (45%) and acetonitrile (55%) under a flow rate of 1 mL min−1 and an injection volume of 10 μL, all under isocratic mode. NAP had a retention time of 7.6 min, detected at 228 nm. The linear dynamic range (LDR) obtained was between 0.1–10 mg L−1, with LOD 0.9 μg L−1 (Fig. S1†). MS analysis was performed using a high-resolution mass spectrometer detector (HRMS X500R QTOF MS) equipped with a quaternary pump, a vacuum degasser, an auto-sampler with cooling maintained at 4 °C, and a thermally controlled column compartment set at 30 °C. DAD and X500R QTOF MS detectors were used. A reverse-phase C-18 column (100 × 2.1 mm) was used for the elution process. The mobile phase consisted of solvent A (0.1% formic/99.9% methanol) and solvent B (0.1% formic acid/99.9% deionized water), with the following chromatographic elution conditions: 0–16.5 min, gradient 95% to 5% A, 16.5–21.5 min, gradient 95% to 5% B, whereby the flow rate was kept constant at 0.4 mL min−1, and the run time was 25 min.7. Results and discussion
7.1. Characterization results of the synthesized MIL-88-A
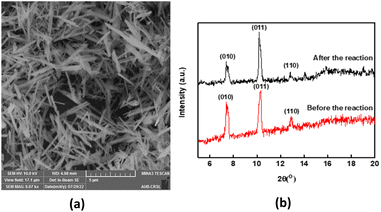
SEM images demonstrated MIL-88-A crystals exhibiting hexagonal rod-like morphology, which is the morphology reported in the literature.36,54 The rod-like crystals were in the nm scale, with sizes ranging from 100–800 nm, as shown in Fig. 2a. The XRD pattern showed peaks with well-defined edges that were visible at 2θ positions of 7.7°, 10.6°, and 12.9° (Fig. 2b).36,54 These peaks are consistent with previously reported patterns48,49 and theoretical simulated ones, demonstrating the crystalline structure of MIL88-A and indicating a successful synthesis. Freshly synthesized MIL-88-A was previously characterized by our research group. MIL-88-A was used in a PS system as a mediator for SMX and NAP degradation.33,34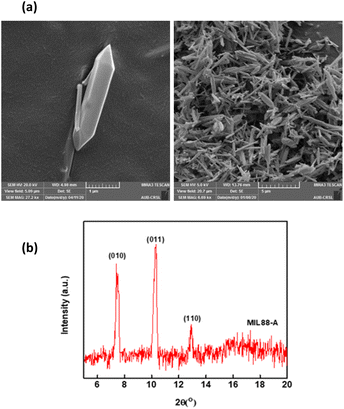 | ||
| Fig. 2 Characterization of the synthesized MIL-88-A: (a) SEM of MIL-88-A crystals at different magnifications (b) XRD diffraction pattern. | ||
7.2. MIL-88-A/PS system controls
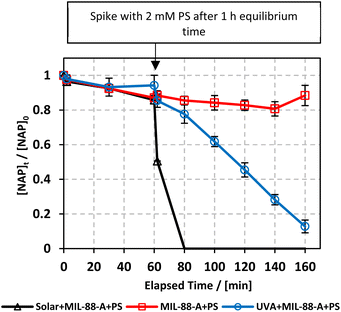
In our study, we explored the performance of the MIL-88-A/PS system under both UVA and solar irradiation to address the variability in solar availability across different geographical locations. This comparison is crucial for understanding the potential of UVA as a surrogate for natural sunlight in regions with inconsistent or limited solar exposure. Our findings aim to inform the adaptation of photocatalytic technologies to diverse environmental conditions, ensuring their efficiency and applicability, regardless of natural light availability. The MIL-88-A/PS system only achieved 11.6% degradation in 60 min after the PS spike. In the UVA/MIL-88-A/PS and solar/MIL-88-A/PS systems, the % degradation increased to 87.2% and 99.8%, respectively, as shown in Fig. 3.The enhanced photocatalytic performance under solar irradiation can be attributed to the optical properties of MIL-88A. With a band gap of 2.51 eV,55 MIL-88A is well-aligned with the band gap characteristics (<3 eV) of iron-based metal–organic frameworks (Fe-MOFs), which are conducive to visible-light-driven photocatalysis.56 This band gap allows MIL-88A to utilize a significant portion of the solar spectrum, specifically the visible range, where it exhibits strong absorbance bands. The absorption profile from the literature-reported DRS analysis reinforces the suitability of MIL-88A for solar-driven applications.55
Furthermore, the intensity of light plays a pivotal role in photocatalysis, influencing the generation of charge carriers on the MOF surface. Under solar irradiation, the increased photon flux can promote higher electron generation, thereby mitigating the electron–hole recombination issue, a known limitation in Fe-MOFs.56 This enhances the activation of persulfate, leading to improved degradation efficiency.
These observations and analyses underscore the relevance of our study's focus on solar irradiation and offer valuable insights for leveraging the photocatalytic capabilities of MIL-88A in various environmental conditions.
7.3. UVA/MIL-88-A/PS system
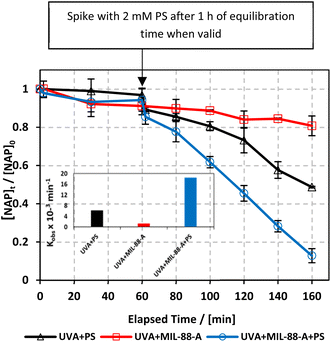
To study the photochemical degradation process of NAP in the MIL-88-A/PS system, control experiments were performed under UVA irradiation. The UVA/MIL-88-A/PS/NAP setting was compared to two other settings: in the presence of persulfate only (UVA/PS/NAP) and MIL-88-A only (UVA/MIL-88-A/NAP) under the abovementioned conditions. The drop in [NAP] after 60 min was 19.25% and 51.31%, respectively, in the MIL-88-A-only and PS-only systems (Fig. 4). This is mainly due to the low concentration of SRs produced by PS photolysis present in the bulk solution. However, the % degradation increased to 87.2% when MIL-88-A and PS were combined (UVA/MIL-88-/PS system). This demonstrated the role of UVA in catalysing PS activation both at the surface of MIL-88-A and in the bulk solution, as shown in previous research.33 The observed degradation rate constant (kobs), determined by applying eqn (4) based on the pseudo-first-order kinetics model, where kobs represents the rate constant (min−1), and t represents the elapsed time in minutes, exhibited a strong correlation, as shown in Fig. 4. kobs dropped from 18.43 × 10⁻³ min−1 in the UVA/MIL-88-A/PS system to 6.15 × 10⁻³ min−1 in the UVA/PS system. Fig. S2† shows the by-product chromatogram formed under UVA irradiation in the UVA/MIL-88-A/PS system. The next sections demonstrate an optimization strategy to improve NAP degradation that was guided by these results.| ln[NAP]/[NAP]0 = −kobst | (4) |
7.4. Solar/MIL-88-A/PS system
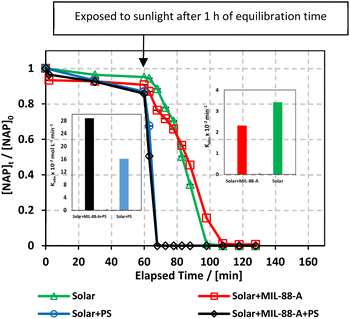
Experiments were performed to study the effectiveness of solar/MIL-88-A/PS on NAP degradation. According to the literature, NAP is photosensitive and demonstrates full degradation after being exposed to sunlight.57–61 A 100 mL solution containing [NAP]0 = 50 mg L−1 was added to 25 mg L−1 of [MIL-88-A]0, and the solution was left to stir in the dark for 1 h to reach equilibrium adsorption. Next, the medium was spiked with [PS] = 2 mM, and continuous stirring was maintained to ensure uniform mixing. Next, the system was placed under sunlight. During the experiments, the solar UV (290–390 nm) reached a maximum of 3900 μW cm−2 and decreased to reach 3500 μW cm−2 at the end of the reaction. PS and MIL-88-A were separately added to the system to optimize NAP degradation, while also accounting for the impact of each additive on NAP degradation. All control experiments showed 100% degradation of NAP in less than 20 min of reaction time (Fig. 5). However, the results obtained in the combined solar/MIL-88-A/PS system had the added advantage of degrading both NAP and its by-products, as attested by the results shown in Fig. S3 and S4.†28,29,62 In fact, the time course of NAP by-products showed different kinetics of appearance/disappearance than NAP. The most significant system was the one combining MIL-88-A and PS under solar irradiation, which demonstrated complete removal of the by-products, without the significant resistance observed in the solar and solar/MIL-88-A systems. The investigation of the solar-powered system kinetics provided valuable insights into the underlying mechanisms. The observed rate orders shed light on the reaction dynamics and highlight the role of sunlight in driving these processes. The solar/MIL-88-A/PS system and solar/PS control were found to exhibit zero-order kinetics (eqn (5)), with determined |kobs| values of approximately 28.6 × 10⁻² mol L−1 min−1 and 16.0 × 10⁻² mol L−1 min−1, respectively. On the other hand, controls involving solar/NAP and solar/MIL-88-A displayed pseudo-first-order kinetics. This suggests that the higher solar radiation intensity provides more energy for the generation of sulfate radicals. These sulfate radicals propagate a radical chain reaction, where they continuously oxidize naproxen. The faster kinetics with solar-based systems (solar/PS and solar/MIL-88-A/PS) is indicated by the complete degradation of NAP and degradation by-products, as tested by HPLC (Fig. S3†), in contrast to the accumulation of the by-products in the other systems. Moreover, one cannot neglect the role of thermal PS activation due to the slight increase of the temperature of the reactors exposed to solar irradiation from room temperature to 40 °C after 120 min of reaction time57,63 Comparative analysis of our solar/MIL-88-A/PS/NAP system with the literature revealed a marked enhancement in degradation efficiency. Our system exhibits complete degradation of NAP within 20 min, which is notably more efficient than the solar/MIL-88-A/PS/SMX system described by Abou Khalil et al.64 Despite the higher catalyst concentration (125 mg L−1) used in their study, our system achieved full degradation at a lower catalyst loading.In terms of UVA irradiation, our UVA/MIL-88-A/PS/NAP system attained an 87% degradation rate within 100 min, demonstrating a competitive degradation capability when compared with the reported degradation of SMX under similar conditions.64 These findings not only underscore the catalytic prowess of MIL-88-A within PS-AOPs but also emphasize the solar-driven system's potential to surpass the performance of systems under artificial UVA irradiation.
While a precise performance comparison is constrained by differences in initial experimental conditions, the presented evidence substantiates the promise of MIL-88-A as a robust catalyst in solar-mediated AOPs for wastewater treatment.
| [NAP]t − [NAP]0 = kobst | (5) |
7.5. Matrix effect: solar vs. UVA-activated systems
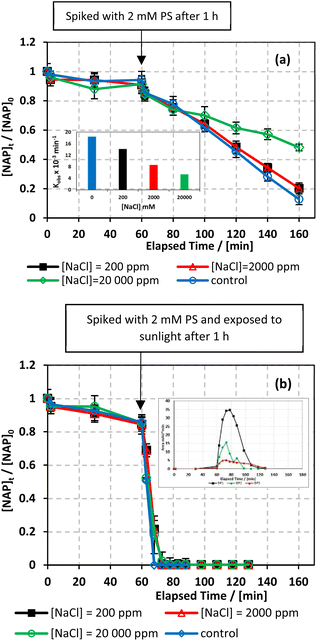
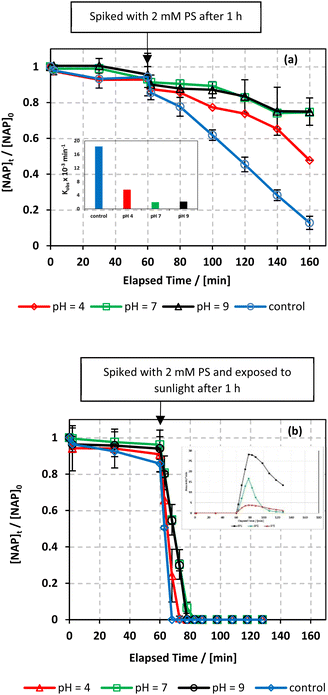
![[thin space (1/6-em)]](https://www.rsc.org/images/entities/char_2009.gif) 000 mg L−1) were tested.66 As shown in Fig. 8, the addition of up to 2000 mg L−1 of chlorides in UVA/MIL-88-A/PS/NAP caused a slight inhibition in the % degradation of NAP (overlapped data). A more noticeable inhibition was observed in saline water, as indicated by the decrease in kobs from 14.05 × 10⁻³ min−1 to 5.30 × 10⁻³ as the [NaCl] increases from 2000 mg L−1 to 20
000 mg L−1) were tested.66 As shown in Fig. 8, the addition of up to 2000 mg L−1 of chlorides in UVA/MIL-88-A/PS/NAP caused a slight inhibition in the % degradation of NAP (overlapped data). A more noticeable inhibition was observed in saline water, as indicated by the decrease in kobs from 14.05 × 10⁻³ min−1 to 5.30 × 10⁻³ as the [NaCl] increases from 2000 mg L−1 to 20![[thin space (1/6-em)]](https://www.rsc.org/images/entities/char_2009.gif) 000 mg L−1, as seen in Fig. 8a. This is due to the excess of Cl− that would scavenge Cl˙ to produce dichloride radicals, which are less effective than sulfate and/or hydroxyl radicals67 (eqn (6) and (7)). In the solar/MIL-88-A/PS/NAP system, the addition of chloride ions in the three different concentrations had a less significant effect on NAP degradation but delayed the degradation of all transformation products, as seen in the inset in Fig. 8b. As the concentration of added Cl− increased, the inhibition became more noticeable compared to the NaCl-free system under solar radiation, where NAP and its transformation products underwent full degradation in a much shorter time. These findings are consistent with prior studies on UV/PS activated systems conducted by Ghauch et al.28,29 In these systems, ketoprofen degradation was inhibited in brackish water and, more substantially, in saline water where the concentration of Cl− ions is greater than 10 mM (584 mg L−1 of NaCl), and the chloride quenching effect is more evident. The resistance of the solar/MIL-88-A/PS system to added chlorides can be explained by the generation of Cl˙ having a similar oxidative potential (E0 = 2.432 V) to sulfate and hydroxyl radicals.68 pH changes in the experiment were reported in Table S1,† where pHi decreased from 6.10 to 5.79 and pHf decreased from 3.73 to 4.56 in the UVA system.
000 mg L−1, as seen in Fig. 8a. This is due to the excess of Cl− that would scavenge Cl˙ to produce dichloride radicals, which are less effective than sulfate and/or hydroxyl radicals67 (eqn (6) and (7)). In the solar/MIL-88-A/PS/NAP system, the addition of chloride ions in the three different concentrations had a less significant effect on NAP degradation but delayed the degradation of all transformation products, as seen in the inset in Fig. 8b. As the concentration of added Cl− increased, the inhibition became more noticeable compared to the NaCl-free system under solar radiation, where NAP and its transformation products underwent full degradation in a much shorter time. These findings are consistent with prior studies on UV/PS activated systems conducted by Ghauch et al.28,29 In these systems, ketoprofen degradation was inhibited in brackish water and, more substantially, in saline water where the concentration of Cl− ions is greater than 10 mM (584 mg L−1 of NaCl), and the chloride quenching effect is more evident. The resistance of the solar/MIL-88-A/PS system to added chlorides can be explained by the generation of Cl˙ having a similar oxidative potential (E0 = 2.432 V) to sulfate and hydroxyl radicals.68 pH changes in the experiment were reported in Table S1,† where pHi decreased from 6.10 to 5.79 and pHf decreased from 3.73 to 4.56 in the UVA system.| SO4˙− + Cl− → Cl˙ + SO42− | (6) |
| Cl˙ + Cl− → Cl2˙− | (7) |
| Cl2˙− + Cl2˙− → 2Cl− + Cl2 | (8) |
| Fe3+ + H2PO4− ⇌ FeH2PO42+ | (9) |
| Fe3+ + H2PO4− ⇌ FePO4 + 2H+ | (10) |
| Fe3+ + OH− ⇌ Fe(OH)2+ | (11) |
| 2Fe3+ + 2OH− ⇌ Fe2OH24+ | (12) |
| 2Fe2OH24+ + P(V) ⇌ Fe2PV | (13) |
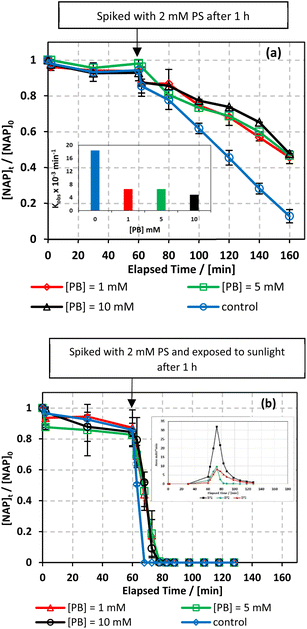
In our experimental conditions, it is likely that the abovementioned equations occur, albeit at varying rates. For instance, the hydrolysis reactions of metal cations (Fe3+) (eqn (11)–(13)) would occur rapidly if the solution was devoid of phosphate. However, in the presence of phosphate anions, the hydrolysis reactions are hindered, whereas the formation of the iron–phosphate complex (eqn (9) and (10)) is enhanced. As the reaction progresses, ferric cations are generated concurrently with their complexation with phosphate anions, resulting in the formation of Fe4PV, which is a tetranuclear iron–phosphate complex.
This was demonstrated in two independent studies on the degradation of sulfamethoxazole (SMX) and ranitidine (RAN) in Fe/PS systems.62,72 As shown in Table S1,† both systems showed a decrease in pHi from 6.10 to 4.66 and from 6.12 to 4.83 in the UVA and solar systems, respectively, as well as an increase in pHf, from 3.73 to 4.25 and from 2.51 to 3.27 in the UVA and solar systems, respectively, when [PB] increased from 1 to 10 mM.
| SO4˙− + HCO3− → SO42− + CO3˙− + H+ | (14) |
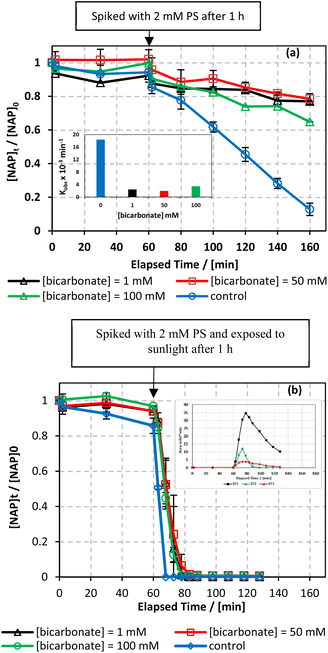
Moreover, the pHi and pHf of the solution increased from 6.10 to 8.86 and from 3.37 to 8.59, respectively, as [HCO3−] increased from 0 to 100 mM (Table S1†). A similar inhibition was observed when varying the pH of the system (Section 7.5.3). An earlier study indicated that acidifying a bicarbonate-buffered solution could reverse the inhibitory effect. In fact, acidification removes carbonate species from the solution, favouring the reactivity of SRs with organic pollutants over carbonate species and hydroxyl anions.24
7.6. EPR measurements
AOP PS-based systems mainly rely on the formation of SRs and HRs upon activation; however, the identification of these species via competitive kinetics using quenchers such as TBA and MeOH may not be very accurate due to strong interferences between quenchers and the active sites of MIL-88-A, the heterogeneous catalyst. As a result, the EPR technique, with common 5,5-dimethyl-1-pyrroline N-oxide (DMPO) as the free radical trapping agent, was chosen as an appropriate analytical technique capable of identifying the presence of radicals to elucidate the role of the expected ROS in the catalytic system of MIL-88-A/PS.72,77,78EPR analysis was used to investigate the presence of radicals in different systems: system 1 (MIL-88-A), system 2 (PS), system 3 (MIL-88-A/PS), and system 4 (MIL-88-A/PS/NAP). The analysis in Fig. S5 and S6† revealed significant peaks in the EPR spectra of systems 2, 3, and 4, indicating the presence of radicals. DMPO–OH adducts suggested the formation of hydroxyl radicals, whereas the presence of DMPO–CH3 adducts indicated the existence of methyl radicals. The results provided insights into the radical reactions occurring in the catalytic systems. Rim et al. further discussed the implications of these findings in the context of their study.33
7.7. Degradation mechanism
As depicted in Fig. S7,† the UVA irradiation provides the requisite energy to facilitate the reduction of Fe(III) to Fe(II) within MIL-88-A (eqn (15)). This reduction step is critical for the subsequent cleavage of PS to form sulfate radicals (eqn (16)), which are potent oxidants for degrading NAP molecules.
The overall activation process can be summarized by the following reactions:33,80,81
![[triple bond, length as m-dash]](https://www.rsc.org/images/entities/char_e002.gif) Fe(III) + S2O82− → Fe(III) + S2O82− → ![[triple bond, length as m-dash]](https://www.rsc.org/images/entities/char_e002.gif) Fe(II) + S2O8˙− Fe(II) + S2O8˙− | (15) |
![[triple bond, length as m-dash]](https://www.rsc.org/images/entities/char_e002.gif) Fe(II) + S2O82− → Fe(II) + S2O82− → ![[triple bond, length as m-dash]](https://www.rsc.org/images/entities/char_e002.gif) Fe(III) + SO4˙− + SO42− Fe(III) + SO4˙− + SO42− | (16) |
The dynamic equilibrium between Fe(II) and Fe(III) is crucial since it perpetuates the generation of sulfate radicals. In an aerobic environment, any Fe(II) produced is rapidly reoxidized to Fe(III), thereby sustaining the catalytic cycle and promoting the continuous degradation of NAP molecules.33,80,81
Additionally, the presence of H2O within the reaction milieu contributes to the generation of hydroxyl radicals, expanding the diversity of reactive species that target and degrade the NAP.33,80,81
This proposed mechanistic pathway aligns with the current literature on radical processes within photochemical AOPs and leverages the intrinsic properties of MIL-88-A to activate PS, without the need for additional chemical reagents or external energy inputs, aside from UVA light. However, it should be noted that the intricate nature of this system prohibits a straightforward kinetics study using scavengers due to potential secondary interactions with MIL-88-A.
8. Conclusion
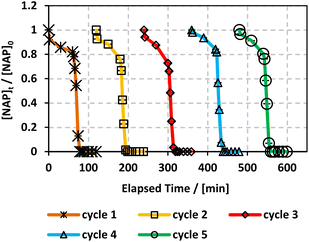
In this study, NAP was efficiently degraded in a PS-based AOPs system. MIL-88-A, an iron-based MOF synthesized in a green environment, was employed to improve previous findings. NAP degradation systems using two different energy sources (UVA and solar irradiation) were compared. Both UVA/MIL-88-A/PS and solar/MIL-88-A/PS were effective for the removal of NAP in a reasonable amount of time, with solar/MIL-88-A/PS system achieving total degradation of NAP ([NAP] = 50 mg L−1) in just 10–15 min after spiking with PS. Furthermore, only the solar/MIL-88-A/PS quickly achieved the additional degradation of the transformation products, whereas both the solar/MIL-88-A and solar/PS systems did not. This proves the existence of a synergistic effect of all the components of the system that enhances the performance and achieves further mineralization. Our results also showed that MIL-88-A is recyclable and effective over five cycles in PS activation, without the need for any regeneration process. Therefore, we propose MIL-88-A as a potential mediator for solar PS activation in the treatment of hazardous effluents containing pharmaceuticals and difficult-to-degrade organic micro-contaminants. Furthermore, the identification of both zero-order and first-order kinetics highlights the influence of different factors on the reaction rates. These findings indicate the diverse mechanisms and factors influencing the photochemical reactions of NAP and provide valuable insights for optimizing reaction conditions and understanding the underlying processes. This technology can be applied in facilities where solar is the only available source of energy for large-scale remediation, such as in situ chemical oxidation (ISCO). Further research is required to investigate activation using concentrated solar power and to modify MIL-88-A using additional functional groups to enhance catalytic efficiency. Furthermore, other PS activation techniques, such as thermal, ultrasonic, and chemical, should be investigated.Conflicts of interest
There are no conflicts to declare.Acknowledgements
This research was funded in part by the University Research Board (award numbers 104261 and 104391) of the American University of Beirut and USAID-Lebanon through The National Academy of Sciences under PEER project 5–18 (award number 103262). The authors are thankful to Joan Younes, Simon Al-Ghawi and Boutros Sawaya for their technical assistance and the personnel of the K. Shair CRSL for their kind help. They are also very thankful to Dr Maxim Yilkov and Sahar Naim (ETH, Switzerland) who helped in performing the EPR analysis.References
- A. B. A. Boxall, M. A. Rudd, B. W. Brooks, D. J. Caldwell, K. Choi, S. Hickmann, E. Innes, K. Ostapyk, J. P. Staveley, T. Verslycke, G. T. Ankley, K. F. Beazley, S. E. Belanger, J. P. Berninger, P. Carriquiriborde, A. Coors, P. C. DeLeo, S. D. Dyer, J. F. Ericson, F. Gagné, J. P. Giesy, T. Gouin, L. Hallstrom, M. V. Karlsson, D. G. Joakim Larsson, J. M. Lazorchak, F. Mastrocco, A. McLaughlin, M. E. McMaster, R. D. Meyerhoff, R. Moore, J. L. Parrott, J. R. Snape, R. Murray-Smith, M. R. Servos, P. K. Sibley, J. O. Straub, N. D. Szabo, E. Topp, G. R. Tetreault, V. L. Trudeau and G. Van Der Kraak, Environ. Health Perspect., 2012, 120, 1221–1229 CrossRef PubMed.
- V. Burkina, V. Zlabek and G. Zamaratskaia, Environ. Toxicol. Pharmacol., 2015, 40, 430–444 CrossRef CAS PubMed.
- U. Memmert, A. Peither, R. Burri, K. Weber, T. Schmidt, J. P. Sumpter and A. Hartmann, Environ. Toxicol. Chem., 2013, 32, 442–452 CrossRef CAS PubMed.
- A. J. Ebele, M. Abou-Elwafa Abdallah and S. Harrad, Emerging Contam., 2017, 3, 1–16 CrossRef.
- J. L. Liu and M. H. Wong, Environ. Int., 2013, 59, 208–224 CrossRef CAS PubMed.
- J. L. Tambosi, L. Y. Yamanaka, H. J. José, R. De Fátima Peralta Muniz Moreira and H. F. Schröder, Quim. Nova, 2010, 33(2), 411–420 CrossRef CAS.
- P. Bottoni, S. Caroli and A. B. Caracciolo, Toxicol. Environ. Chem., 2010, 92, 549–565 CrossRef CAS.
- K. E. Arnold, A. R. Brown, A. R. Brown, G. T. Ankley and J. P. Sumpter, Philos. Trans. R. Soc., B, 2014, 369(1656) DOI:10.1098/rstb.2013.0569.
- G. R. Boyd, J. M. Palmeri, S. Zhang and D. A. Grimm, Sci. Total Environ., 2004, 333, 137–148 CrossRef CAS PubMed.
- D. Ashton, M. Hilton and K. V. Thomas, Sci. Total Environ., 2004, 333, 167–184 CrossRef CAS PubMed.
- N. Lindqvist, T. Tuhkanen and L. Kronberg, Water Res., 2005, 39, 2219–2228 CrossRef CAS PubMed.
- N. Nakada, T. Tanishima, H. Shinohara, K. Kiri and H. Takada, Water Res., 2006, 40, 3297–3303 CrossRef CAS PubMed.
- M. Carballa, F. Omil, J. M. Lema, M. Llompart, C. García-Jares, I. Rodríguez, M. Gómez and T. Ternes, Water Res., 2004, 38, 2918–2926 CrossRef CAS PubMed.
- R. Andreozzi, V. Caprio, A. Insola and R. Marotta, Catal. Today, 1999, 53, 51–59 CrossRef CAS.
- P. R. Gogate and A. B. Pandit, Adv. Environ. Res., 2004, 8, 501–551 CrossRef CAS.
- N. Lindqvist, T. Tuhkanen and L. Kronberg, Water Res., 2005, 39, 2219–2228 CrossRef CAS PubMed.
- C. Wei, F. Zhang, Y. Hu, C. Feng and H. Wu, Rev. Chem. Eng., 2017, 33, 49–89 CrossRef CAS.
- S. O. Ganiyu, M. Zhou and C. A. Martínez-Huitle, Appl. Catal., B, 2018, 235, 103–129 CrossRef CAS.
- B. A. Wols and C. H. M. Hofman-Caris, Water Res., 2012, 46, 2815–2827 CrossRef CAS PubMed.
- J. Wang and S. Wang, Chem. Eng. J., 2018, 334, 1502–1517 CrossRef CAS.
- J. Xie, C. Yang, X. Li, S. Wu and Y. Lin, Chemosphere, 2023, 339, 139659 CrossRef CAS PubMed.
- S. Wu, L. Shen, Y. Lin, K. Yin and C. Yang, Chem. Eng. J., 2021, 414, 128872 CrossRef CAS.
- Y. Wang, Y. Lin, S. He, S. Wu and C. Yang, J. Hazard. Mater., 2024, 461, 132538 CrossRef CAS PubMed.
- A. Ghauch, G. Ayoub and S. Naim, Chem. Eng. J., 2013, 228, 1168–1181 CrossRef CAS.
- S. Naim and A. Ghauch, Chem. Eng. J., 2016, 288, 276–288 CrossRef CAS.
- M. Amasha, A. Baalbaki, S. Al Hakim and R. El Asmar, J. Adv. Oxid. Technol., 2018, 21(1), 261–273 CrossRef.
- Y. Liu, X. He, Y. Fu and D. D. Dionysiou, J. Hazard. Mater., 2016, 305, 229–239 CrossRef CAS PubMed.
- A. Ghauch, A. Baalbaki, M. Amasha, R. El Asmar and O. Tantawi, Chem. Eng. J., 2017, 317, 1012–1025 CrossRef CAS.
- M. Amasha, A. Baalbaki and A. Ghauch, Chem. Eng. J., 2018, 350, 395–410 CrossRef CAS.
- A. Ghauch, A. M. Tuqan and N. Kibbi, Chem. Eng. J., 2012, 197, 483–492 CrossRef CAS.
- A. Ghauch, A. M. Tuqan, N. Kibbi and S. Geryes, Chem. Eng. J., 2012, 213, 259–271 CrossRef CAS.
- G. Ayoub and A. Ghauch, Chem. Eng. J., 2014, 256, 280–292 CrossRef CAS.
- R. El Asmar, A. Baalbaki, Z. Abou Khalil, S. Naim, A. Bejjani and A. Ghauch, Chem. Eng. J., 2021, 405, 126701 CrossRef CAS.
- Z. A. Khalil, A. Baalbaki, A. Bejjani and A. Ghauch, Environ. Sci. Adv., 2022, 1, 797–813 CAS.
- M. G. Antoniou, A. A. de la Cruz and D. D. Dionysiou, Appl. Catal., B, 2010, 96, 290–298 CrossRef CAS.
- K. Y. Andrew Lin, H. A. Chang and C. J. Hsu, RSC Adv., 2015, 5, 32520–32530 RSC.
- S. Wu, Z. Yang, Z. Zhou, X. Li, Y. Lin, J. J. Cheng and C. Yang, J. Hazard. Mater., 2023, 459, 132133 CrossRef CAS PubMed.
- S. Wu, C. Yang, Y. Lin and J. J. Cheng, J. Environ. Sci., 2022, 115, 330–340 CrossRef CAS PubMed.
- S. Wu, H. Liu, C. Yang, X. Li, Y. Lin, K. Yin, J. Sun, Q. Teng, C. Du and Y. Zhong, Chem. Eng. J., 2020, 392, 123683 CrossRef CAS.
- N. A. Khan, Z. Hasan and S. H. Jhung, J. Hazard. Mater., 2013, 244–245, 444–456 CrossRef CAS PubMed.
- G. Férey, Chem. Soc. Rev., 2008, 37, 191–214 RSC.
- P. Z. Moghadam, A. Li, S. B. Wiggin, A. Tao, A. G. P. Maloney, P. A. Wood, S. C. Ward and D. Fairen-Jimenez, Chem. Mater., 2017, 29, 2618–2625 CrossRef CAS.
- J. Wang, J. Wan, Y. Ma, Y. Wang, M. Pu and Z. Guan, RSC Adv., 2016, 6, 112502–112511 RSC.
- P. Horcajada, R. Gref, T. Baati, P. K. Allan, G. Maurin, P. Couvreur, G. Férey, R. E. Morris and C. Serre, Chem. Rev., 2012, 1232–1268 CrossRef CAS PubMed.
- A. C. McKinlay, R. E. Morris, P. Horcajada, G. Férey, R. Gref, P. Couvreur and C. Serre, Angew. Chem., Int. Ed., 2010, 49, 6260–6266 CrossRef CAS PubMed.
- M. Kurmoo, Chem. Soc. Rev., 2009, 38(5), 1353–1379 RSC.
- T. Uemura, N. Yanai and S. Kitagawa, Chem. Soc. Rev., 2009, 38(5), 1228–1236 RSC.
- J. Lee, O. K. Farha, J. Roberts, K. A. Scheidt, S. T. Nguyen and J. T. Hupp, Chem. Soc. Rev., 2009, 38(5), 1450–1459 RSC.
- S. Bhattacharjee, J. S. Choi, S. T. Yang, S. B. Choi, J. Kim and W. S. Ann, J. Nanosci. Nanotechnol., 2010, 10, 135–141 CrossRef CAS PubMed.
- J. J. Du, Y. P. Yuan, J. X. Sun, F. M. Peng, X. Jiang, L. G. Qiu, A. J. Xie, Y. H. Shen and J. F. Zhu, J. Hazard. Mater., 2011, 190, 945–951 CrossRef CAS PubMed.
- H. Liu, X. Ren and L. Chen, J. Ind. Eng. Chem., 2016, 34, 278–285 CrossRef CAS.
- X. Li, W. Guo, Z. Liu, R. Wang and H. Liu, Appl. Surf. Sci., 2016, 369, 130–136 CrossRef CAS.
- T. Chalati, P. Horcajada, R. Gref, P. Couvreur and C. Serre, J. Mater. Chem., 2011, 21, 2220–2227 RSC.
- J. Wang, J. Wan, Y. Ma, Y. Wang, M. Pu and Z. Guan, RSC Adv., 2016, 6, 112502–112511 RSC.
- W. Huang, C. Jing, X. Zhang, M. Tang, L. Tang, M. Wu and N. Liu, Chem. Eng. J., 2018, 349, 603–612 CrossRef CAS.
- C. Du, Y. Zhang, Z. Zhang, L. Zhou, G. Yu, X. Wen, T. Chi, G. Wang, Y. Su, F. Deng, Y. Lv and H. Zhu, Chem. Eng. J., 2022, 431, 133932 CrossRef CAS.
- A. Baalbaki, G. M. Ayoub, M. Al-Hindi and A. Ghauch, Sci. Total Environ., 2017, 574, 583–593 CrossRef CAS PubMed.
- Y. He and I. Hua, Abstracts of Papers of the American Chemical Society, 2013, vol. 246 Search PubMed.
- J. L. Packer, J. J. Werner, D. E. Latch, K. McNeill and W. A. Arnold, Aquat. Sci., 2003, 65, 342–351 CrossRef CAS.
- V. M. Vulava, W. C. Cory, V. L. Murphey and C. Z. Ulmer, Sci. Total Environ., 2016, 565, 1063–1070 CrossRef CAS PubMed.
- L. Malaeb, G. M. Ayoub, M. Al-Hindi, L. Dahdah, A. Baalbaki and A. Ghauch, Energy Procedia, 2017, 119, 723–732 CrossRef CAS.
- S. Naim and A. Ghauch, Chem. Eng. J., 2016, 288, 276–288 CrossRef CAS.
- S. Al Hakim, A. Baalbaki, O. Tantawi and A. Ghauch, RSC Adv., 2019, 9, 33472–33485 RSC.
- R. El Asmar, A. Baalbaki, Z. Abou Khalil, S. Naim, A. Bejjani and A. Ghauch, Chem. Eng. J., 2021, 405, 126701 CrossRef CAS.
- W. Ren, J. Gao, C. Lei, Y. Xie, Y. Cai, Q. Ni and J. Yao, Chem. Eng. J., 2018, 349, 766–774 CrossRef CAS.
- H. A. Gorrell, Am. Assoc. Pet. Geol. Bull., 1958, 42(10), 2513 Search PubMed.
- D. T. Oyekunle, J. Cai, E. A. Gendy and Z. Chen, Chemosphere, 2021, 280, 130949 CrossRef CAS PubMed.
- Z. Liu, H. Lan, Y. Wang, J. Zhang, J. Qin, R. Zhang and N. Dong, Chem. Eng. J., 2022, 429, 132485 CrossRef CAS.
- L. Zhao, Y. Ji, D. Kong, J. Lu, Q. Zhou and X. Yin, Chem. Eng. J., 2016, 303, 458–466 CrossRef CAS.
- A. Ghauch, Chemosphere, 2008, 71, 816–826 CrossRef CAS PubMed.
- G. Lente, M. Elizabeth, A. Magalhães and I. Fábián, Inorg. Chem., 2000, 39, 1950–1954 CrossRef CAS PubMed.
- X. Duan, C. Su, J. Miao, Y. Zhong, Z. Shao, S. Wang and H. Sun, Appl. Catal., B, 2018, 220, 626–634 CrossRef CAS.
- A. Cai, J. Deng, X. Ling, C. Ye, H. Sun, Y. Deng, S. Zhou and X. Li, Water Res., 2022, 215, 118288 CrossRef CAS PubMed.
- C. Tan, N. Gao, S. Zhou, Y. Xiao and Z. Zhuang, Chem. Eng. J., 2014, 253, 229–236 CrossRef CAS.
- Y. qiong Gao, N. yun Gao, D. qiang Yin, F. xiang Tian and Q. feng Zheng, Chemosphere, 2018, 201, 50–58 CrossRef PubMed.
- S. Zhu, H. Li, L. Wang, Z. Cai, Q. Wang, S. Shen, X. Li and J. Deng, Chem. Eng. J., 2023, 458, 141415 CrossRef CAS.
- Y. Liu, X. Chen, Y. Yang, Y. Feng, D. Wu and S. Mao, Chem. Eng. J., 2019, 358, 408–418 CrossRef CAS.
- Z. Wei, F. A. Villamena and L. K. Weavers, Environ. Sci. Technol., 2017, 51, 3410–3417 CrossRef CAS PubMed.
- A. Ghauch, A. M. Tuqan and N. Kibbi, Chem. Eng. J., 2015, 279, 861–873 CrossRef CAS.
- K.-Y. A. Lin, H.-A. Chang and C.-J. Hsu, RSC Adv., 2015, 5, 32520–32530 RSC.
- H. Liu, T. A. Bruton, F. M. Doyle and D. L. Sedlak, Environ. Sci. Technol., 2014, 48(17), 10330–10336 CrossRef CAS PubMed.
Footnote |
| † Electronic supplementary information (ESI) available. See DOI: https://doi.org/10.1039/d3va00290j |
| This journal is © The Royal Society of Chemistry 2024 |

