 Open Access Article
Creative Commons Attribution 3.0 Unported Licence
Synthesis and characterization of La QDs: sensors for anions and H2O2†
Amit
Sahoo
 and
Achyuta N.
Acharya
 *
*
School of Basic Sciences & Humanities (Chemistry), Odisha University of Technology and Research, Bhubaneswar-751029, Odisha, India. E-mail: amitsahoochemistry@gmail.com; aacharya@outr.ac.in
First published on 26th July 2024
Abstract
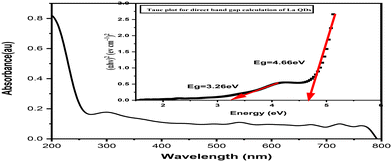
The development of sensitive and accurate fluorescence sensors for the detection of anions and reactive oxygen species (ROS, H2O2) is essential as they play significant roles in biological and chemical processes. In this work, semiconductor La QDs were synthesized. The synthesized La QDs were determined to be pure with 100% La element using EDS technique. La QDs were observed in both cubic and hexagonal lattice configurations through powder XRD analysis. The morphology of the La QDs was characterized using HRTEM and FESEM data as tiny, spherical, homogenous QDs with a diameter ranging from 2 to 6 nm. The fluorescence characteristics of the synthesized La QDs were examined by studying their sensing properties that increased with an increase in anion concentration and decreased with an increase in [H2O2]. The variation in emission intensity at 315 nm and 440.5 nm satisfied the Stern–Volmer equation. The LOD and LOQ of H2O2 and anion sensing with La QDs were studied in the μM range. The Langmuir binding plots and FTIR spectra supported the concept that the surface functionalization of La QDs occurred in the presence of anions. With two band gap energies of about 3.26 eV and 4.66 eV, the synthesized La QDs are a mixture of two (binary) semiconductors.
1. Introduction
Quantum dots (QDs) are highly sought owing to their size-dependent optical and electronic properties, i.e., offering potential applications in nanoelectronics,1 optoelectronics, lasers, solar cells, light-emitting diodes, and quantum computation.2 Because of their unique optical properties and surface modification, QDs are suitable for bio-labeling and bio-imaging.3–5 In addition, QDs have been employed in fluorescence sensing systems for a variety of analytes.6–11 These sensors are categorized into three types: fluorescence resonance energy transfer (FRET), electron transfer, and surface-state-controlled fluorescence. The fluorescence of QDs is caused by photoinduced electron and hole recombination.12Metal and semiconductor nanocrystals of size 1 to 20 nm have been synthesized using size-selective separation and solution-phase synthesis methods.13 Singh et al.14 reviewed the potentialities of bioinspired metal and metal-oxide nanoparticles in biomedical science. Body-centered cubic (BCC) structured La2O3 nanoparticles of size between 52 and 74 nm have been synthesized using Moringa oleifera leaf extract as a reducing agent via the photosynthesis method.15 Lanthanum oxide nanoparticles have been synthesized from hexagonally structured lanthanum hydroxides through calcination at 600 °C for 2 h using the sonochemical method.16 Through the sonochemical method, a new nano-sized La(III) supramolecular compound was synthesized and then calcined to 60 nm-sized lanthanum oxides at 800 °C in an ambient atmosphere.17 La2O3 nanoplates and La(OH)3 nanorods have been synthesized from La(NO3)3·6H2O and formamide via facile aqueous solution synthesis at room temperature. The synthesized particles of size 14 to 18 nm have photoluminescence properties.18 By employing atomic layer epitaxy, thin layer deposition of lanthanum oxide and stability from a β-diketonate precursor have been studied by Nieminen et al.19 Glioblastoma (GBM), a deadly brain tumor with a bleak prognosis, cells may be treated with nanoparticle therapy, specifically lanthanum oxide (La2O3) NPs. These nanoparticles have the ability to reach the brain, dissociate, and amplify the effects of radiation therapy and chemotherapy. The cytotoxic features of NPs, which include reactive oxygen species (ROS) and apoptotic pathways, have been found to improve the therapeutic benefits of chemotherapy with temozolomide and radiation therapy.20
By a one-pot hydrothermal synthesis process of lanthanum oxycarbonate, hollow spheres composed of 15 nm nanoparticles are fabricated using glucose, which exhibits visible luminescence.21 On titanium, the layers of lanthanum oxycarbonate and lanthanum oxide were fabricated through electrodeposition using an organic solution. At different voltages, temperatures, and times, different-sized particle fabrication was studied.22 Ansari et al. have reported the synthesis and characterization of iron lanthanum oxide nanoparticles (FeLO NPs) and their application in environmental remediation.23 These NPs degrade industrial-grade dye up to 90%, indicating that these can be used as effective and long-lasting photocatalysts for the treatment of dye-containing waste water.23 Hexagonal type-II La2O2CO3+:Eu3+ nanospheres and La2O3:Eu3+ NPs were synthesized by a hydrothermal method followed by calcination at 873 K.24 Chemo-resistive CO2 gas sensing La2O2CO3 nanorods of diameter 13–15 nm and length 100–150 nm were synthesized from La(OH)3 nanorods by heating in a furnace at 400 °C for 2 h.25 Nanoparticles of La2O2CO3 of average size 35 nm, La2O3, and La(OH) 3 were prepared by a simple thermal decomposition method at 700 °C for 5 hours and were also used in photocatalytic degradation (under UV irradiation) of methyl orange dye.26
LaVO4:Bi3+ was synthesized by a co-precipitation method followed by heat treatment and its luminescence properties were studied.27 Multifunctional La-doped carbon QDs of diameter 4.3 nm were synthesized, and the quenching was also tested in the emission spectra in the presence of mercury ions.28 Fabrication by a co-precipitation method and the photoluminescence properties of LaF3:Eu3+ nanoparticles of size 12 nm were studied by Grzyb et al.29 LaF3:Ce (Ce doped LaF3) nano powder of diameters between 40 and 15 nm and oleic acid (OA)-modified LaF3:Ce nanoparticles of size between 5 and 10 nm were prepared through an in situ hydrothermal process at various concentrations of dopants.30 Co-doped nanocrystals of LaF3:Ce,Yb,Gd, and LaF3:Ce have been synthesised by a chemical synthesis method, and their photoluminescence and scintillating properties have been studied by Vargas et al.31 Tris(2-pyridylmethyl)amine-ligated lanthanide complexes exhibit anion-specific sensory capabilities, with the chiral ligand and lanthanide center influencing selectivity and response sensitivity.32
The difficulty in supramolecular anionic species recognition has become a serious problem, particularly in systems biology, catalytic processes, and analytical applications. Because anions have a lower charge-to-radius ratio and a greater propensity to establish hydrogen bonds with proton–donor liquids, developing synthetic receptors for them is difficult.33–38 Photoinduced electron transfer (PET) sensors have been used to develop fluorescent probes that switch on for anions operating in aqueous solutions, which is a common application. These probes are developed for detecting anions and nucleotides in solutions based on PET sensors and molecular logic gates. PET anion probe development has substantially expanded the field of fluorescent probes, allowing for more accurate detection of anions and their interactions with different molecules.39 For cellular activity and pathological states, enzymes are essential. Modern enzyme assays make use of luminous lanthanide(III) complexes, which have long luminescence lifetimes, high detection sensitivity, and line-like emission spectra for ratiometric and time-resolved studies. New strategies include polyphosphate anion luminescence signaling and anion-responsive lanthanide complexes for molecular recognition.40 Based on dipeptides, folded-turn amido thioureas are used in a conformation switching-based fluorescence sensing technique41–44 because of their superior ratiometric fluorescence response and increased emission of exciplex or excimer. Compounds of L-phenylalanine (L-Phe4 and L-Phe3) exhibit a stronger dual emission towards the fluoride anion.45 Oxalate is an essential component found in plants and can harm the kidneys in the human system; it is critical for food chemistry and inductive analysis. Its high levels in the urine are a sign of pancreatic insufficiency, renal lesions, and kidney failure. The macrocyclic copper complex exhibits very selective and binding affinity (>107 M−1)-sensitive off–on fluorescence sensing for oxalate in water.46 Terbium (Tb(III)) shows delayed lanthanide luminescence (luminescence of lanthanide group), with the diaryl-urea complex of Tb being significantly enhanced when dihydrogen phosphate (H2PO4−) is recognized in an acetonitrile medium. This is due to numerous anion binding through hydrogen bonding interactions and possible metal ion coordination to Tb(III).47
As anions play important roles in many biological and chemical processes, the displacement approach is a strategy for building new optical anion chemosensors with high sensitivity and selectivity. Using this method, numerous good optical anion chemosensors have been developed.48 In living systems, reactive oxygen species (ROS/RNS) play a key role. A crucial messenger in typical cell signal transduction is the stable ROS H2O2.49 Imbalances in the generation of H2O2 result in oxidative stress and inflammation, which are associated with advanced diseases including cancer, cardiovascular problems, and Alzheimer's as well as with aging. Understanding these processes requires knowledge of how cells create and direct H2O2 into particular signaling pathways. Fluorescent chemosensors have been developed to monitor hydrogen peroxide, metal ions, dopamine, carbohydrates, and other physiologically relevant molecules.48 A flexible, reusable solid-state fluoride ion sensor combines laser-patterned carbon (LP-C) and g-CNQD sensitivity, mimicking horseradish peroxidase for selective and user-friendly sensing in natural water samples.50 Phosphate detection is crucial for biological and environmental reasons.51 A TRF (time-resolved fluorescence)-based sensor array uses three QDs, namely, MoS2, WS2, and MoSe2, as energy sensitizers for Tb3+ ions. CrO42− competitively binds to Tb3+, enhancing the efficiency and sensitivity in complex mixtures to phosphate detection.52 The water-soluble cyclodextrin-modified CdSe quantum dots (β-CD-QDs) have been developed, allowing for high stability in aqueous solutions. Oxoanions such as H2PO4 have significant quenching effects on the fluorescence of β-CD-QDs, with Ag+, Hg2+, and Co2+ having significant effects.53 CdTe QDs have been used to detect anions such as F− in aqueous solutions for environmental monitoring, medicinal diagnostics, and in vivo, with high sensitivity and selectivity.54 A CdSe–ZnS QD was surface-functionalized with 1-(2-mercapto-ethyl)-3-phenyl-thiourea and tested for selectivity towards tetrabutylammonium salts of fluoride, chloride, bromide, hydrogen sulphate, and acetate. The quench was due to an increase in the reduction potential of the receptor upon anion binding.55
To the best of our knowledge, no study has been reported on the one-pot synthesis of La QDs from lanthanum nitrate. In this article, we present a novel method for the simple one-pot synthesis of La QDs with high purity and yield. Lanthanum, exists at a +3 oxidation state in its nitrate salt, is reduced to 0 oxidation state and its sizes are in the range of 2–6 nm. The QDs were then characterized by XRD, XPS, HRTEM, FESEM-EDS, PCCS, and UV-visible spectroscopy (DRS). The photoluminescence properties of La QDs were studied. This study also highlights that La QDs could be considered as new optical anion chemosensors.56 Semiconducting La QDs are used as anion chemosensors to detect anions such as F−, Cl−, C2O42−, CO32−, HPO42−, Br−, BrO3−, and OH− ions and H2O2 (a major ROS).
2. Experimental
2.1. Materials and methods
Lanthanum nitrate (La(NO3)3·6H2O, AR grade, FINAR, India) as a La(III) source and sodium borohydride (NaBH4, Loba) were used as received. Millipore distilled water as a solvent (freshly prepared) for solution preparation was obtained from a Merck Millipore distillation setup.For the X-ray diffraction (XRD) study, a Bruker D8 Advance powder XRD system was used. A JEOL FESEM (JSM-7610F) and a JEOL HRTEM (JEM-2100 Plus) were used for Field Emission Scanning Electron Microscopy (FESEM) and HRTEM studies respectively. The optical band gap energy was determined using a UV-visible spectrometer (Jasco, V-770). The PCCS study was performed using a NANOPHOX (NX0019) instrument. The luminescence studies were performed using a Jasco Make (model FP-8200) Spectrofluorometer. The surface functionalization studies were performed using a Fourier Transform Infrared (FTIR) Spectrometer (PerkinElmer, Spectrum two).
2.2. Synthesis of La QDs
First, 35 mL of 0.1 M NaBH4 solution was added drop-wise into a 0.01 M lanthanum nitrate solution (∼0 °C) with continuous stirring in an ice bath. The mixture was kept for 24 hours at ∼10 °C (after which a grayish-white gelatinous precipitate of La QDs was formed). The gelatinous precipitate was centrifuged at 10![[thin space (1/6-em)]](https://www.rsc.org/images/entities/char_2009.gif) 000 RPM for 10 minutes and dried for about 5–6 hours in an oven at 95 °C (Scheme 2).
000 RPM for 10 minutes and dried for about 5–6 hours in an oven at 95 °C (Scheme 2).
The synthesis of La QDs from La(III) can be described by the following reaction scheme (Scheme 1):
3. Results and discussion
3.1. Characterization techniques
To determine the d-spacing (d) of the XRD peaks, Bragg's equation (E1) was used at λ = 0.15406 nm.57 The d-spacing values of the International Centre for Diffraction Data as PDF (powder diffraction file) no.: 96-900-8526 (La4, hexagonal), 96-900-8504 (La2, hexagonal), and 01-089-2913 (La, cubic) were matched with the d-spacing values of the synthesized La QDs. The Miller indices (h k l) were calculated from the PDF data file.58
The La QDs were characterized using the PXRD data. Seven peaks between 29 and 45 (as 2θ) were taken into account for characterization. It indicates the amorphous (mixture of various crystalline states) La QDs. Seven peaks were observed, which matched well with the PDF (standard) data no.: 96-900-8526 (La4, hexagonal), 96-900-8504 (La2, hexagonal), and 01-089-2913 (La, cubic), and these are presented in Table 1.
| No. | 2Theta [°] | FWHM [°] | d-Spacing [Å] | Miller indices (h k l) (hexagonal-La4) | Miller indices (h k l) (hexagonal-La2) | Miller indices (h k l) (cubic-La) | Intensity (%) | Crystalline grain size (nm) |
|---|---|---|---|---|---|---|---|---|
| 1 | 29.12791 | 0.437333 | 3.06584 | (0 0 4) | (— — —) | (— — —) | 19.13 | 0.32 |
| 2 | 29.64268 | 0.068333 | 3.01376 | (— — —) | (0 0 2) | (1 1 0) | 19.29 | 2.09 |
| 3 | 31.15831 | 0.109333 | 2.87053 | (1 0 2) | (1 0 1) | (— — —) | 20.93 | 1.31 |
| 4 | 40.36657 | 0.164 | 2.23444 | (1 0 4) | (— — —) | (— — —) | 27.23 | 0.90 |
| 5 | 40.84957 | 0.136667 | 2.20913 | (— — —) | (1 0 2) | (— — —) | 31.66 | 1.08 |
| 6 | 42.04564 | 0.437333 | 2.14901 | (— — —) | (— — —) | (2 0 0) | 52.6 | 0.33 |
| 7 | 44.38562 | 0.068333 | 2.041 | (0 0 6) | (— — —) | (— — —) | 100 | 2.19 |
From the FWHM and 2θ data of the peaks, the d-spacing values of each peak were calculated. The Miller indices (ESI† as E2 and E3) of the peaks were determined by matching the peak position, intensity, and d-spacing data of peaks with the PDF data. The crystalline grain size (ESI† as E4) of the La QDs was found to be ≈2 nm. The calculated values of the lattice constants match well with the same PDF data, and these are tabulated in Table 2.
| Crystal system | Lattice constant | Standard values (Å) | Calculated value (Å) |
|---|---|---|---|
| Hexagonal-La4 | a = b | 3.7700 | 3.7602 |
| c | 12.1590 | 12.2633 | |
| Hexagonal-La2 | a = b | 3.7500 | 3.7483 |
| c | 6.0700 | 6.0275 | |
| Cubic | a = b = c | 4.2600 | 4.2621 |
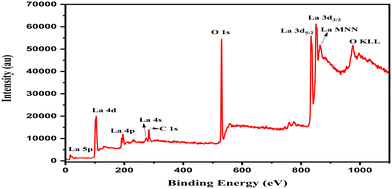
The high-resolution XPS spectrum of La 3d peaks is shown in Fig. 3. The dihedral peaks of La 3d5/2 and La 3d3/2 appeared in the synthesized La zero-oxidation state QDs. The La 3d peaks were observed at 836.08 eV and 852.92 eV for La 3d5/2 and 3d3/2 respectively. The satellite peaks were also observed at 839.46 eV and 856.28 eV for La 3d5/2 and La 3d3/2 respectively.59–61
| Sl no. | 1/D (nm−1) | 1/r (nm−1) | r (nm) | d-Spacing (Å) | Miller indices (h k l) (hexagonal-La4) | Miller indices (h k l) (hexagonal-La2) | Miller indices (h k l) (cubic-La) |
|---|---|---|---|---|---|---|---|
| 1 | 5.693 | 2.8465 | 0.351308625 | 3.513086246 | (— — —) | (— — —) | (— — —) |
| 2 | 6.233 | 3.1165 | 0.320872774 | 3.208727739 | (1 0 0) | (1 0 0) | (— — —) |
| 3 | 6.788 | 3.394 | 0.294637596 | 2.946375958 | (0 0 4) | (0 0 2) | (1 1 0) |
| 4 | 12.307 | 6.1535 | 0.162509141 | 1.625091411 | (2 0 0) | (2 0 0) | (2 2 0) |
| 5 | 16.146 | 8.073 | 0.123869689 | 1.238696891 | (2 1 0) | (2 1 0) | (2 2 2) |
| 6 | 19.815 | 9.9075 | 0.100933636 | 1.009336361 | (2 1 5) | (3 0 0) | (3 2 1) |
| 7 | 25.076 | 12.538 | 0.079757537 | 0.797575371 | (— — —) | (3 1 3) | (— — —) |
The elementary nature and purity of the La QDs were determined with the help of an EDS study (Fig. 8). Between the peak positions, the peaks of La QDs, in the peak position range of 0.67 to 0.99 keV, confirmed that the lanthanum is the only elementary species present in the sample with 100% purity (Table 4). The carbon peak is for the reference conductive carbon tape.
| Element | Weight% | Atomic% | Net int. |
|---|---|---|---|
| C K | 7.39 | 17.04 | 17.70 |
| O K | 42.08 | 72.87 | 128.83 |
| La M | 50.54 | 10.08 | 9.50 |
| No. | Band gap energy (eV) | Wavelength (nm) |
|---|---|---|
| 1 | 3.26 | 380.32 |
| 2 | 4.66 | 266.06 |
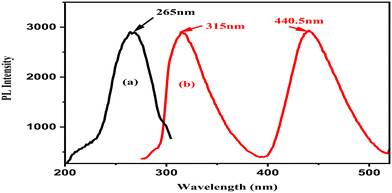 | ||
| Fig. 11 (a) Excitation spectra of the La QDs in ethanol with a maximum emission at 315 nm wavelength. (b) Emission spectra of the La QDs in ethanol with an excitation at 265 nm wavelength. | ||
 | ||
| Fig. 12 (a) Excitation spectra of the La QDs in ethanol with a maximum emission at 438.5 nm wavelength. (b) Emission spectra of the La QDs in ethanol with an excitation at 382.5 nm wavelength. | ||
| I0/I = 1 ± Ksv[Q] | (1) |
| y = A + Bx | (2) |
| Y = A − BCX | (3) |
| [C]/I = (1/I0)[C] + (1/BI0) | (4) |
The limit of detection (LOD) and limit of quantification (LOQ)69 of the anions and H2O2 sensors were calculated using eqn (5) and (6) respectively as follows:
| LOD = 3.3 × (σ/s) | (5) |
| LOQ = 10 × (σ/s) | (6) |
In Fig. 14(a–c), the fluorescence mechanism, used for La QDs in the sensing of anions and H2O2, emphasizes electronic transitions and the relationship between emission peaks and band gap energies. The quenching of La QD fluorescence occurs in the presence of H2O2. At room temperature (R.T.), the quenching behavior, i.e., the decrease in PL intensity of La QDs with the increase in the concentration of H2O2, satisfies the linearity of the Stern–Volmer equation. With the increase in temperature (at high temperature, H.T.), molecules move more quickly and diffuse, which leads to huge collisional events that are best represented by dynamic quenching. In contrast, in the case of static quenching, the complex dissociates (losing its bonds) with the increase in temperature (Fig. 14(d)).70
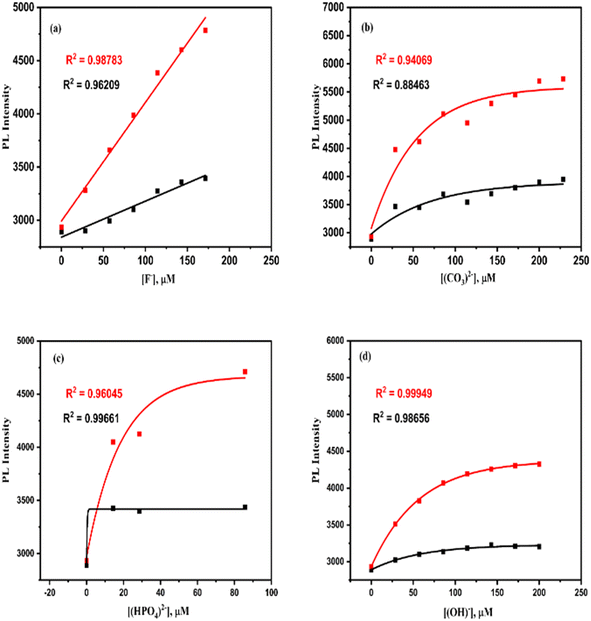
3.1.9.1. Anion sensing properties (F−, Cl−, C2O42−, CO32−, HPO42−, Br−, BrO3−, and OH−). The fluorescence studies for sensing anions were conducted at room temperature upon excitation at 265 nm with different micromolar concentrations of the anions, i.e., 0 ≤ [F−], μM ≤ 228.57; 0 ≤ [Cl−], μM ≤ 171.42; 0 ≤ [C2O42−], μM ≤ 142.85; 0 ≤ [CO32−], μM ≤ 228.57; 0 ≤ [HPO42−], μM ≤ 85.71; 0 ≤ [Br−], μM ≤ 171.42; 0 ≤ [BrO3−], μM ≤ 200; and 0 ≤ [OH−], μM ≤ 200. In all the cases, the fluorescence intensity of the anion sensors increases significantly (Table 6) with the increase in [anions].2,32,33 The FL intensity spectra of F−, CO32−, HPO42−, and OH− sensors are presented in Fig. 15. The FL intensity spectra for other anions are included in the ESI† as S2. Similarly, the calibration curves of the F−, CO32−, HPO42−, and OH− sensors are shown in Fig. 16, and the calibration of the rest of the anions is included in the ESI† as S3.
| Sl. no. | Materials (QDs) | Anions/H2O2 | Sensing capacity data and fluorescence turn on/off | Ref. |
|---|---|---|---|---|
| 1 | Carbon quantum dots (CQDs) | H2O2 | 0–88 mM at 604 nm emission (Em) peak | 71 |
| 0–66 mM at 570 nm emission (Em) peak | ||||
| Fluorescence turn off | ||||
| 2 | Zr QDs | H2O2 | 0–2.5 M at 406 and 430 nm Em peaks | 64 |
| 0–0.15 M at 413 nm Em peak | ||||
| Fluorescence turn off | ||||
| 3 | CQDs@gum | H2O2 | 0–2.2 mM at 520 nm Em peak | 72 |
| Arabic-silver nanoparticles | Fluorescence turn on | |||
| 4 | Chicken cartilage carbon dots | H2O2 | 2–3000 μM at 435 nm Em peak | 73 |
| Fluorescence turn off | ||||
| 0.47 μM LOD | ||||
| 5 | CdTe QDs-Ca2+ | F− | 0–12 mM at 600 nm Em peak | 74 |
| Fluorescence turn on | ||||
| 6 | Thioglycolic acid capped CdTe QDs | H2O2 | 0–200 μM [H2O2] at 550 nm Em peak | 74 |
| Fluorescence turn off | ||||
| SO32− | 0–7.6 mM [SO32−] at 550 nm Em peak | |||
| Fluorescence turn on | ||||
| PO43− | 0–1.6 mM [PO43−] at 550 nm Em peak | |||
| Fluorescence turn on | ||||
| 7 | β-CD-QDs | H2PO4−, OH−, HPO42−, PO43− | 0–0.001 mol L−1 [anions] at 410 nm Em peak | 39 |
| Fluorescence turn off | ||||
| 8 | Thioglycolic acid-capped CdTe QDs | F−, C2O42−, CO32− | Fluorescence turn on | 3 |
| H2O2 | Fluorescence turn off | |||
| 9 | CdTe QDs | CO32− | 0–123.5 μM at 560 nm Em peak | 75 |
| Fluorescence turn on | ||||
| 10 | CdSe-ZnS QD | AcO−, F−, Cl−, Br−, HSO4− | Fluorescence turn off | 41 |
 | ||
| Fig. 15 Emission spectra of the optical La QD sensor at 315 and 440.5 nm wavelength upon excitation at 265 nm with different (a) [F−], (b) [CO32−], (c) [HPO42−], and (d) [OH−]. | ||
 | ||
| Fig. 16 Calibration curves for various sensors at 315 and 440.5 nm wavelengths: (a) F−, (b) CO32−, (c) HPO42−, and (d) OH−. | ||
The intensity of emission increases linearly (eqn (2)) with the increase in [F−] for both peaks at 315 nm and 440.5 nm (Fig. 16) (ESI† in T1). The intensity of emission increases exponentially (eqn (3)) concerning the concentration increase of Cl−, C2O42−, CO32−, HPO42−, Br−, BrO3−, and OH− ions, which is presented in Fig. 17 and ESI† (S3 and T2–T8).
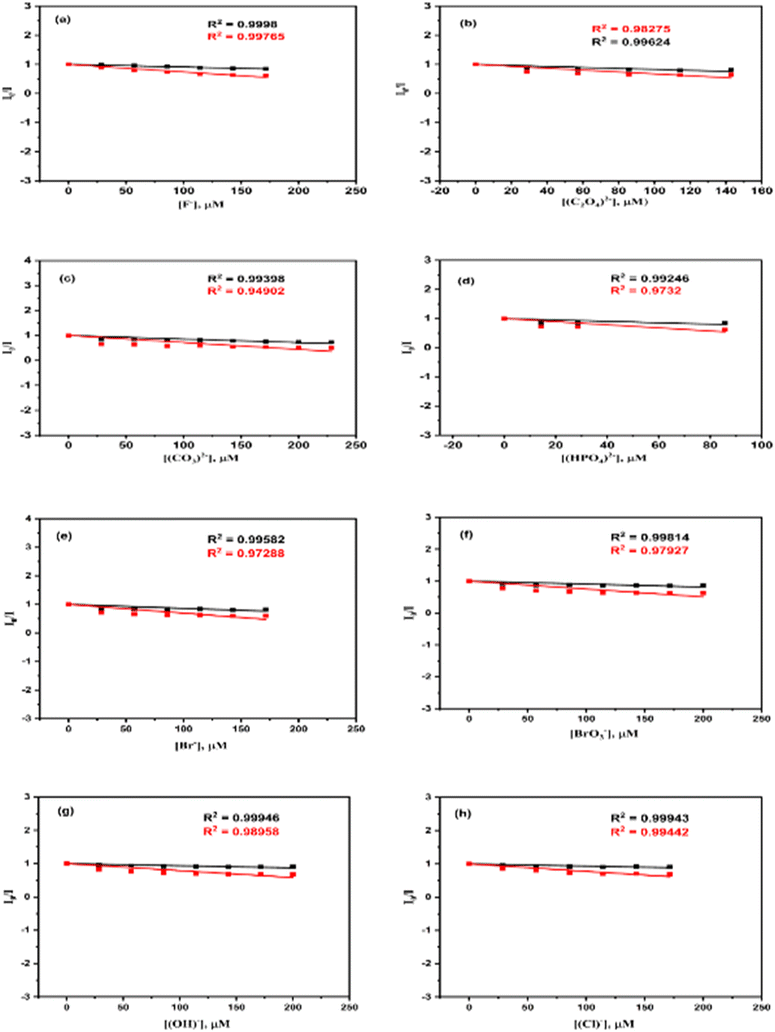 | ||
| Fig. 17 Stern–Volmer plots for various sensors at 315 and 440.5 nm wavelengths: (a) F−, (b) C2O42−, (c) CO32−, (d) HPO42−, (e) Br−, (f) BrO3−, (g) OH−, and (h) Cl−. | ||
The enhancement in the intensities of the emission spectra concerning the concentration increase of F−, Cl−, C2O42−, CO32−, HPO42−, Br−, BrO3−, and OH− ions satisfied the Stern–Volmer equation (eqn (1)), which is shown in Fig. 17 (ESI† in T9–T16). The Langmuir binding plots (eqn (4)) of the F−, Cl−, C2O42−, CO32−, HPO42−, Br−, BrO3−, and OH− ions for the surface functionalization of the La QDs are depicted in Fig. 18.
 | ||
| Fig. 18 Langmuir binding plots for various sensors at 315 and 440.5 nm wavelengths: (a) F−, (b) C2O42−, (c) CO32−, (d) HPO42−, (e) Br−, (f) BrO3−, (g) OH−, and (h) Cl−. | ||
3.1.9.2. H2O2 sensing properties. At room temperature and 40 °C, the fluorescence studies for sensing H2O2 (due to quenching) were conducted (0 ≤ [H2O2], mM ≤ 25.2) upon excitation at 265 nm (Fig. 19) wavelength. The fluorescence intensity of the H2O2 sensors decreases significantly (Table 6) with the increase in [H2O2]. The calibration curves of the H2O2 sensors at both room temperature and 40 °C are shown in Fig. 20(a) and (b) respectively.
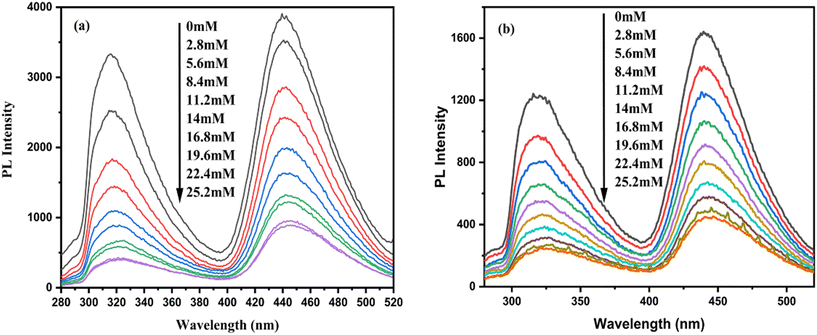 | ||
| Fig. 19 Emission spectra of the optical La QD sensor under different [H2O2] at 315 nm and 440.5 nm wavelengths: (a) at room temperature, and (b) at 40 °C. | ||
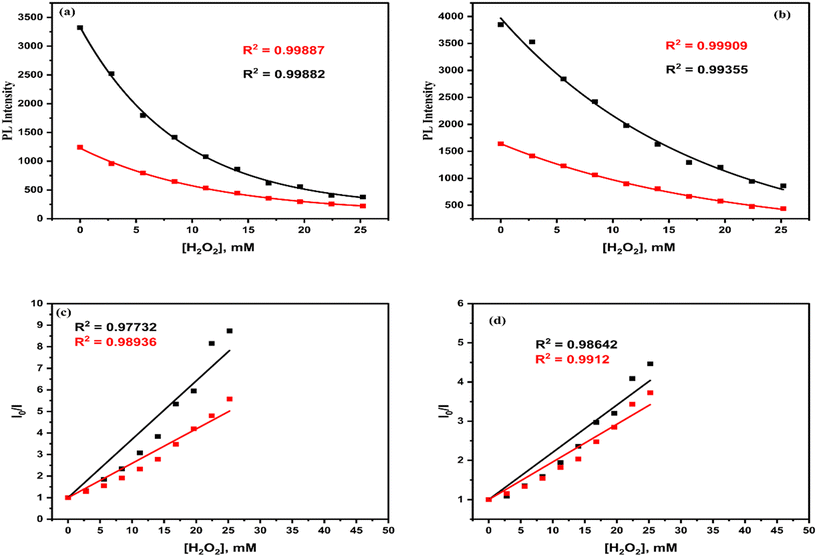 | ||
| Fig. 20 Calibration curves of H2O2 sensor peaks at: (a) 315 nm, and (b) 440.5 nm wavelengths. Stern–Volmer plots of H2O2 sensor peaks at: (c) 315 nm, and (d) 440.5 nm wavelengths. | ||
At the 315 nm and 440.5 nm peaks, the intensity of emission decreases exponentially (eqn (3)) concerning the increase in [H2O2], which is shown in Fig. 20(a) and (b) (ESI† in T17). At the 315 nm and 440.5 nm wavelengths, the quenching in the intensities of the emission spectra concerning the [H2O2] satisfied the Stern–Volmer equation (eqn (1)), which is shown in Fig. 20(c) and (d) (ESI† in T18). The Stern–Volmer plot of the H2O2 sensor shows a downward shift at high temperatures with respect to the room-temperature fit plot of the same at both emission peaks. Hence, the H2O2 sensors of La QDs support the static quenching (Fig. 14(d)) mechanism.
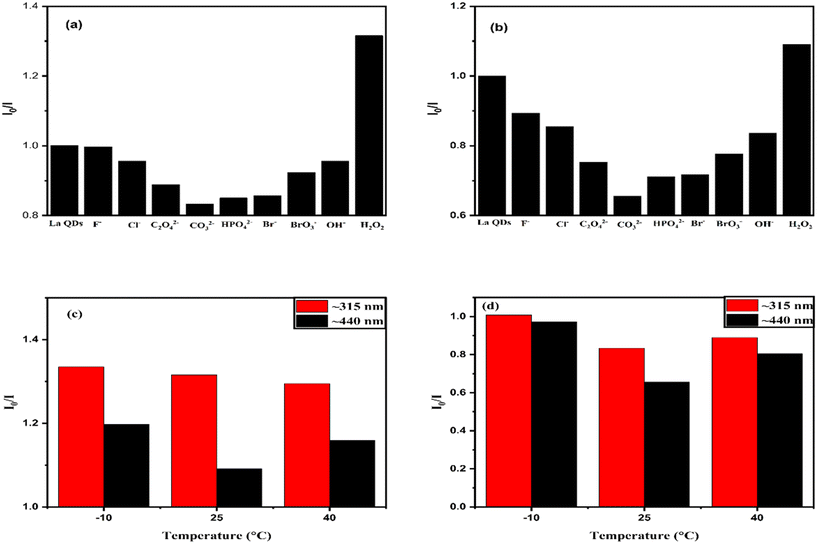
3.1.9.3. Selectivity of La QD sensors for anions. The fluorescence intensity of La QDs was studied in the presence of F−, C2O42−, CO32−, HPO42−, Br−, BrO3−, OH− and Cl− anions. The I0/I values at 315 nm (Fig. 21(a)) and 440.5 nm (Fig. 21(b)) emission peaks for each anion are presented in the form of a bar graph at fixed concentrations of all the anions at 28.57 μM. The minimum I0/I value is found in the case of CO32− ions, i.e., the enhancement of the fluorescence intensities is maximum in the presence of CO32− ions. This indicates that the synthesized La QDs can be used as better selective sensors for CO32− ions. Similarly, the maximum I0/I values at 315 nm (Fig. 21(a)) and 440.5 nm (Fig. 21(b)) emission peaks in the presence of H2O2 are observed at a concentration of 2.8 mM. The quenching of the fluorescence intensities is maximum in the case of H2O2. A bar graph representing the I0/I value for CO32− ion emission peaks at a fixed concentration of 28.57 μM is presented at temperatures of −10 °C, ∼25 °C (room temperature), and 40 °C (Fig. 21d). The I0/I value is found to be lowest at room temperature, indicating that the synthesized La QDs can be employed as more selective CO32− ion sensors at this temperature. Similar temperature variation studies were also conducted for H2O2 (2.8 mM) quenching and the I0/I values were found to be maximum at both −10 °C and at room temperature (Fig. 21c). This indicates that H2O2 quenching is effective at both room temperature and lower temperatures of −10 °C.
Langmuir binding constants for anions for the surface functionalization of the La QDs are given in Table 9. The increasing order of Langmuir binding constants (B) (Table 8, ESI† in T19) of anions with La QDs at 315 nm excitation wavelength is CO32− < F− ≈ Cl− < BrO3− < OH− < C2O42− < Br− < HPO42−. The increasing order of Langmuir binding constants (B) (Table 9) of anions with La QDs at 440.5 nm excitation wavelength is F− ≈ Cl− < CO32− < OH− < BrO3− < Br− < C2O42− < HPO42−. Langmuir binding plot is not fitted for the H2O2 sensing, which supports the agglomeration (no surface functionalization or, no binding) of La QDs in the presence of H2O2.76,77 The surface functionalization of La QDs in the presence of anions in an ethanol medium was examined by employing the FTIR spectra (Fig. 22). The two peaks appeared at ∼1049.29 cm−1 and ∼1087.87 cm−1, which may be for the interaction of La QDs with ethanol.78,79 Due to the surface functionalization of La QDs in the presence of anions, the peak at ∼1049.29 cm−1 is shifted to ∼1046.4 cm−1 for CO32−, HPO42−, and BrO3− anions; ∼1048.32 cm−1 and ∼1050.25 cm−1 for Br− and Cl− ions respectively. Similarly the peak at ∼1087.87 cm−1 is also shifted to ∼1086.90 cm−1 (CO32−), ∼1090.76 cm−1 (HPO42−), ∼1089.79 cm−1 (Br−) and ∼1088.83 cm−1 (BrO3−) in the presence of anions. The peak at ∼1087.87 cm−1 of La QDs is not shifted and one new broad peak appeared at ∼1021.32 cm−1 in the presence of Cl− anions.
The Ksv values were determined, and are presented in Table 7. The LOD (eqn (5)) and LOQ (eqn (6)) values of sensing were calculated,69 and are also presented in Table 7. The stability constants of anions with La(III) ions were obtained from the literature and are presented in Table 8, and it is highest for CO32− anions. The I0/I value was found to be minimum at both the wavelengths (315 and 440.5 nm), indicating that La QDs were found to be better anion sensors for CO32− anions. The increasing order of Stern–Volmer constants (Ksv) (Table 7) of anions with La QDs at 315 nm excitation wavelength is OH− < Cl− < F− < BrO3− < Br− < CO32− < C2O42− < HPO42−, and the same at 440.5 nm excitation wavelength is OH− < Cl− < BrO3− < F− < CO32− < Br− < C2O42− < HPO42−.
| Anions | 103Ksv, μM−1 (λ = 315 nm) | 103Ksv, μM−1 (λ = 440.5 nm) | λ = 315 nm (in μM) | λ = 440.5 nm (in μM) | ||
|---|---|---|---|---|---|---|
| LOD | LOQ | LOD | LOQ | |||
| F− | 0.89 (±0.05) | 2.6 (±0.1) | 29.6 | 89.8 | 34.7 | 105 |
| C2O42− | 1.72 (±0.24) | 3.26 (±0.5) | 89.9 | 272 | 97.9 | 297 |
| CO32− | 1.43 (±0.1) | 2.79 (±0.3) | 105 | 317 | 135 | 410 |
| HPO42− | 2.41 (±0.9) | 5.32 (±1) | 146 | 441 | 87.1 | 264 |
| Br− | 1.38 (±0.22) | 3.06 (±0.4) | 128 | 388 | 116 | 351 |
| BrO3− | 0.92 (±0.1) | 2.47 (±0.3) | 115 | 347 | 115 | 348 |
| OH− | 0.64 (±0.06) | 2.1 (±0.24) | 83.5 | 253 | 96.1 | 291 |
| Cl− | 0.67 (±0.08) | 2.24 (±0.2) | 103.4 | 313 | 69.7 | 211 |
| H2O2 | 270 (±16) × 10−3 | 120 (±6) × 10−3 | 3906 | 11![[thin space (1/6-em)]](https://www.rsc.org/images/entities/char_2009.gif) 836 836 |
3496 | 10![[thin space (1/6-em)]](https://www.rsc.org/images/entities/char_2009.gif) 593 593 |
| Anions | Binding constant (B) (315 nm wavelength) | Binding constant (B) (440.5 nm wavelength) |
|---|---|---|
| F− | 0.20337 (±0.97 × 10⁻²) | 0.08468 (±0.96 × 10⁻²) |
| C2O42− | 0.7226 (±1.15 × 10⁻²) | 0.35475 (±1.15 × 10⁻²) |
| CO32− | 0.17071 (±0.73 × 10⁻²) | 0.09915 (±0.73 × 10⁻²) |
| HPO42− | 9.88063 (±2.18 × 10⁻²) | 0.48755 (±2.18 × 10⁻²) |
| Br− | 0.7709 (±0.97 × 10⁻²) | 0.23985 (±0.97 × 10⁻²) |
| BrO3− | 0.68201 (±0.83 × 10⁻²) | 0.20024 (±0.83 × 10⁻²) |
| OH− | 0.68986 (±0.83 × 10⁻²) | 0.18893 (±0.83 × 10⁻²) |
| Cl− | 0.20337 (±0.97 × 10⁻²) | 0.08468 (±0.97 × 10⁻²) |
4. Conclusion
In summary, a one-pot chemical reduction method has been adopted to synthesize semiconductor La QDs utilizing sodium borohydride as a reducing agent at ∼0 °C. La QDs are a mixture of cubic (La), hexagonal (La4), and hexagonal (La2) crystalline forms, according to the XRD pattern analysis. The small, spherical, homogeneous La QDs are said to have a specific shape with the QDs 2–6 nm in size. The FESEM and HRTEM data indicated that the surface QD size is also 2–6 nm. The EDS data indicated ∼100% purity of the synthesized La QDs. La QDs have two band gap energies of ∼3.26 eV and ∼4.66 eV, which qualifies them as a mixture of semiconductors. The La QDs are anion sensors for the anions F−, Cl−, C2O42−, CO32−, HPO42−, Br−, BrO3−, and OH− and relatively better sensors for CO32−. Due to the static quenching of La QDs in the presence of H2O2, it could act as a H2O2 sensor. It may be used for sensing one of the ROS in the biological system.The sensing properties of La QDs in biological science may be applied due to its high selectivity for carbonate anion and H2O2. Initial studies on La QDs showed its ability to sense carbohydrates and bioconjugate DNA/RNA characteristics. These investigations are ongoing, and the findings will be published at a later date.
Data availability
As per the norms of the journal, the data will be provided on request.Author contributions
The study's conception and design were aided by A. N. A. and A. S. Data interpretation had been conducted by A. N. A. The manuscript was drafted by A. N. A. and A. S.Conflicts of interest
The authors declare no conflicts of interest and claim their work is original, unpublished, and not under consideration for publication elsewhere.Acknowledgements
With assistance from the Department of Chemistry, ICT-IOC, Bhubaneswar, India, the XRD, FESEM, EDS and HRTEM characterizations were completed. With the aid of the Institute Instrumentation Centre (IIC), IITR, Roorkee, India, the XPS characterization is completed. Regarding their assistance in characterizing La QDs, the authors expressed their gratitude.References
- H. I. Alrayzan, S. A. Ansari and N. Parveen, J. Nanoelectron. Optoelectron., 2022, 17, 536–543 CrossRef CAS.
- M. Bottrill and M. Green, Chem. Commun., 2011, 47, 7039–7050 RSC.
- S. Ye, F. Su, J. Li, B. Yu, L. Xu, T. Xiong, K. Shao and X. Yuan, J. Mater. Chem. B, 2024, 12, 122–130 RSC.
- X. Cai, B. Wang, L. Nian, S. Zhao and J. Xiao, J. Mater. Chem. B, 2023, 12, 1031–1042 RSC.
- A. Tiwari, S. Walia, S. Sharma, S. Chauhan, M. Kumar, T. Gadly and J. K. Randhawa, J. Mater. Chem. B, 2022, 11, 1029–1043 RSC.
- S. A. Ansari, Z. Khatoon, N. Parveen, H. Fouad, A. Kulkarni, A. Umar, Z. A. Ansari and S. G. Ansari, Sci. Adv. Mater., 2017, 9, 2032–2038 CrossRef CAS.
- S. A. Ansari, A. Ahmed, F. K. Ferdousi, M. A. Salam, A. A. Shaikh, H. R. Barai, N. S. Lopa and M. M. Rahman, J. Electroanal. Chem., 2019, 850, 113394 CrossRef CAS.
- S. Malik, J. Singh, K. Saini, V. Chaudhary, A. Umar, A. A. Ibrahim, S. Akbar and S. Baskoutas, Anal. Methods, 2024, 16, 2777–2809 RSC.
- A. Umar, S. Akbar, R. Kumar, J. N. O. Amu-Darko, S. Hussain, A. A. Ibrahim, M. A. Alhamami, N. Almehbad, T. Almas and A. F. Seliem, Chemosphere, 2024, 349, 140838 CrossRef CAS PubMed.
- B. Sharma, S. Jain, A. Umar, S. Rani, S. Kumar, A. A. Ibrahim and N. Dilbaghi, Chem. Phys. Impact, 2024, 8, 100470 CrossRef.
- Y. A. Waghmare, V. N. Narwade, A. Umar, A. A. Ibrahim and M. D. Shirsat, Chem. Phys. Impact, 2024, 8, 100419 CrossRef.
- Y. Xia, J. Wang, Y. Zhang, L. Song, J. Ye, G. Yang and K. Tan, Nanoscale, 2012, 4, 5954 RSC.
- M. G. Bawendi, C. R. Kagan and C. B. Murray, Annu. Rev. Mater. Sci., 2006, 30, 545–610 Search PubMed.
- K. R. Singh, V. Nayak, J. Singh, A. K. Singh and R. P. Singh, RSC Adv., 2021, 11, 24722–24746 RSC.
- G. Maheshwaran, M. Malai Selvi, R. Selva Muneeswari, A. Nivedhitha Bharathi, M. Krishna Kumar and S. Sudhahar, Adv. Powder Technol., 2021, 32, 1963–1971 CrossRef CAS.
- M. Salavati-Niasari, G. Hosseinzadeh and F. Davar, J. Alloys Compd., 2011, 509, 4098–4103 CrossRef CAS.
- M. Ranjbar and M. Yousefi, J. Inorg. Organomet. Polym. Mater., 2014, 24, 652–655 CrossRef CAS.
- Y. Wu, Y. Chen and J. Zhou, Mater. Lett., 2013, 95, 5–8 CrossRef CAS.
- M. Nieminen, M. Putkonen and L. Niinistö, Appl. Surf. Sci., 2001, 174, 155–166 CrossRef CAS.
- V. M. Lu, T. R. Jue and K. L. McDonald, Sci. Rep., 2020, 10, 1–12 CrossRef PubMed.
- H. Niu, Q. Min, Z. Tao, J. Song, C. Mao, S. Zhang and Q. Chen, J. Alloys Compd., 2011, 509, 744–747 CrossRef CAS.
- J. Choi and Y. H. Chung, J. Nanomater., 2016, 2016, 1–13 Search PubMed.
- S. A. Ansari and N. Parveen, MatSci Express, 2024, 1, 28–32 Search PubMed.
- G. Mao, H. Zhang, H. Li, J. Jin and S. Niu, J. Electrochem. Soc., 2012, 159, J48–J53 CrossRef CAS.
- G. Chen, B. Han, S. Deng, Y. Wang and Y. Wang, Electrochim. Acta, 2014, 127, 355–361 CrossRef CAS.
- M. Ghiasi and A. Malekzadeh, Superlattices Microstruct., 2015, 77, 295–304 CrossRef CAS.
- U. Rambabu and S. Do Han, Ceram. Int., 2013, 39, 701–708 CrossRef CAS.
- M. Zhang, W. Wang, P. Yuan, C. Chi, J. Zhang and N. Zhou, Chem. Eng. J., 2017, 330, 1137–1147 CrossRef CAS.
- T. Grzyb and S. Lis, J. Rare Earths, 2009, 27, 588–592 CrossRef.
- J. Kim, J. H. Lee, H. An, J. Lee, S. H. Park, Y. S. Seo and W. H. Miller, Mater. Res. Bull., 2014, 57, 110–115 CrossRef CAS.
- J. M. Vargas, J. J. Blostein, I. Sidelnik, D. Rondón Brito, L. A. Rodríguez Palomino and R. E. Mayer, J. Instrum., 2016, 11, 1–16 CAS.
- T. Yamada, S. Shinoda and H. Tsukube, Chem. Commun., 2002, 1218–1219 RSC.
- G. Sivakumar, A. Gupta, A. Babu, P. K. Sasmal and S. Maji, J. Mater. Chem. B, 2024, 12, 4724–4735 RSC.
- Y.-Y. Chen, D. Kurniawan, S. M. Mousavi, P. V. Fedotov, E. D. Obraztsova and W.-H. Chiang, J. Mater. Chem. B, 2022, 10, 9654–9661 RSC.
- K. Dutta, K. Sarkar, S. Karmakar, B. Gangopadhyay, A. Basu, S. Bank, S. De, B. Das, M. Das and D. Chattopadhyay, J. Mater. Chem. B, 2023, 11, 9478–9495 RSC.
- H. Chen, Z. Cai, J. Gui, Y. Tang, P. Yin, X. Zhu, Y. Zhang, H. Li, M. Liu and S. Yao, J. Mater. Chem. B, 2023, 11, 1279–1287 RSC.
- Q. Liang, F. Yu, H. Cai, X. Wu, M. Ma, Z. Li, A. C. Tedesco, J. Zhu, Q. Xu and H. Bi, J. Mater. Chem. B, 2023, 11, 2466–2477 RSC.
- Y. C. Yeh, S. T. Kim, R. Tang, B. Yan and V. M. Rotello, J. Mater. Chem. B, 2014, 2, 4610–4614 RSC.
- E. A. Kataev, Chem. Commun., 2023, 59, 1717–1727 RSC.
- S. H. Hewitt and S. J. Butler, Chem. Commun., 2018, 54, 6635–6647 RSC.
- H. Zhang, J. Wang, S. Wei, C. Wang, X. Yin, X. Song, C. Jiang and G. Sun, J. Mater. Chem. B, 2023, 11, 6082–6094 RSC.
- Y. Zhang, H. Qin, Y. Huang, F. Zhang, H. Liu, H. Liu, Z. J. Wang and R. Li, J. Mater. Chem. B, 2021, 9, 4654–4662 RSC.
- L. Yang, P. Ma, X. Chen, Z. Cheng and J. Lin, J. Mater. Chem. B, 2022, 10, 1386–1392 RSC.
- S. C. G. and R. G. Balakrishna, J. Mater. Chem. B, 2023, 11, 2184–2190 RSC.
- Y. Yuan, X. S. Yan, X. R. Li, J. L. Cao, Z. Li and Y. B. Jiang, Chem. Commun., 2017, 53, 13137–13140 RSC.
- M. Hu and G. Feng, Chem. Commun., 2012, 48, 6951 RSC.
- C. M. G. Dos Santos, P. B. Fernández, S. E. Plush, J. P. Leonard and T. Gunnlaugsson, Chem. Commun., 2007, 3389–3391 RSC.
- Z. Guo, I. Shin and J. Yoon, Chem. Commun., 2012, 48, 5956–5967 RSC.
- R. De, K. W. Jo, B. H. Lee, S. Some and K.-T. Kim, J. Mater. Chem. B, 2023, 11, 6024–6043 RSC.
- M. Devi, B. Raut and S. Sharma, Part. Part. Syst. Charact., 2023, 40, 1–18 CrossRef.
- H. S. Mansur, A. A. P. Mansur, E. Curti and M. V. De Almeida, J. Mater. Chem. B, 2013, 1, 1696 RSC.
- P. Behera, K. Jaiswal and M. De, Luminescence, 2022, 37, 2022–2035 Search PubMed.
- Z. Bin Shang, S. Hu, Y. Wang and W. J. Jin, Luminescence, 2011, 26, 585–591 CrossRef PubMed.
- Y. Lou, Y. Zhao and J. J. Zhu, Nanoscale Horiz., 2016, 1, 125–134 RSC.
- J. F. Callan, R. C. Mulrooney, S. Kamila and B. McCaughan, J. Fluoresc., 2008, 18, 527–532 CrossRef CAS PubMed.
- X. Lou, D. Ou, Q. Li and Z. Li, Chem. Commun., 2012, 48, 8462–8477 RSC.
- G. Leménager, S. Tusseau-Nenez, M. Thiriet, P. E. Coulon, K. Lahlil, E. Larquet and T. Gacoin, Nanomaterials, 2019, 9, 1–14 CrossRef.
- J. B. Brady, R. M. Newton and S. J. Boardman, J. Geol. Educ., 1995, 43, 466–470 Search PubMed.
- J. F. Watts and J. Wolstenholme, An Introduction to Surface Analysis by XPS and AES, Wiley, 2003 Search PubMed.
- L. Schlapbach and H. R. Scherrer, Solid State Commun., 1982, 41, 893–897 CrossRef CAS.
- L. Schlapbach, J. Osterwalder and H. C. Siegmann, J. Less-Common Met., 1982, 88, 291–297 CrossRef CAS.
- W. Witt, H. Geers and L. Aberle, PARTEC 2004, 2004, vol. 1, pp. 1–4 Search PubMed.
- P. W. Brazis, Quantum Dots and Their Potential Impact on Lighting and Display Applications, 2017 Search PubMed.
- A. N. Acharya and A. Sahoo, J. Mater. Sci., 2023, 58, 12976–12992 CrossRef CAS.
- X. L. Wu, J. Y. Fan, T. Qiu, X. Yang, G. G. Siu and P. K. Chu, Phys. Rev. Lett., 2005, 94, 1–4 Search PubMed.
- J. Y. Fan, H. X. Li, Q. J. Wang, D. J. Dai and P. K. Chu, Appl. Phys. Lett., 2011, 98, 081913 CrossRef.
- C. H. Voon, B. Y. Lim and L. N. Ho, in Synthesis of Inorganic Nanomaterials: Advances and Key Technologies, Woodhead Publishing, 2018, pp. 213–253 Search PubMed.
- V. V. Zhirnov and R. K. Cavin, in Microsystems for Bioelectronics, William Andrew Publishing, 2015, pp. 19–49 Search PubMed.
- A. A. Mamaeva, V. I. Martynov, S. M. Deyev and A. A. Pakhomov, Chemosensors, 2022, 10, 1–8 CrossRef.
- V. D. Paramita, N. Panyoyai and S. Kasapis, Int. J. Mol. Sci., 2020, 21, 2550 CrossRef CAS PubMed.
- C.-S. Chu, M.-W. Hsieh and Z.-R. Su, MATEC Web Conf., 2016, 59, 01001 CrossRef.
- S. Majhi, R. Singh, C. S. P. Tripathi and D. Guin, New J. Chem., 2024, 48, 7904–7910 RSC.
- L. Wu, W. Pan, H. Ye, N. Liang and L. Zhao, Colloids Surf., A, 2022, 638, 128330 CrossRef CAS.
- Y. Xia, J. Wang, Y. Zhang, L. Song, J. Ye, G. Yang and K. Tan, Nanoscale, 2012, 4, 5954–5959 RSC.
- H. J. B. Silva, C. F. Pereira, G. Pereira and G. A. L. Pereira, Micromachines, 2024, 15, 373 CrossRef PubMed.
- J.-L. Chen and C.-Q. Zhu, Anal. Chim. Acta, 2005, 546, 147–153 CrossRef CAS.
- Y. Chen and Z. Rosenzweig, Anal. Chem., 2002, 74, 5132–5138 CrossRef CAS PubMed.
- S. Veerasingam and R. Venkatachalapathy, Infrared Phys. Technol., 2014, 66, 136–140 CrossRef CAS.
- R. Serrano-Bayona, C. Chu, P. Liu and W. L. Roberts, Materials, 2023, 16, 1192 CrossRef CAS PubMed.
- F. J. Millero, Geochim. Cosmochim. Acta, 1992, 56, 3123–3132 CrossRef CAS.
- Y. Xiong, Appl. Geochem., 2011, 26, 1130–1137 CrossRef CAS.
- F. I. Sergeevich, L. T. Evgenievna, L. D. Sergeevich and A. A. Alexandrovich, Arab J. Basic Appl. Sci., 2022, 29, 1–9 Search PubMed.
Footnote |
| † Electronic supplementary information (ESI) available: Equations from E1–E4, Fig. S1–S3 and Tables from T1–T18 are submitted as ESI. See DOI: https://doi.org/10.1039/d4sd00142g |
| This journal is © The Royal Society of Chemistry 2024 |


