 Open Access Article
An imidazo[1,2-a]pyridine-functionalized xanthene fluorescent probe for naked-eye detection of Hg2+ and its application in cell imaging and test strips†
Xu-Hong
Han
a,
Piao
Zhao
a,
Meng-Ke
Tang
b,
Lei
Yang
 b,
Qing
Wang
 *b and
Shu-Sheng
Zhang
 *b
*b
aCollege of Chemistry and Chemical Engineering, Linyi University, Linyi 276005, PR China
bShandong Provincial Key Laboratory of Detection Technology for Tumor Markers, School of Medicine, Linyi University, Linyi 276005, PR China. E-mail: qing1016.hi@163.com; shushzhang@126.com
First published on 5th May 2024
Abstract
An imidazo[1,2-a]pyridine-functionalized xanthene dye (Rh-Ip) was designed and developed as a fluorescent probe (Rh-Ip-Hy) for Hg2+ by introducing spirolactam to the molecule. The probe Rh-Ip-Hy with a ring-closed spirolactam structure reacts with Hg2+ to form a fluorescent ring-opened spirolactone structure. Due to its asymmetric structure and the presence of a Lewis base site, the probe exhibits a larger Stokes shift and higher pH tolerance than the traditional xanthene dyes and probes. Furthermore, the probe is highly selective to Hg2+ within a wide pH range of 5.0–11.0. The probe Rh-Ip-Hy also exhibits low cytotoxicity and can be used for the detection of Hg2+ in living HeLa cells through fluorescence imaging. Finally, a paper-based test strip was prepared and successfully applied for the detection of Hg2+ in tap water and lake water samples.
Introduction
Mercury is a highly toxic pollutant that poses a significant threat to the environment. Mercury, even when present in low concentrations in the environment, can accumulate through the food chain,1,2 leading to a variety of diseases, including neurological damage3 and serious cognitive and motion disorders.4 Therefore, it is important to develop simple tools for the sensitive and selective detection of Hg2+ in various water samples.Over the past decades, several methods such as high-performance liquid chromatography, atomic emission spectroscopy, surface-enhanced Raman spectroscopy, and inductively coupled plasma mass spectroscopy have been developed for detecting Hg2+ in environmental samples with high sensitivity, selectivity, and precision.5,6 However, most of these methods are time-consuming or need tedious sample preparation steps, for which reason they are not suitable for on-site analysis and in vivo imaging.7 Fluorescent probe-based detection methods have been widely used for detecting various analytes both in vitro and in vivo because of their advantages such as high selectivity and sensitivity, non-invasiveness and high spatiotemporal resolution.8–14
Due to their advantages including high molar absorption coefficient, high fluorescence quantum yield, and good photostability, xanthene-based fluorophores including rhodamines and fluoresceins have been widely used for designing fluorescent probes by following a target-induced ring-opening strategy enabled by the unique property of spirolactam.15–17 Initially, these probes are in the spirolactam form, which is nonfluorescent and colourless. However, in the presence of analytes, strong fluorescence and significant colour changes are observed because of the analyte-triggered ring-opening of probes. Although various xanthene-based probes have been developed for detecting Hg2+ with high selectivity and sensitivity, there are still some limitations to these probes. For example, classic rhodamine and fluorescein dyes have a small Stokes shift of 20–40 nm,18,19 which is susceptible to being affected by self-absorption and background fluorescence. Furthermore, some reported spirolactam-based probes are vulnerable to H+ (see Table S1; ESI†), causing undesired background signals, which may impede their applications to practical complex samples and in vivo imaging (Scheme 1).20,21 These concerns encouraged us to develop a novel fluorescent probe for detecting Hg2+ in various aquatic environments.
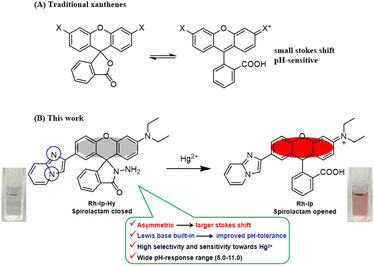 | ||
| Scheme 1 (A) Structures of traditional xanthenes. (B) Structures and color changes of Rh-Ip-Hy (5 μM) before and after exposure to Hg2+ (50 μM). | ||
In the present manuscript, an imidazo[1,2-a]pyridine group is grafted to a xanthene plane to form a probe with an asymmetrical structure and a Lewis base site. The aim is to increase the Stokes shifts and improve the pH tolerance. As expected, the Hg2+ fluorescent probe (Rh-Ip-Hy) exhibits a large Stokes shift (75 nm) in the presence of Hg2+ and high pH tolerance within the pH range of 1–14. Furthermore, the proposed probe Rh-Ip-Hy is highly selective and sensitive to Hg2+ within a wide pH range (5.0–11.0), and can be utilized for the quantitative detection of Hg2+ in living HeLa cells.
Experimental
Materials and instrumentation
All chemicals and reagents were purchased from Innochem Company (Beijing, China) and used without further treatment unless noted. Test solutions of Zn(NO3)2, Cu(NO3)2, AgNO3, Al(NO3)3·9H2O, NaCl, FeCl2, FeCl3, KCl, LiCl, CaCl2·2H2O, BaCl2·2H2O, MgSO4, Ni(ClO4)2, Mn(ClO4)2, Cd(ClO4)2, Co(ClO4)2, and Pb(CH3COO)2 were prepared by dissolving or diluting these compounds in double-distilled water, followed by further dilution if necessary.Instrumentation and spectroscopic studies
Absorption spectra were recorded on an Agilent Cary 60 spectrophotometer. Fluorescence spectroscopy was conducted on a Hitachi F-4600 spectrometer. 1H NMR (400 MHz) and 13C NMR (100 MHz) spectra were recorded on a Bruker AVANCE III 400 MHz spectrometer with chemical shifts reported in ppm (TMS as the internal standard). High-resolution mass spectrometry (HRMS) was performed with an Agilent 6510 Q-TOF LC/MS instrument (Agilent Technologies, Palo Alto, USA) that was equipped with an electrospray ionization (ESI) source. The pH measurements were carried out using a Leici PHS-3C meter. Cells were imaged using a TCS SP8 II confocal laser scanning microscope (Nikon C2plus, Germany).Sample preparation
The stock solution of Rh-Ip-Hy (10 mM) was prepared in N,N-dimethylformamide (DMF). The test solution was set at a concentration of 5 μM by diluting the stock solution with H2O/EtOH (v/v; 4/1). Stock solutions of various metal ions (10.0 mM) were prepared in distilled water and were diluted with H2O/EtOH (v/v; 4/1) to the required concentration for specific experiments. The emission spectra were recorded 30 min after the addition of each analyte.Synthesis of the dye Rh-Ip
A mixture of compound 1 (ref. 22) (1.2 g, 5 mmol) and 2-[4-(diethylamino)-2-hydroxybenzoyl]benzoic acid (1.4 g, 4.47 mmol) was dissolved in CF3COOH/CH3SO3H (20 mL, v/v = 1/1). The resulting solution was heated at 80 °C for 24 h. After cooling, the mixture was poured into H2O (80 mL), neutralized using NaHCO3, and extracted with CH2Cl2 (40 mL × 3). Then, the organic layer was dried over Na2SO4. The solvent was removed under reduced pressure. The final product was purified using column chromatography (PE/EtOAc = 2/1) to afford the target compound as a brown solid (762 mg, yield: 35%). HRMS: m/z [M + H+] = 488.1973, [M + 2H+] = 244.6021; calcd for [C31H25N3O3 + H+]: 488.1974, [C31H25N3O3 + 2H+]: 244.6053. 1H NMR (400 MHz, CDCl3, ppm): δ 1.16 (t, 6H, J = 7.0 Hz, –CH3), 3.34 (q, 4H, J = 7.0 Hz, –CH2), 6.34 (dd, 1H, J = 8.8 Hz, 2.8 Hz, Ar–H), 6.45 (d, 1H, J = 2.8 Hz, Ar–H), 6.56 (d, 1H, J = 8.8 Hz, Ar–H), 6.71 (t, 1H, J = 7.0 Hz, Ar–H), 7.10 (t, 1H, J = 7.0 Hz, Ar–H), 7.19 (d, 1H, J = 7.2 Hz, Ar–H), 7.24 (d, 1H, J = 6.8 Hz, Ar–H), 7.31 (d, 1H, J = 8.4 Hz, Ar–H), 7.53 (d, 1H, J = 9.2 Hz, Ar–H), 7.59 (m, 3H, Ar–H), 8.01 (m, 3H, Ar–H). 13C NMR (100 MHz, CDCl3, ppm): δ 12.64, 44.60, 84.06, 97.81, 105.31, 108.02, 108.62, 112.59, 117.39, 117.66, 119.73, 124.21, 124.86, 125.11, 125.55, 125.65, 127.01, 128.60, 128.85, 129.37, 129.62, 135.06, 144.70, 145.58, 149.76, 151.699, 152.77, 153.59, 169.93.Results and discussion
Synthesis and characterization of Rh-Ip-Hy
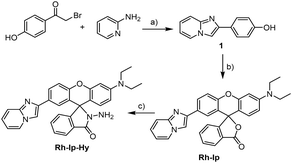
The synthesis procedure for the probe Rh-Ip-Hy is shown in Scheme 2. First, compound 1 was prepared according to the literature22 by the reaction of 2-bromo-1-(4-hydroxyphenyl)ethanone with 2-aminopyridine and was allowed to react with 2-(4-(N,N-diethylamino)-2-hydroxyben-zoyl)benzoic acid according to a conveniently acid-promoted Friedel–Crafts acylation protocol in CF3COOH/CH3SO3H (v/v, 1/1) to produce Rh-Ip. Subsequently, the target probe Rh-Ip-Hy was prepared with a yield of 50% through the reaction of Rh-Ip with hydrazine hydrate in anhydrous ethanol. The structures of Rh-Ip and Rh-Ip-Hy were characterized using high-resolution mass spectrometry (HRMS) and 1H- and 13C-NMR spectroscopy (see the ESI†).Sensing performance of the probe for mercury ions
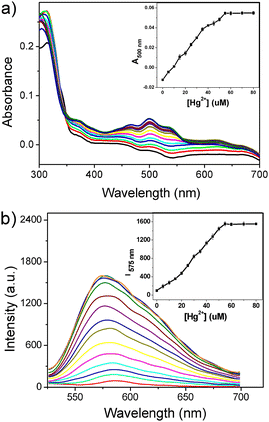
To determine the appropriate solvent environment for the interaction of Rh-Ip-Hy and Hg2+, the fluorescence response of Rh-Ip-Hy towards Hg2+ was determined in mixtures of water and different organic solvents (v/v, H2O/organic solvent = 4/1). As shown in Fig. S1,† after the addition of Hg2+ to the probe solutions, no obvious emission changes were observed in DMF/H2O, DMSO/H2O, and CH3CN/H2O systems. In contrast, there was a significant fluorescence enhancement in the EtOH/H2O system, indicating interactions between Rh-Ip-Hy and Hg2+. Therefore, the EtOH/H2O (v/v, 1/4) solvent system was chosen to investigate the spectral response of the probe to Hg2+.Firstly, the spectra of Rh-Ip-Hy (5 μM) after adding increasing amounts of mercury ions in PBS buffer (10 mM, EtOH/H2O = 1/4, pH 7.4) were investigated. As shown in Fig. 1a, the probe Rh-Ip-Hy exhibited almost no absorption within the range of 400–700 nm, which is attributed to the closed ring structure of the spirolactam. After the addition of Hg2+ (0–80 μM), the absorbance of the probe at 500 nm gradually increased with the increasing concentrations of Hg2+, indicating that Hg2+ induced the ring-opening form of Rh-Ip-Hy (Scheme 1B). For fluorescence titration, as shown in Fig. 1b, the gradual addition of Hg2+ to the probe solution resulted in an increased emission band at 575 nm, which reached the maximum and remained stable when the concentration of Hg2+ ions exceeded 50 μM. The data suggested that the interactions between the probe and the Hg2+ ions led to a colored and fluorescent compound (Scheme 1B). Furthermore, Rh-Ip-Hy exhibited a larger Stokes shift (75 nm) than the classic rhodamine and fluorescein dyes with a typical Stokes shift of less than 30 nm, which could reduce self-absorption and prevent self-quenching from excitation light. A linear relationship was observed between the fluorescence intensities of Rh-Ip-Hy and Hg2+ within the concentration range of 0–50 μM. The detection limit of Hg2+ ions was found to be 57.57 nM (R2 = 0.9981, σ = 0.6094, k = 3.176 × 10⁷, n = 10) based on 3 times the standard deviation rule (Fig. S2†).
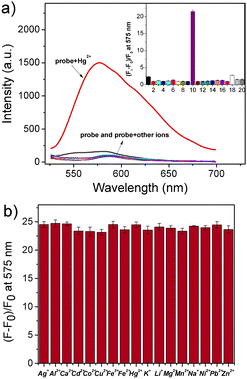
Then, the spectral properties of Rh-Ip-Hy in the absence and presence of various metal ions were investigated. As shown in Fig. 2a, Rh-Ip-Hy (5 μM) showed almost no emission beyond 500 nm, indicating the closed spirolactam ring structure of the probe. After the addition of various metal ions (50 μM) including Ag+, Al3+, Ca2+, Cd2+, Co2+, Cu2+, Fe3+, Fe2+, K+, Li+, Mg2+, Mn2+, Na+, Ni+, Pb2+, and Zn2+ to the solution of the probe, no significant emission changes were observed. In contrast, the addition of Hg2+ triggered a distinct emission intensity increase at 575 nm, with a more than 20-fold enhancement in the intensity. Since some spirolactam-based xanthene probes have been reported to react with ClO− or other reactive oxygen species (ROS),23–25 the effect of ROS on the fluorescence of Rh-Ip-Hy was also investigated. As shown in Fig. 2a, the addition of ROS (including H2O2, NaClO, and ·OH) did not produce any obvious changes in the fluorescence of the probe. The results indicated the high selectivity of Rh-Ip-Hy to Hg2+ among various metal ions. Furthermore, the anti-interference experiment revealed that other metal ions did not have any significant effect on the sensing of mercury ions by the probe (Fig. 2b). These results suggested that Rh-Ip-Hy could be employed as a tool for tracing Hg2+ in biological samples.
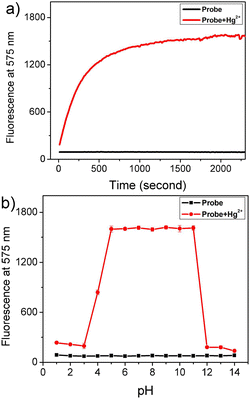
For practical and bioimaging applications, the time-dependent fluorescence responses of Rh-Ip-Hy to Hg2+ were recorded. As shown in Fig. 3a, the addition of Hg2+ to the solution of the probe induced a significant fluorescence enhancement at 575 nm within the first 10 min. The fluorescence gradually stabilized within 30 min, indicating the reaction equilibrium between the probe and the Hg2+ ions. Then, experiments to assess the pH dependency of the fluorescence were conducted in the presence and absence of Hg2+. As shown in Fig. 3b, the probe exhibited weak fluorescence within the pH range of 1–14, which was attributed to the closed spirolactam ring structure of the probe. Compared with many reported spirolactam ring structure probes,26,27 the probe Rh-Ip-Hy exhibited high pH tolerance (Table S1†). After the addition of Hg2+, the probe exhibited an obvious and stable fluorescence enhancement at 575 nm in the pH range of 5–11. These results showed that Rh-Ip-Hy could detect mercury ions within a wide pH range (5.0–11.0), which also covers the physiological pH conditions.
Investigation of the sensing mechanism
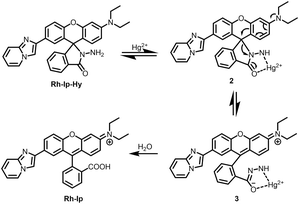
To elucidate the sensing mechanism of Rh-Ip-Hy for Hg2+, HRMS of the probe before and after its reaction with Hg2+ was conducted. As shown in Fig. S3a,† the probe alone exhibited a peak at (m/z) 502.22, which corresponds to the Rh-Ip-Hy [M + H]+ ion (calcd.: 502.22). After reacting with three equivalents of Hg2+ for 20 min, the intensity of the peak at (m/z) 502.22 was considerably lower, and a new peak was observed at (m/z) 488.19, which corresponds to the hydrolyzed product of Rh-Ip (Fig. S3b†). Based on the HRMS results, we therefore suggest that the fluorescence of the probe can be switched on and off because of the selective Hg2+-promoted opening of the spirolactam ring and the subsequent hydrolysis process (Scheme 3). Similar reaction mechanisms have also been reported in previous studies.28–32Application in cell imaging
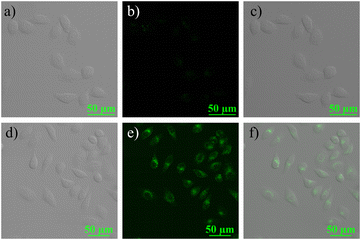
To further explore the potential biological properties of Rh-Ip-Hy, its cytotoxicity to HeLa cells was evaluated using the CCK-8 assay. As shown in Fig. 4, after co-incubation with the probe (40 μM) for 24 hours, the survival rate of the cells was greater than 80%, which indicated that the probe had low cytotoxicity to cells and could be used for bio-imaging. Cell imaging for Hg2+ was conducted using Rh-Ip-Hy as a tracer. As shown in Fig. 5, the HeLa cells incubated with the probe (5 μM) exhibited almost no fluorescence in the green channel (500–550 nm). However, significant and increased fluorescence was observed when the above-mentioned cells were treated with 2 equivalents of Hg2+. These results demonstrated that Rh-Ip-Hy can permeate the cell and be used as a tracer for the detection of mercury ions in living cells.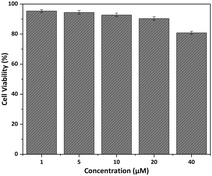 | ||
| Fig. 4 Cell viability of HeLa cells after incubation with different concentrations of Rh-Ip-Hy for 12 hours. | ||
Detection of Hg2+ with paper strips in real water samples
To facilitate the convenient on-site use of the fluorescence method, test strips were prepared by immersing filter paper strips into an ethanolic solution of Rh-Ip-Hy (100 μM) for 1 h. The strips were then dried with a blow-dryer. Hg2+ solutions of different concentrations (0, 100, 150, 200, and 250 μM) were dropwise pipetted onto the dried paper strips. After natural drying, the color changes in the paper strips were observed under natural light. As shown in Fig. 6, the addition of Hg2+ induced noticeable color changes in the paper strips from sage green to red under natural light. Furthermore, the colors of the strips deepened with the increase in the concentration of Hg2+. When the test strips were used for sensing Hg2+-containing tap water or lake water, similar color changes were observed (Fig. 6). These results indicated that test strips with Rh-Ip-Hy as a probe can be easily prepared for the simple and convenient detection of Hg2+ in real water samples.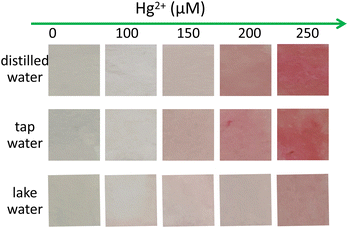 | ||
| Fig. 6 Visualization of Hg2+ using the test strips prepared with Rh-Ip-Hy in distilled water, tap water and lake water, respectively. | ||
Conclusions
In summary, an imidazo[1,2-a]pyridine-functionalized xanthene fluorescent probe (Rh-Ip-Hy) was designed and prepared for detecting Hg2+ in various environments. Due to its asymmetric structure, the probe shows a larger Stokes shift (75 nm) than the classic rhodamine and fluorescein dyes. Because of the presence of a Lewis base site, the probe maintains a nonfluorescent ring-closed spirolactam structure within the pH range of 1–14, and shows selective fluorescence off–on signals to Hg2+ within a wide pH-response range (5–11). Rh-Ip-Hy can permeate the cell membrane and can be used for the imaging of Hg2+ in HeLa cells. Finally, Rh-Ip-Hy-loaded strips can be easily prepared and exhibit good performance for the detection of Hg2+ in various water samples.Conflicts of interest
There are no conflicts to declare.Acknowledgements
We gratefully acknowledge the National Natural Science Foundation of China (Grant No. 22274068, 22076073), the Major Basic Research Project of Natural Science Foundation of Shandong Province (No. ZR2023ZD27) and the Natural Science Foundation of Shandong Province (No. ZR2022QB123).Notes and references
- N. Sridhara Chary, C. T. Kamala and D. S. Suman Raj, Ecotoxicol. Environ. Saf., 2008, 69, 513–524 CrossRef PubMed
.
- A. Renzoni, F. Zino and E. Franchi, Environ. Res., 1998, 77, 68–72 CrossRef CAS PubMed
.
- M. Harada, Crit. Rev. Toxicol., 1995, 25, 1–25 CrossRef CAS PubMed
.
- N. Basu, A. Scheuhammer, N. Grochowina, K. Klenavic, F. Evans, M. Obrien and M. Chan, Environ. Sci. Technol., 2005, 39, 3585–3591 CrossRef CAS PubMed
.
- J. R. Miranda-Andrades, S. Khan, M. J. Pedrozo-Penãfiel, K. de C. B. Alexandre, R. M. Maciel, R. Escalfoni, M. L. B. Tristão and R. Q. Aucelio, Spectrochim. Acta, Part B, 2019, 158, 105641 CrossRef CAS
.
- R. A. Bernhoft, J. Environ. Public Health, 2012, 2012, 460508 Search PubMed
.
- X. Chen, T. Pradhan, F. Wang, J. S. Kim and J. Yoon, Chem. Rev., 2012, 112, 1910–1956 CrossRef CAS PubMed
.
- J. F. Zhang, Y. Zhou, J. Yoon and J. S. Kim, Chem. Soc. Rev., 2011, 40, 3416–3429 RSC
.
- K. Ponnuvel, V. Padmini and R. Sribalan, Sens. Actuators, B, 2016, 222, 605–611 CrossRef CAS
.
- K. Ponnuvel, M. Kumar and V. Padmini, Sens. Actuators, B, 2016, 227, 242–247 CrossRef CAS
.
- Y. Tian, Z. Zhou, J. Gong, J. Li, C. He and J. Chen, Sens. Actuators, B, 2023, 394, 134421 CrossRef CAS
.
- R. Zou, Y. Yu, H. Pan, P. Zhang, F. Cheng and C. Zhang, ACS Appl. Mater. Interfaces, 2022, 14, 16746–16754 CrossRef CAS PubMed
.
- H. Liu, P. Zhang, C. Zhang, J. Chen and J. H. Jiang, ACS Appl. Mater. Interfaces, 2020, 12, 45822–45829 CrossRef CAS PubMed
.
- P. Zhang, X. Nie, M. Gao, F. Zeng, A. Qin, S. Wu and B. Z. Tang, Mater. Chem. Front., 2017, 1, 838–845 RSC
.
- H. N. Kim, M. H. Lee, H. J. Kim, J. S. Kim and J. Yoon, Chem. Soc. Rev., 2008, 37, 1465–1472 RSC
.
- H. Zheng, X. Q. Zhan, Q. N. Bian and X. J. Zhang, Chem. Commun., 2013, 49, 429–447 RSC
.
- P. Zhang, Y. Tian, H. Liu, J. Ren, H. Wang and R. Zeng, Chem. Commun., 2018, 54, 7231–7234 RSC
.
- Z. Tian, B. Tian and J. Zhang, Dyes Pigm., 2013, 99, 1132–1136 CrossRef CAS
.
- Z. Zhang, G. Zhang, J. Wang, S. Sun and Z. Zhang, Comput. Theor. Chem., 2016, 1095, 44–53 CrossRef CAS
.
- S. Samanta, K. Lai, F. Wu, Y. Liu, S. Cai, X. Yang, J. Qu and Z. Yang, Chem. Soc. Rev., 2023, 52, 7197–7261 RSC
.
- B. Wang, S. Yu, X. Chai, T. Li, Q. Wu and T. Wang, Chem. – Eur. J., 2016, 22, 5649–5656 CrossRef CAS PubMed
.
- M. Leopoldo, E. Lacivita, E. Passafiume, M. Contino, N. A. Colabufo, F. Berardi and R. Perrone, J. Med. Chem., 2007, 50, 5043–5047 CrossRef CAS PubMed
.
- M. Ren, B. Deng, K. Zhou, X. Kong, J. Y. Wang, G. Xu and W. Lin, J. Mater. Chem. B, 2016, 4, 4739–4745 RSC
.
- R. Bhowmick, A. S. M. Islam, U. Saha, G. S. Kumar and M. Ali, New J. Chem., 2018, 42, 3435–3443 RSC
.
- X. Chen, X. Wang, S. Wang, W. Shi, K. Wang and H. Ma, Chem. – Eur. J., 2008, 14, 4719–4724 CrossRef CAS PubMed
.
- C. Yu, J. Zhang, J. Li, P. Liu, P. Wei and L. Chen, Microchim. Acta, 2011, 174, 247–255 CrossRef CAS
.
- S. Das, K. Rissanen and P. Sahoo, ACS Omega, 2019, 4, 5270–5274 CrossRef CAS PubMed
.
- D. Li, C. Y. Li, Y. F. Li, Z. Li and F. Xu, Anal. Chim. Acta, 2016, 934, 218–225 CrossRef CAS PubMed
.
- Q. Zhang, H. Ding, X. Xu, H. Wang, G. Liu and S. Pu, Spectrochim. Acta, Part A, 2022, 276, 121242 CrossRef CAS PubMed
.
- K. Huang, Y. Liu, P. Zhao, L. Liang, Q. Wang and D. Qin, Spectrochim. Acta, Part A, 2022, 282, 121688 CrossRef CAS PubMed
.
- X. Jiao, C. Liu, K. Huang, S. Zhang, S. He, L. Zhao and X. Zeng, Org. Biomol. Chem., 2015, 13, 6647–6653 RSC
.
- Y. Zhao, Y. Ren, H. Li, T. Han, H. Chen and W. Guo, Dyes Pigm., 2016, 132, 255–261 CrossRef CAS
.
Footnote |
| † Electronic supplementary information (ESI) available: Copies of 1H/13C NMR and HRMS spectra for Rh-Ip and Rh-Ip-Hy, the limit of detection, HRMS spectra of sensing mechanism are included. See DOI: https://doi.org/10.1039/d4sd00090k |
| This journal is © The Royal Society of Chemistry 2024 |

