 Open Access Article
Red and NIR active dipod–SDS self-assemblies for “turn on” quantification of spermine in serum, urine and food: smart-phone assisted on-site determination of spermine in amine-rich foods†
Nancy
Singla
 *a,
Sukhvinder
Dhiman
 a,
Manzoor
Ahmad
 a,
Satwinderjeet
Kaur
b,
Prabhpreet
Singh
 a and
Subodh
Kumar
 *a
*a
aDepartment of Chemistry, Centre for Advanced Studies, Guru Nanak Dev University, Amritsar, Punjab, India. E-mail: nancy38452@gmail.com
bDepartment of Botanical and Environment Sciences, Guru Nanak Dev University, Amritsar, India
First published on 15th May 2024
Abstract
Spermine is a vital biomarker for clinical diagnosis of cancer and estimating food spoilage. Here, supramolecular assemblies of two donor–π–acceptor dipods R-SPM (λem 640 nm) and NIR-SPM (λem 720 nm) with SDS have been discovered for the detection of spermine and spermidine under physiological conditions at nanomolar levels. The addition of SDS to R-SPM and NIR-SPM results in the formation of self-assemblies (DLS, zeta-potential and UV-vis studies) with no significant change in their fluorescence but further addition of spermine/spermidine to the R-SPM∩SDS and NIR-SPM∩SDS assemblies results in a 30–80 fold increase in fluorescence intensity, respectively at 640 nm and 720 nm. The LOD for spermine and spermidine detection is 22 nM (4.4 ppb) and 67 nM (9.7 ppb). The ensembles show nominal interference from other biogenic amines, amino acids, metal ions, and anions. Both R-SPM∩SDS and NIR-SPM∩SDS ensembles can be stored in the dark for >3 months without affecting their performance. The potential of these ensembles for real world applications like analysis of spermine in urine, human serum and food spoilage in the case of cheese, mushrooms, chicken and mutton has been demonstrated. The smartphone relied RGB analysis facilitates the on-site determination of spermine in food samples.
1. Introduction
Spermine (SPM) and spermidine (SPD) are vital biomarkers in clinical diagnosis of cancer and estimating food spoilage in the food industry. SPM and SPD exert multiple functions in many physiological and pathophysiological processes, including cell proliferation, differentiation, growth, tissue regeneration and gene regulation. The concentration of spermine ranges from 1 to 40 μM in blood,1 59 to 233 μM in serum,2 and 100 to 400 nM in urine3 depending upon age and gender.4 The alteration in their concentrations in urine or blood can be taken as indicators of malfunctioning in living systems. Spermidine concentrations are markedly decreased with age5 and in persons having Alzheimer's disease.6 Long-term oral intake of polyamine-rich diet causes an increase in blood polyamine levels and delays the onset of Alzheimer's disease. In cancer patients, the levels of spermine in blood samples increase by 3 to 5-fold compared with those found in healthy people.7–9 Therefore, a high level of polyamines is regarded as a biomarker for the timely diagnosis of cancer in certain tumors.7–9Spermine is present in most meat products like sausages, pork, chicken, and turkey, some vegetables like pumpkin, and also in cheese. Spermidine is present in a large number of foods like dry soy bean, chicken liver, green peas, corn, shell fish, and blue cheese.10 Although these do not have any adverse effect, during cooking, SPM/SPD may react with nitrite to form carcinogenic nitrosamines in meat products that contain nitrite and nitrate salts as curing agents.11,12 A fresh food consists of very low levels of amines, whereas, after fermentation, their concentrations are elevated.13 Thus it becomes imperative to develop methods that can detect spermine and spermidine in biofluids and food samples with high selectivity and sensitivity especially in a very small volume of sample.
Cucurbit[n]urils (CB[n], n = 5–8, 10, 14) are effective in encapsulating and solubilizing hydrophobic organic molecules by weak non-covalent interactions. Fluorescent dyes complexed with a nanoparticle, quantum dot or cyclodextrin exhibit reversal in its fluorescence response on addition of cucurbituril (CB) via host–guest complexation. The addition of spermine to this assembly then again changes the fluorescence response. Thus either the off–on–off14–16 or on–off–on17 phenomenon has been used for SPM and SPD detection. In a two component process, a fluorescent dye forms a host–guest complex with metals such as Tb3+,18 Cu2+,19–21 Ag+,22,23 Au3+,24,25 Fe3+ (ref. 26), etc. via non covalent interactions. This complex is then dissociated with spermine and spermidine due to their higher affinity towards metals. DNA capped metal nanoparticles27–29 have also been used for spermine and spermidine detection. Triphenylethylene based fluorescent dyes with terminal sulphate or carboxylate groups30–33 form electrostatic complexes with SPM and SPD and result in fluorescence enhancement due to restriction in rotation.
However, most of the reported methods are based on fluorescence quenching with SPM /SPD or emission enhancement in the blue or green region (Table 1). The supramolecular assemblies of CB or SDS with fluorescent probes have shown promise to achieve better selectivity by the displacement approach or by binding of SPD/SPM with the negatively charged amphiphiles. There is only one report where the self-assembly of a dye with CB on interaction with SPD/SPM gives fluorescence enhancement in the NIR region (730 nm) (entry 4, Table 1) but it has not found practical applications.
| Sr. no. | Emission maxima | Solvent system | FL ON/OFF | LOD | Application in urine | Application in serum | Application in food | Smartphone determination | Ref. |
|---|---|---|---|---|---|---|---|---|---|
| 1. | 640 nm, 720 nm | 99.9% HEPES buffer | “On” | 22–34 nM | YES | YES | YES | YES | This work |
| 2. | 425 nm | HEPES buffer–DMSO (95![[thin space (1/6-em)]](https://www.rsc.org/images/entities/char_2009.gif) : :![[thin space (1/6-em)]](https://www.rsc.org/images/entities/char_2009.gif) 5) 5) |
“Off” | 6 nM | YES | YES | NO | NO | 3c |
| 500 nM | |||||||||
| 3. | 535 nm | Water | “Off” | 0.5 nM-SP | YES | YES | NO | NO | 14 |
| 6 nM-SPD | |||||||||
| 4. | 735 nm | Water | “On” | 99 nM-SP | NO | NO | NO | NO | 14 |
| 179 nM-SPD | |||||||||
| 5. | 615 nm | Water | “Off” | 70 nM-SP | YES | YES | YES | NO | 15 |
| 330 nM-SPD | |||||||||
| 6. | 475 nm | Water | “Off” | 14 nM-SP | YES | YES | NO | NO | 16 |
| 36 nM-SPD | |||||||||
| 7. | 556 nm | HEPES buffer–CH3CN (1![[thin space (1/6-em)]](https://www.rsc.org/images/entities/char_2009.gif) : :![[thin space (1/6-em)]](https://www.rsc.org/images/entities/char_2009.gif) 1) 1) |
“Off” | 0.09 nM | YES | YES | YES | NO | 20 |
| 8. | 493 nm | HEPES buffer–CH3CN (3![[thin space (1/6-em)]](https://www.rsc.org/images/entities/char_2009.gif) : :![[thin space (1/6-em)]](https://www.rsc.org/images/entities/char_2009.gif) 7) 7) |
“Off” | 600 nM | YES | NO | YES | NO | 21 |
| 9. | 562 nm | HEPES buffer–CH3CN (1![[thin space (1/6-em)]](https://www.rsc.org/images/entities/char_2009.gif) : :![[thin space (1/6-em)]](https://www.rsc.org/images/entities/char_2009.gif) 1) 1) |
“On” | 27.5 nM | YES | YES | NO | NO | 37 |
| 10. | 415 nm | Aqueous solution | “Off” | 330 nM | YES | NO | NO | NO | 38 |
| 11. | 570 nm, 450 nm | Aqueous solution | “Off” | 200 nM-SP | NO | NO | YES | NO | 39 |
| 2100 nM-SPD | |||||||||
| 12. | 380–550 nm | Water | “On” | 6000 nM | YES | YES | NO | NO | 40 |
In present investigations, supramolecular assemblies of two donor–π–acceptor dipods R-SPM (λem 640 nm) and NIR-SPM (λem 720 nm) with SDS have been explored for the detection of SPM and SPD. R-SPM∩SDS and NIR-SPM∩SDS ensembles result in 30–80 fold increase in fluorescence intensity respectively at 640 nm and 720 nm on addition of 10 equivalents of SPM and SPD. The LOD for SPM and SPD detection is 22 nM (4.4 ppb) and 67 nM (9.7 ppb). These assemblies show nominal interference from other biogenic amines, amino acids, metal ions and inorganic anions. These assemblies can be stored in the dark for >3 months without affecting their performance. The potential of these ensembles for real world applications like analysis of spermine from urine, human serum and food spoilage in the case of cheese, mushroom, chicken and mutton has been demonstrated. The smartphone trusted RGB analysis speeds up the detection for real-time analysis of spermine.
2. Experimental
2.1 Synthesis of R-SPM
In 25 ml RBF, 1,2-bis(bromomethyl)benzene 1 (132 mg, 0.5 mmol) and (E)-N,N-dimethyl-4-(2-(pyridin-4-yl)vinyl)aniline (224 mg, 1 mmol) were dissolved in acetonitrile (15 ml) and the reaction mixture was refluxed with continuous stirring at 90 °C for 16 h. After completion of the reaction, the precipitates were filtered, washed with a diethyl ether and chloroform (1![[thin space (1/6-em)]](https://www.rsc.org/images/entities/char_2009.gif) :
:![[thin space (1/6-em)]](https://www.rsc.org/images/entities/char_2009.gif) 1) mixture and dried to get red precipitates, 326 mg, yield 92%, melting point 254 °C; 1H NMR (DMSO-d6, 400 MHz, ppm): δ 2.98 (s, 12H, 4× NCH3), 5.87 (s, 4H, 2× NCH2), 6.69 (d, J = 8.8 Hz, 4H, ArH), 7.12 (d, J = 16 Hz, 2H, 2× olefin H), 7.25–7.28 (m, 2H, ArH), 7.49–7.51 (m, 2H, ArH), 7.52 (d, J = 8.8 Hz, 2H, ArH), 7.88 (d, J = 16 Hz, 2H, 2× alkene H), 8.00 (d, J = 6.8 Hz, 4H, ArH), 8.64 (d, J = 6.8 Hz, 4H, ArH); 13C NMR (DMSO-d6, 100 MHz, ppm): δ 24.4, 58.4, 111.4, 116.4, 121.9, 122.1, 129.6, 130.0, 132.6, 142.6, 143.1, 149.9, 152.6, 153.9; HRMS: mol. formulae C38H40Br2N4, exact mass expected 710.162; C38H40BrN4+ 631.2431, 633.2410; C38H40N42+ 552.3242/2 = 276.1621, obtained for C38H40BrN4+ at m/z 631.2275, 633.2271; C38H40N42+ at 276.1533 (M).
1) mixture and dried to get red precipitates, 326 mg, yield 92%, melting point 254 °C; 1H NMR (DMSO-d6, 400 MHz, ppm): δ 2.98 (s, 12H, 4× NCH3), 5.87 (s, 4H, 2× NCH2), 6.69 (d, J = 8.8 Hz, 4H, ArH), 7.12 (d, J = 16 Hz, 2H, 2× olefin H), 7.25–7.28 (m, 2H, ArH), 7.49–7.51 (m, 2H, ArH), 7.52 (d, J = 8.8 Hz, 2H, ArH), 7.88 (d, J = 16 Hz, 2H, 2× alkene H), 8.00 (d, J = 6.8 Hz, 4H, ArH), 8.64 (d, J = 6.8 Hz, 4H, ArH); 13C NMR (DMSO-d6, 100 MHz, ppm): δ 24.4, 58.4, 111.4, 116.4, 121.9, 122.1, 129.6, 130.0, 132.6, 142.6, 143.1, 149.9, 152.6, 153.9; HRMS: mol. formulae C38H40Br2N4, exact mass expected 710.162; C38H40BrN4+ 631.2431, 633.2410; C38H40N42+ 552.3242/2 = 276.1621, obtained for C38H40BrN4+ at m/z 631.2275, 633.2271; C38H40N42+ at 276.1533 (M).
2.2 Synthesis of NIR-SPM
1,2-Bis(bromomethyl)benzene (132 mg, 0.5 mmol) and diene 8 (250 mg, 1 mmol) were dissolved in acetonitrile (5 ml) and the reaction mixture was refluxed with continuous stirring at 90 °C for 16 h. The solid separated was filtered, washed with diethyl ether and dried. Red coloured precipitates of NIR-SPM were obtained, 513 mg, 85% yield, melting point 231 °C. 1H NMR (500 MHz, DMSO-d6): δ 2.99 (s, 12H, 4× CH3), 5.95 (s, 4H, 2× NCH2), 6.66 (d, J = 8.8 Hz, 4H, ArH), 6.69 (d, J = 16 Hz, 2H, alkene H), 7.01–7.07 (m, 4H, ArH), 7.21–7.33 (m, 2H, ArH), 7.38 (d, J = 8.8 Hz, 4H, ArH), 7.49–7.52 (m, 2H, ArH), 7.78 (dd, J1 = 16 Hz, J2 = 10 Hz, 2H, alkene H, ArH), 7.98 (d, J = 7.2 Hz, 4H, ArH), 8.70 (d, J = 7.2 Hz, 4H, ArH); 13C NMR (125 MHz, DMSO-d6): δ 59.3, 112.5, 123.4, 123.6, 123.9, 129.7, 130.6, 130.7, 133.3, 143.4, 144.1, 144.9, 151.6, 154.3; HRMS: mol. formulae C42H44Br2N4 exact mass expected for C42H44BrN4+ = 683.2744, 685.2723 (1![[thin space (1/6-em)]](https://www.rsc.org/images/entities/char_2009.gif) :
:![[thin space (1/6-em)]](https://www.rsc.org/images/entities/char_2009.gif) 1), C42H44N42+ = 604.2968/2 = 302.1778, obtained 683.2073, 685.2060 (1
1), C42H44N42+ = 604.2968/2 = 302.1778, obtained 683.2073, 685.2060 (1![[thin space (1/6-em)]](https://www.rsc.org/images/entities/char_2009.gif) :
:![[thin space (1/6-em)]](https://www.rsc.org/images/entities/char_2009.gif) 1); 302.1484.
1); 302.1484.
2.3 Preparation of solutions
The stock solutions of fluorescent probes R-SPM and NIR-SPM (1 mM) were prepared in DMSO and were further diluted for preparing solutions of desired concentrations. For the preparation of 10 μM solution, 100 μL of stock solution was taken into a 10 ml volumetric flask and filled up to the mark with desired solvent like a DMSO–HEPES mixture or HEPES buffer. Typically, freshly prepared stock solutions of spermine and spermidine were prepared in deionized water. All the proteins, enzymes, amino acids and anions were prepared by dissolving commercial reagents in Millipore double distilled water.2.4 Quantitative detection of spermine in urine using R-SPM∩SDS and NIR-SPM∩SDS ensembles
The quantitative detection of spermine using the fluorescence approach was carried out by collecting the fresh, morning urine of a healthy female donor. The urine collected was filtered with a 0.02 μm syringe microfilter to remove any suspended particle. To remove the protein present, 3 ml of urine sample was mixed with 70 μl of 70% perchloric acid. This mixture was then centrifuged at 7000 rpm for 35 min and then placed at room temperature for 15 min. The supernatant fluid obtained was again filtered through a 0.02 μm filter and adjusted to neutral pH with sodium hydroxide. The urine (1000 μl) was added to 2000 μl of R-SPM∩SDS (15 μM∩750 μM) or NIR-SPM∩SDS (15 μM∩750 μM) ensemble. The final concentration of the probe and SDS was 10 and 500 μM. Finally, the concentration of spermine in the urine sample was detected by recording the fluorescence spectra of these solutions. The amount of spermine present was evaluated from the calibration curve obtained by titrating R-SPM∩SDS (10 μM∩500 μM) and NIR-SPM∩SDS (10 μM∩500 μM) ensembles with spermine under standard conditions.2.5 Quantitative detection of spermine in human serum using R SPM∩SDS and NIR-SPM∩SDS ensembles
The human blood serum of a healthy female donor was collected from the pharmacy department of our university and stored at −20 °C. The serum samples were centrifuged at 7000 rpm for 15 min, maintaining the temperature between 15 and 20 degrees Celsius. The supernatant liquid was collected and for 1 mL of the supernatant, 3 mL of acetone was added to precipitate the proteins and it was again centrifuged at 7000 rpm for 35 min maintaining the low temperature. After that, the supernatant was collected and was used for the quantification of spermine in serum. The processed human serum sample (200 μl) was added to 3 ml of R-SPM∩SDS (10 μM∩500 μM) or NIR-SPM∩SDS (10 μM∩500 μM) ensemble and fluorescence spectra were recorded.2.6 Quantitative detection of spermine in food samples using R SPM∩SDS and NIR-SPM∩SDS ensembles
Fresh samples of two vegetarian food: mushroom and cheese as well as two non-vegetarian food: chicken and mutton were obtained from a local market and were stored at 20 degrees Celsius. These were (5 g each) were placed in separate 50 ml glass beakers having 20 ml of water. The experiments were performed in triplicate. The R-SPM∩SDS (12 μM∩600 μM) or NIR-SPM∩SDS (12 μM∩600 μM) ensemble (2.5 ml) was treated with 500 μl of water for each food sample solution and the fluorescence spectra of resulting 3 ml solutions were recorded to determine the quantity of spermine released. For the next 3 days, 500 μl of water from each food sample was taken and their fluorescence spectra were recorded to determine the quantity of spermine released.3. Results and discussion
3.1 Synthesis and characterization of R-SPM and NIR-SPM
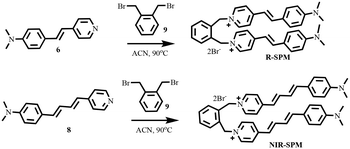
The stirring of 4-methylpyridine (1) with benzoyl chloride (2) in DMF within 30 minutes in situ generated the 4-methylpyridinium moiety (3) which remains in equilibrium with the enamine (4). The enamine (4) on condensation with 4-dimethylaminobenzaldehyde (5) gave mono-ene derivative 6 in 54% yield. Similarly, enamine (4) on condensation with 4-dimethylaminocinnamaldehyde (7) gave diene 8 in 30% yield (Scheme S1†).The reaction of 1,2-bis(bromomethyl)benzene (9) with two equivalents of mono-ene 6 in acetonitrile at reflux temperature gave R-SPM, in 92% yield (Scheme 1). The presence of two 2H doublets with J = 16 Hz at δ 7.12 and δ 7.88 in the 1H NMR spectrum of R-SPM, and its exact mass for C38H40N42+ at 276.1693 (M/2) confirm the formation of R-SPM. Similarly, the reaction of 1,2-bis(bromomethyl)benzene (9) with two equivalents of diene 8 in acetonitrile at reflux temperature gave NIR-SPM, in yield 85% (Scheme 1). The presence of a NCH2 singlet of four protons at δ 5.95 ppm in its 1H NMR spectrum and its exact mass for C42H44N42+ at 302.1484 (M/2) confirm the formation of NIR-SPM (Fig. S1–S6†).
3.2 Effect of water on UV-vis and florescence spectra of R-SPM and NIR-SPM in DMSO–water binary mixtures
The UV-vis and fluorescence spectra of R-SPM and NIR-SPM in DMSO–water (HEPES buffer pH 7.4) binary mixtures provide vital information about their molecularly dissolved or aggregate state under different aqueous conditions and thus provide vital information for further design of experiments.The UV-vis spectrum of R-SPM in DMSO gives an absorption band at 490 nm which on gradual increase in amount of HEPES buffer is blue shifted and in 99.9% buffer appears at 474 nm (Fig. S7A and B†). The molar absorptivity of the solutions remains quite stable at 64500 ± 2500 L mol−1 cm−1. The probe R-SPM in DMSO, on excitation at 490 nm, gives an emission spectrum with maximum at 640 nm. The fluorescence colour of the solution appears red. On gradually increasing the fraction of water (HEPES buffer, pH 7.4) in DMSO–water binary mixtures, the fluorescence intensity at 640 nm sequentially decreases sharply up to 50% of water fraction and on further increasing the fraction of water from 60% to 99.9%, the fluorescence is slowly decreased (Fig. S7C,† 1D). The quantum yield in DMSO is found to be 1.78%, which is reduced to 0.81% in 99.9% buffer. The dynamic light scattering experiments reveal that the probe R-SPM in DMSO–water (buffer) binary mixtures remains as mono-dispersed aggregates (Fig. S7,† E1–E4). The hydrodynamic diameter of these aggregates gradually decreases with an increase in fraction of water (buffer). In 20% buffer, the hydrodynamic diameter of aggregates is 181 nm, which decreases to 130, 27 and 25 nm on respective increases in fraction of water to 40%, 80% and 99.9%.
The UV-vis spectrum of NIR-SPM (10 μM) in DMSO gives an absorption band with maxima at ∼510 nm (ε = 75![[thin space (1/6-em)]](https://www.rsc.org/images/entities/char_2009.gif) 900 L mol−1 cm−1) (Fig. S8A,† 2B). The steady addition of water amount to NIR-SPM solution in DMSO results in gradual blue shift in the absorption maximum and is associated with a decrease in the absorption. In 99.9% buffer, the absorption maximum is blue shifted by 30 nm to 480 nm in comparison to that in DMSO and the ε value is decreased to 54
900 L mol−1 cm−1) (Fig. S8A,† 2B). The steady addition of water amount to NIR-SPM solution in DMSO results in gradual blue shift in the absorption maximum and is associated with a decrease in the absorption. In 99.9% buffer, the absorption maximum is blue shifted by 30 nm to 480 nm in comparison to that in DMSO and the ε value is decreased to 54![[thin space (1/6-em)]](https://www.rsc.org/images/entities/char_2009.gif) 500 L mol−1 cm−1. This blue-shift in absorption maximum is attributed to the H-aggregation of the molecules of NIR-SPM with the increase in fraction of water.
500 L mol−1 cm−1. This blue-shift in absorption maximum is attributed to the H-aggregation of the molecules of NIR-SPM with the increase in fraction of water.
The probe NIR-SPM in DMSO on excitation at 490 nm gives an emission spectrum with maximum at 740 nm (Fig. S8C†). The addition of water results in a fast decrease in fluorescence intensity at 740 nm (Fig. S8D†) and in the DMSO–buffer (1![[thin space (1/6-em)]](https://www.rsc.org/images/entities/char_2009.gif) :
:![[thin space (1/6-em)]](https://www.rsc.org/images/entities/char_2009.gif) 1) mixture, the fluorescence intensity is reduced by >90%. Further increase in fw shows a nominal decrease in fluorescence intensity. The quantum yield in DMSO is found to be 6.26%, which is reduced to 0.84% in 99.9% buffer. The dynamic light scattering experiments reveal that in 40% buffer (Fig. S8,† E1), NIR-SPM exists as nano-aggregates with a hydrodynamic diameter of 232 nm. The size of aggregates is reduced to 94 and 23 nm on increasing the fraction of HEPES buffer to 60% and 80%. In 99.9% buffer, NIR-SPM exists as aggregates with a diameter of 50 nm. Therefore, both R-SPM and NIR-SPM with increasing amounts of water undergo aggregation induced fluorescence quenching, though this quenching is more efficient up to 50% water fraction.
1) mixture, the fluorescence intensity is reduced by >90%. Further increase in fw shows a nominal decrease in fluorescence intensity. The quantum yield in DMSO is found to be 6.26%, which is reduced to 0.84% in 99.9% buffer. The dynamic light scattering experiments reveal that in 40% buffer (Fig. S8,† E1), NIR-SPM exists as nano-aggregates with a hydrodynamic diameter of 232 nm. The size of aggregates is reduced to 94 and 23 nm on increasing the fraction of HEPES buffer to 60% and 80%. In 99.9% buffer, NIR-SPM exists as aggregates with a diameter of 50 nm. Therefore, both R-SPM and NIR-SPM with increasing amounts of water undergo aggregation induced fluorescence quenching, though this quenching is more efficient up to 50% water fraction.
3.3 Effect of SDS on UV-vis and fluorescence spectra of R-SPM and NIR-SPM
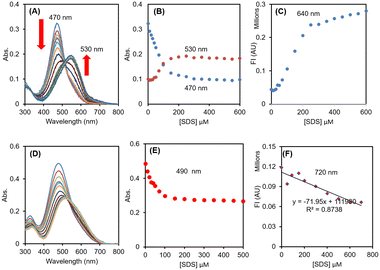
R-SPM (10 μM, HEPES buffer, 0.1% DMSO) gives an absorption spectrum with maximum at 470 nm. On addition of SDS, the absorbance at 470 nm gradually decreases up to addition of 80 μM SDS. On further increasing the concentration of SDS, a new absorbance band appears at 530 nm (Fig. 1A) and achieves a plateau on addition of 200 μM SDS (Fig. 1B). On excitation at 490 nm, the emission spectrum exhibits weak emission with maximum at 640 nm, the intensity of which gradually increases with the increase in concentration of SDS (Fig. 1C). After addition of 500 μM SDS, a nearly six times increase in emission intensity is observed.
NIR-SPM (10 μM) in HEPES buffer exhibits an absorbance spectrum with maximum at 480 nm. On addition of SDS up to 50 μM, the maximum does not undergo any change. However, on further addition of amounts of SDS the maximum undergoes gradual red-shift (Fig. 1D) and on addition of 300 μM SDS, the absorbance shifts to 512 nm and then becomes stable. The plot of absorbance at 490 nm against [SDS] shows a steady decrease in absorbance with addition of SDS up to 150 μM and then achieves a plateau (Fig. 1E). During this process, the molar absorbance of NIR-SPM is decreased from 46![[thin space (1/6-em)]](https://www.rsc.org/images/entities/char_2009.gif) 700 L mol−1 cm−1 to 27
700 L mol−1 cm−1 to 27![[thin space (1/6-em)]](https://www.rsc.org/images/entities/char_2009.gif) 800 L mol−1 cm−1. On excitation at 490 nm, NIR-SPM gives weak fluorescence with maximum at 720 nm, which steadily decreases to half of its value with 500 μM SDS (Fig. 1F). This decrease in fluorescence intensity is in agreement with the decrease in absorbance.
800 L mol−1 cm−1. On excitation at 490 nm, NIR-SPM gives weak fluorescence with maximum at 720 nm, which steadily decreases to half of its value with 500 μM SDS (Fig. 1F). This decrease in fluorescence intensity is in agreement with the decrease in absorbance.
Therefore, for probes R-SPM and NIR-SPM, the effect of SDS on their UV-vis spectra is similar but in the case of fluorescence studies, the fluorescence intensity of R-SPM exhibits a 6-fold increase while NIR-SPM shows a small decrease.
3.4 Selectivity of R-SPM∩SDS and NIR-SPM∩SDS towards spermine and spermidine
To rationalize the effect of SDS concentration on the sensitivity of R-SPM∩SDS and NIR-SPM∩SDS ensembles towards SPM and SPD, the solutions of R-SPM (10 μM) and NIR-SPM (10 μM) were treated with 100 μM spermine and then were titrated with SDS. The fluorescence spectrum of R-SPM and NIR-SPM remained unaffected by the addition of spermine. On steady addition of SDS to these solutions, the fluorescence intensity gradually increased (Fig. S9†). Both probes showed a maximum increase in fluorescence intensity with 500–600 μM SDS. Therefore, for all further studies for evaluation of R-SPM and NIR-SPM towards various species, the respective self-assemblies were prepared by treating 10 μM probe with 500 μM SDS.We have evaluated the selectivity of R-SPM∩SDS and NIR-SPM∩SDS assemblies towards spermine and spermidine in comparison to various biological amines, thiols, amino acids and proteins. In each case, 5 equivalents of the target species was added to R-SPM∩SDS and NIR-SPM∩SDS and the fluorescence spectra were recorded using 490 nm excitation wavelength. R-SPM∩SDS with spermine and spermidine exhibited respective 17-fold and 8-fold increase in fluorescence intensity at 640 nm, whereas the addition of other amines, amino acids, thiols, proteins, etc. did not exhibit any observable change in fluorescence intensity of the R-SPM∩SDS ensemble (Fig. S10†). The solutions of R-SPM∩SDS with spermine and spermidine appeared red under 365 nm light, whereas the solutions containing other analytes remained non-fluorescent.
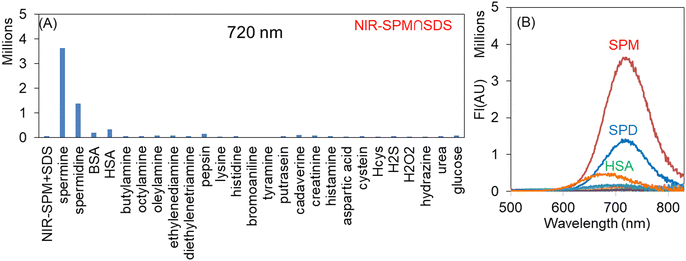
Similarly, NIR-SPM∩SDS with spermine and spermidine exhibited respective 48-fold and 18-fold increase in fluorescence intensity at 720 nm, whereas the addition of other amines, amino acids, thiols, proteins, etc. did not cause any observable change in fluorescence intensity of NIR-SPM∩SDS (Fig. 2A and B). The solutions of NIR-SPM∩SDS with spermine and spermidine appeared red under 365 nm light, whereas the solutions containing other analytes remained non-fluorescent. The solution NIR-SPM∩SDS having HSA, the most abundant protein in plasma, exhibited weak fluorescence with a blue-shifted emission band at 680 nm.
Therefore, both R-SPM∩SDS and NIR-SPM∩SDS ensembles exhibit a sharp increase in fluorescence intensity with spermine and spermidine and remain silent to other analytes and can find application for the detection of spermine and spermidine. These results are in contrast to earlier reported results, where dipod∩SDS ensembles resulted in fluorescence quenching with spermine.3c
3.5 Quantitative detection and sensitivity of R-SPM∩SDS and NIR-SPM∩SDS towards spermine and spermidine
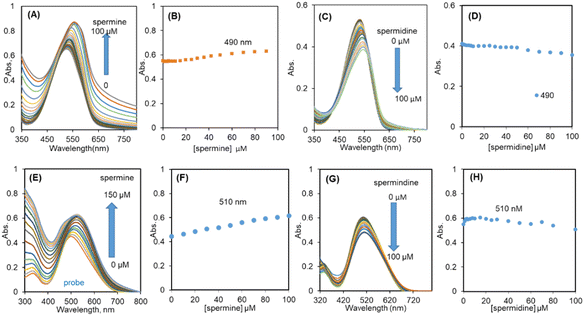
The UV-vis spectrum of R-SPM∩SDS (10∩500 μM, HEPES buffer) exhibited an absorption maximum at 490 nm. On gradual addition of spermine, the absorbance of the RSPM∩SDS ensemble marginally increased and was associated with red-shift of the maximum to 540 nm (Fig. 3A and B). However, addition of spermidine to R-SPM∩SDS resulted in the red-shift in the absorbance band and was associated with minimal change in absorbance (Fig. 3C and D).The UV-vis spectrum of NIR-SPM∩SDS (10∩500 μM, HEPES buffer) gave an absorption band with maxima at ∼510 nm (ε = 48![[thin space (1/6-em)]](https://www.rsc.org/images/entities/char_2009.gif) 600 L mol−1 cm−1) (Fig. 3E). The gradual addition of spermine resulted in ∼10 nm red-shift in absorption maximum and an increase in the ε value to 61
600 L mol−1 cm−1) (Fig. 3E). The gradual addition of spermine resulted in ∼10 nm red-shift in absorption maximum and an increase in the ε value to 61![[thin space (1/6-em)]](https://www.rsc.org/images/entities/char_2009.gif) 700 L mol−1 cm−1 up to 100 μM spermine, beyond which only a residual increase was observed (Fig. 3F). The tail of the absorbance band extended to longer wavelength i.e. beyond 800 nm in the case of interaction of spermine with R-SPM∩SDS or NIR-SPM∩SDS and led to the formation of bigger aggregates and increased Mie scattering of the respective solutions. However, interaction of spermidine with the R-SPM∩SDS or NIR-SPM∩SDS ensemble resulted in minimal lowering in absorbance with only a small increase in Mie scattering and so the size of aggregates (Fig. 3G and H).
700 L mol−1 cm−1 up to 100 μM spermine, beyond which only a residual increase was observed (Fig. 3F). The tail of the absorbance band extended to longer wavelength i.e. beyond 800 nm in the case of interaction of spermine with R-SPM∩SDS or NIR-SPM∩SDS and led to the formation of bigger aggregates and increased Mie scattering of the respective solutions. However, interaction of spermidine with the R-SPM∩SDS or NIR-SPM∩SDS ensemble resulted in minimal lowering in absorbance with only a small increase in Mie scattering and so the size of aggregates (Fig. 3G and H).
The UV-vis studies have been well supported by DLS experiments. The probe R-SPM (10 μM, HEPES buffer) exists as aggregates with 25 nm size. On addition of SDS, the average size of aggregates of R-SPM∩SDS (10 μM, 500 μM) was increased to ∼40 nm. The addition of spermine (100 μM) to R-SPM∩SDS (10 μM, 500 μM) resulted in the increase in size of aggregates to 217 (62%) and 591 nm (37%). This increase in size of aggregates could result in the increased Mie scattering observed in UV-vis experiments (Fig. 4, left column). However, the addition of spermidine (100 μM) to R-SPM∩SDS (10 μM, 500 μM) formed aggregates with only 180 nm size and caused Mie scattering to a small extent only. The probe NIR-SPM (10 μM, HEPES buffer) in buffer exists as nano-aggregates of 50 nm size. On addition of SDS (500 μM) the size of aggregates was increased to 58 nm size (98%) and 238 nm (2%). The addition of spermine (100 μM) to NIR-SPM∩SDS aggregates led to increased size of aggregates to 240 nm (40%) and 585 nm (60%) and was associated with Mie scattering in UV-vis experiments (Fig. 4, right column). The spermidine (100 μM) formed NIR-SPM∩SDS∩spermidine ensembles with an average size of 240 nm. Therefore, spermine with both R-SPM∩SDS and NIR-SPM∩SDS formed larger (∼590 nm) aggregates than those formed by spermidine (∼200 nm).
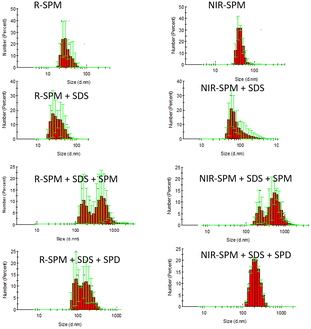 | ||
| Fig. 4 The DLS studies showing the effect of SDS, spermine and spermidine on the size of aggregates of R-SPM (left column) and NIR-SPM (right column). | ||
Further to rationalize the step-wise interaction of aggregates with SDS and then with spermine and spermidine, zeta potential studies were performed. The probe R-SPM shows a zeta potential of −2.7 mV which points to the strong electrostatic interactions of bromide ions on the surface of aggregates. The zeta potential of aggregates of R-SPM on interaction with SDS goes to a further negative value of −13.7 mV pointing to the presence of negatively charged SDS molecules on the surface of R-SPM aggregates. The spermine interacts on the surface of these aggregates resulting in a lower negative zeta potential of −7.1 mV pointing to partial neutralization of effect of SDS molecules. However, due to the interaction of aggregates of R-SPM with SDS and then with spermine, the size of aggregates is substantially increased (DLS studies, Fig. 4). The spermidine molecules interact at a lesser extent on the surface of R-SPM∩SDS aggregates and cause a smaller change in zeta potential to −11.0 mV. NIR-SPM exhibits similar results with SDS, followed by spermine and spermidine. The zeta potential of NIR-SPM aggregates is −0.8 mV which on interaction with SDS reaches −13.7 mV and on further interaction with spermine is shifted to −7.7 mV.
The fluorescence lifetime studies of NIR-SPM showed that it fits in the biexponential curve. The fluorescence lifetime τ1 remained constant at around 0.1 ns after addition of SDS and spermine. However, on addition of SDS to NIR-SPM, τ2 showed a decrease in its value from 27.43 ns to 23.95 ns. Here, the aggregates of NIR-SPM loosen up and electron transfer from SDS sulfonate to the pyridinium moiety keeps the low fluorescence. The addition of spermine to these aggregates resulted in the decrease in lifetime to 14.84 ns in the presence of 10 equivalents of spermine. The change in the lifetime values shows that the mechanism is dynamic. The decrease in the lifetime strongly supports the participation of a photoinduced electron transfer process.34 The strong electrostatic interactions between quaternary salt of spermine and sulfonate of SDS inhibit the PET from sulfonate of SDS to pyridinium moieties. This results in an increase in fluorescence after addition of spermine to NIR-SPM–SDS solution (Scheme 2). A similar phenomenon results in enhanced fluorescence of R-SPM–SDS solution on interaction with spermine.
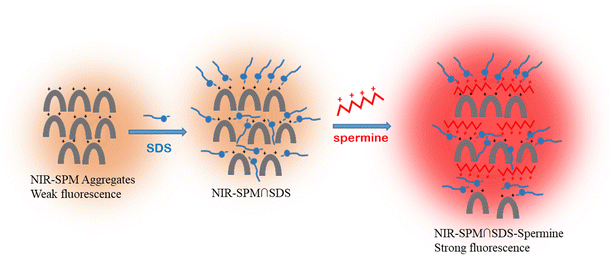 | ||
| Scheme 2 Schematic representation of the mechanism involved in selective sensing of spermine by R-SPM∩SDS and NIR-SPM∩SDS ensembles. | ||
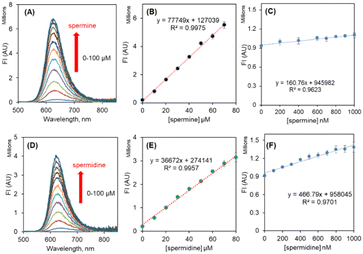
On addition of aliquots of spermine to R-SPM∩SDS (10∩500 μM, HEPES buffer), a steady increase in the fluorescence intensity at 640 nm was observed up to addition of 70 μM spermine. Further addition of spermine resulted in only a residual increase in the fluorescence intensity (Fig. 5A and B). R-SPM∩SDS with spermine (100 μM) resulted in a ∼29-fold increase in fluorescence intensity and appeared red under 365 nm light. The fluorescence increased linearly between 0 μM and 70 μM spermine and could detect as low as 22 nM spermine (Fig. 5C). However, titration of R-SPM∩SDS with spermidine (100 μM) resulted in a 16-fold increase in fluorescence intensity at 640 nm, after which only a residual increase was observed (Fig. 5D and E). The R-SPM∩SDS ensemble can detect spermidine with an LOD of 77 nM (Fig. 5F).
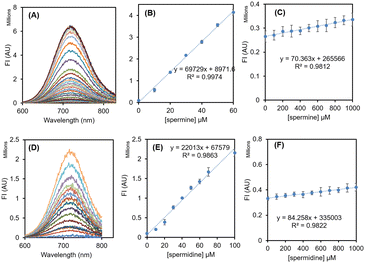
NIR-SPM∩SDS (10∩500 μM, HEPES buffer) with spermine exhibited a steady increase in the fluorescence intensity at 720 nm up to addition of 60 μM spermine. Further addition of spermine resulted in only a residual increase in the fluorescence intensity (Fig. 6A and B). NIR-SPM∩SDS with spermine (100 μM) resulted in a ∼80-fold increase in fluorescence intensity and appeared red under 365 nm light. The fluorescence increased linearly between 0 and 1000 nM spermine and could detect as low as 34 nM spermine (Fig. 6C). However, titration of NIR-SPM∩SDS with spermidine (100 μM) resulted in a 29-fold increase in fluorescence intensity at 720 nm, after which only a residual increase was observed (Fig. 6D and E). The NIR-SPM∩SDS ensemble can detect spermidine with an LOD of 67 nM (Fig. 6F). The LOD values have been calculated as per IUPAC norms.
3.6 Effect of temperature on fluorescence intensity of ensembles and on interaction of ensembles with spermine
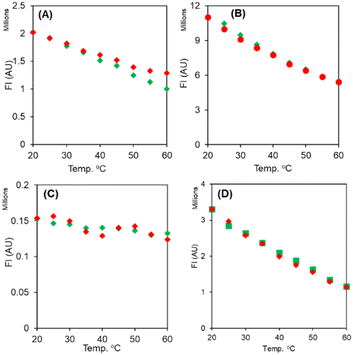
In order to rationalize the effect of temperature on the fluorescence intensity of R-SPM∩SDS, NIR-SPM∩SDS, R-SPM∩SDS∩spermine and NIR-SPM∩SDS∩spermine, the respective solutions were heated from 20 to 60 °C and then were allowed to cool back to 20 °C and the fluorescence spectra were recorded with every 5 °C change in temperature.NIR-SPM∩SDS revealed a minimal effect of temperature on its fluorescence intensity between 20–60 °C. The R-SPM∩SDS, R-SPM∩SDS∩spermine and NIR-SPM∩SDS∩spermine ensembles exhibited a gradual decrease in fluorescence intensity with an increase in temperature but on lowering the temperature, the fluorescence intensity reverted back to the initial value. The decrease in fluorescence intensity on increasing temperature could be assigned to the increase in flexibility in ensembles leading to faster decay of excited states. The reversibility of fluorescence intensity on variation in temperature clearly shows their equilibration by controlling temperature (Fig. 7).
3.7 Analysis of spermine in biofluids like urine and serum
For real time or practical application of the developed ensembles, real biological samples of human urine and human blood serum were collected as their collection is non-invasive, easily available and also they have biomarkers whose concentration variations can cause various types of cancer in the human body. We firstly studied the interference of various components present in urine such as sodium and potassium salts, urea, uric acid, creatinine and proteins viz. BSA and HSA. It was found that the proteins at 1 μM concentration resulted in <1% enhancement in the fluorescence signal with a blue shift, whereas other species do not induce any change in fluorescence even when present at 50 μM amounts. We analyzed urine samples taken from two healthy subjects. The pretreated urine sample (1000 μl) was added to the solution of R-SPM∩SDS (15 μM∩750 μM) and NIR-SPM∩SDS (15 μM∩750 μM) and the fluorescence values were compared to the standard calibration curve after taking three replicate measurements. In the urine samples, spermine was found to be 376 ± 75 nM and 297 ± 91 nM which are in agreement with most of the reported values of spermine in healthy human urine.3The pretreated serum sample (200 μl) was added to R-SPM∩SDS (10 μM∩500 μM)/NIR-SPM∩SDS (10 μM∩500 μM) and their fluorescence spectra were recorded. The fluorescence intensities were compared to the standard calibration curve after taking three replicate measurements. In the serum sample, spermine was found to be 225 ± 48 μM and 112 ± 31 μM which are in the range of reported values of spermine in healthy human blood serum.2
3.8 Quantitative determination of spermine in four different food samples
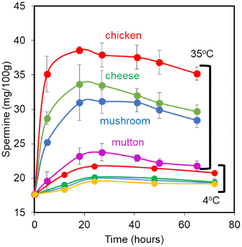
For evaluation of real time application of the probes∩SDS complex, four types of food items having rich amounts of spermine were chosen. These foods are degraded by enzymes by various routes like amine oxidase, copper-containing amine oxidase or xanthamine oxidase. Also, the uncontrolled microbial enzymatic action results in aggregation of biogenic amines which degrade food products.35 These microorganisms are mainly active at high storage temperatures, high pH and under aerobic conditions.5.0 grams of each food sample was dipped in 20 ml of double distilled water and stored at 4 °C and 35 °C. Each time 500 μl of water from these samples was taken and was added to NIR∩SDS (12 μM∩600 μM) (2.5 ml) solution to keep the final concentration of NIR∩SDS (10 μM∩500 μM) and fluorescence spectra were recorded for a period of 3 days.
The rate of deterioration and release of spermine was found to be least after 5 hours in all the four food samples. It was found to be 25.16 mg/100 g, 28.68 mg/100 g, 35.11 mg/100 g and 19.56 mg/100 g for mushroom, cheese, chicken and mutton, respectively. When the storage period was extended to 18 hours, the spermine content increased to 30.97 mg/100 g, 33.67 mg/100 g, 38.59 mg/100 g and 23.19 mg/100 g for mushroom, cheese, chicken and mutton, respectively. Prolonging the storage periods to 27, 41, 50 and 65 hours, a small decrease in spermine content was noticed (Table 2). On storing the samples at 4 °C, no significant release of spermine was observed (Fig. 8).
| Sr. no. | Time (h) | [SPM] mushroom mg/100 g | [SPM] cheese mg/100 g | [SPM] chicken mg/100 g | [SPM] mutton mg/100 g |
|---|---|---|---|---|---|
| 1 | 5 | 25.16 | 28.68 | 35.11 | 19.56 |
| 2 | 18 | 30.97 | 33.67 | 38.59 | 23.19 |
| 3 | 27 | 31.13 | 33.47 | 37.90 | 23.74 |
| 4 | 41 | 30.97 | 32.03 | 37.57 | 22.93 |
| 5 | 50 | 29.92 | 30.92 | 36.83 | 22.22 |
| 6 | 65 | 28.38 | 29.67 | 35.18 | 21.78 |
Amongst literature references, entry 3 and ref. 14, the combination of a graphene quantum dots–cationic red dye donor–acceptor pair and cucurbit[7]uril reveals the lowest detection limits but is based on fluorescence quenching of the supramolecular complex at 535 nm on interaction with spermine (entry 3, Table 1). The self-assembly of a dye with CB[7] on interaction with SPD/SPM gives fluorescence enhancement in the NIR region (entry 4, Table 1) but has not been used for practical applications. The self-assemblies being reported here show fluorescence enhancement in the red (640 nm) and far-IR (720 nm) region and can find application in detection of spermine from serum, urine and food samples. Further, the smartphone relied RGB analysis facilitates the on-site determination of spermine in food samples.
3.9 Detection of spermine using a smartphone (RGB analysis)
In recent years, smartphone based analysis has provided a commercial and accurate method for on-site or real time determination of analytes in a portable manner.36 The present study proposes a smartphone based determination of spermine via RGB profile analysis recorded by colour analyzer software installed in a Redmi Android smartphone (model number: Xiaomi K20 Pro). This software gives the RGB values of the images captured from different solutions (camera specifications: 48 MP, f/1.8, 26 mm wide). For capturing the images, the phone was kept at a distance of 25 cm from the sample. During the measurement, the distance between the UV light source and the sample was also kept constant. The colour analyzer software splits the sample's colour fluorescence image into red (R), green (G), and blue (B) channels. The desired analysis was conducted by adding various concentrations of spermine (0–80 μM) to the solution of NIR-SPM (10 μM)∩SDS (500 μM ensemble). The pictures of the prepared solutions were then taken using the smartphone and were separately analyzed by the software. It has been observed that as the concentration of spermine is increased, the intensity of the red colour is also increased as indicated by the red colour value given by the colour analyzer software and the change observed between 0–80 μM was linear with an R2 value of 0.991 (Fig. 9). Further we have used the smartphone for the analysis of spermine content in the food samples as has been evaluated using the fluorescence technique. 5 grams of each food sample was taken in 10 ml of water. After 7 hours, 500 μl of water sample was added to the NIR-SPM (12 μM)∩SDS (600 μM) ensemble (2.5 ml) and was analyzed in terms of μM concentration in each water sample using the smartphone analysis linear calibration curve. These values were finally converted to mg/100 g in each sample. After 7 h, the amount of SPM released from mushroom, cheese, chicken, mutton was found to be 33.6 mg/100 g; 66.21 mg/100 g; 84.8 mg/100 g and 19.7 mg/100 g, respectively.4. Conclusions
Thus, weakly fluorescent supramolecular assemblies of donor–π–acceptor dipods (R-SPM) (λem 640 nm) and (NIR-SPM) (λem 720 nm) exhibit 30–80 fold “turn-on” response towards spermine and can detect spermine at 22 nM (4.4 ppb) concentrations. AFM, DLS and zeta-potential studies conclusively delineate the formation of assemblies. The potential of these assemblies for real world applications like analysis of spermine from urine, human serum and food spoilage in the case of cheese, mushroom, chicken and mutton has been demonstrated. The smartphone-relied RGB analysis speeds up the detection procedure, and also offers a new methodology for real-time analysis of spermine.Human sample statement
The permission for the experiments with blood samples was provided by the institutional ethical committee, Guru Nanak Dev University, and in accordance with the declaration of Helsinki. Informed consents were obtained from all human subjects who participated in this study.Conflicts of interest
There are no conflicts of interest to declare.Acknowledgements
S. K. thanks the UGC for a UGC-BSR faculty F.4-5(11)/2019 (BSR) fellowship. We thank the UGC for UPE and PURSE programmes to the university and the CAS status to the department and DST for FIST program.References
- (a) H. Sanayama, K. Ito, S. Ookawara, T. Uemura, S. Imai, S. Kiryu, M. Iguchi, Y. Sakiyama, H. Sugawara, Y. Morishita, K. Tabei, K. Igarashi and K. Soda, Biomedicines, 2023, 11, 746 CrossRef CAS PubMed; (b) S. Saiki, Y. Sasazawa, M. Fujimaki, K. Kamagata, N. Kaga, H. Taka, Y. Li, S. Souma, T. Hatano, Y. Imamichi, N. Furuya, A. Mori, Y. Oji, S. I. Ueno, S. Nojiri, Y. Miura, T. Ueno, M. Funayama, S. Aoki and N. Hattori, Ann. Neurol., 2019, 86, 251–263 CrossRef CAS PubMed; (c) A. Boffi, G. Favero, R. Federico, A. Macone, R. Antiochia, C. Tortolini, G. Sanzó and F. Mazzei, Anal. Bioanal. Chem., 2015, 407, 1131–1137 CrossRef CAS PubMed.
- S. A. Ibrahim, J. A. Zainulabdeen and H. M. Jasim, Biomed. Pharmacol. J., 2018, 11, 1389–1396 CAS.
- (a) P. C. Kuo, C. W. Lien, J. Y. Mao, B. Unnikrishnan, H. T. Chang, H. J. Lin and C. C. Huang, Anal. Chim. Acta, 2018, 1009, 89–97 CrossRef CAS PubMed; (b) N. J. Martínez, M. G. Bejar, Y. M. Martínez, P. C. Falco and J. P. Prieto, Anal. Chem., 2014, 86, 1347–1351 CrossRef PubMed; (c) N. Tripathi, P. Singh, V. Luxami, D. Mahajan and S. Kumar, Sens. Actuators, B, 2018, 270, 552–561 CrossRef CAS; (d) R. Liu, Y. Jia, W. Cheng, J. Linga, L. Liu, K. Bi and Q. Li, Talanta, 2011, 83, 751–756 CrossRef CAS PubMed.
- H. Deng, V. A. Bloomfield, J. M. Benevides and G. J. Jr, Nucleic Acids Res., 2000, 28, 3379–3385 CrossRef CAS PubMed.
- F. Madeo, M. A. Bauer, D. C. Gutierrez and G. Kroemer, Autophagy, 2019, 15, 165–168 CrossRef CAS PubMed.
- S. M. Wortha, S. Frenzel, M. Bahls, M. Habes, K. Wittfeld, S. V. Auwera, R. Bülow, S. Zylla, N. Friedrich, M. Nauck, H. Völzke, H. J. Grabe, C. Schwarz and A. Flöel, Alzheimer's Dementia, 2023, 19, 1832–1840 CrossRef CAS PubMed.
- E. W. Gerner, E. Bruckheimer and A. Cohen, J. Biol. Chem., 2018, 293, 18770–18778 CrossRef CAS PubMed.
- R. T. Tse, C. Y. P. Wong, P. K. F. Chiu and C. F. Ng, Int. J. Mol. Sci., 2022, 23, 1258 CrossRef CAS PubMed.
- R. A. Casero, T. M. Stewart and A. E. Pegg, Nat. Rev. Cancer, 2018, 18, 681–695 CrossRef PubMed.
- D. Doeun, M. Davaatseren and M. S. Chung, Food Sci. Biotechnol., 2017, 26, 1463–1474 CrossRef CAS PubMed.
- P. Song, L. Wu and W. Guan, Nutrients, 2015, 7, 9872–9895 CrossRef CAS PubMed.
- M. Cantwell and C. Elliott, J. Clin. Nutr. Diet., 2017, 3, 27 Search PubMed.
- P. B. Tsafack and A. Tsopmo, Heliyon, 2022, 8, 10456 CrossRef PubMed.
- A. A. Bhosle, M. Banerjee, S. D. Hiremath, D. S. Sisodiya, V. G. Naik, N. Barooah, A. C. Bhasikuttan, A. Chattopadhyaya and A. Chatterjee, J. Mater. Chem. B, 2022, 10, 8258–8273 RSC.
- A. A. Bhosle, M. Banerjee, N. Barooah, A. C. Bhasikuttan, K. Kadu, S. R. Ramanan and A. Chatterjee, J. Photochem. Photobiol., A, 2022, 426, 113770 CrossRef CAS.
- V. G. Naik, V. Kumar, A. C. Bhasikuttan, K. Kadu, S. Roy Ramanan, A. A. Bhosle, M. Banerjee and A. Chatterjee, ACS Appl. Bio Mater., 2021, 4, 1813–1822 CrossRef CAS PubMed.
- H. Tian, X. Yu, J. Yao, G. Gao, W. Wu and C. Yang, Chem. Commun., 2021, 57, 1806–1809 RSC.
- N. N. Nghia, B. T. Huy, P. T. Phong, J. S. Han, D. H. Kwon and Y. Lee, PLoS One, 2021, 16, 0251306 Search PubMed.
- S. Chopra, J. Singh, H. Kaur, A. Singh, N. Singh and N. Kaur, Eur. J. Inorg. Chem., 2015, 2015, 4437–4442 CrossRef CAS.
- K. Kumar, S. Kaur, S. Kaur, G. Bhargava, S. Kumar and P. Singh, J. Mater. Chem. B, 2019, 7, 7218–7227 RSC.
- P. Singh, P. Sharma, N. Sharma and S. Kaur, Microchem. J., 2022, 183, 108004 CrossRef CAS.
- S. K. Kailasa, M. L. Desai, S. H. Baek, L. M. T. Phan, T. P. Nguyen, R. Rafique and T. J. Park, New J. Chem., 2019, 43, 17069 RSC.
- P. C. Kuo, C. W. Lien, J. Y. Mao, B. Unnikrishnan, H. T. Chang, H. J. Lin and C. C. Huang, Anal. Chim. Acta, 2018, 1009, 89–97 CrossRef CAS PubMed.
- J. R. Bhamore, Z. V. P. Murthy and S. Kumar Kailasa, J. Mol. Liq., 2019, 280, 18–24 CrossRef CAS.
- K. A. Rawat, J. R. Bhamore, R. K. Singhal and S. K. Kailasa, Biosens. Bioelectron., 2017, 88, 71–77 CrossRef CAS PubMed.
- S. Chopra, J. Singh, H. Kaur, H. Singh, N. Singh and N. Kaur, New J. Chem., 2015, 39, 3507 RSC.
- H. Jiang, X. Rao, L. Li and Z. Liu, Analyst, 2020, 145, 7673 RSC.
- Z. De Liu, H. Y. Zhu, H. X. Zhao and C. Z. Huang, Talanta, 2013, 106, 255–260 CrossRef PubMed.
- J. Wang, Q. Zhang, Z. D. Liu and C. Z. Huang, Analyst, 2012, 137, 5565 RSC.
- M. Barros, S. Ceballos, P. Arroyo, J. A. Sáez, M. Parra, S. Gil, A. M. Costero and P. Gaviña, Chemosensors, 2022, 10, 8 CrossRef CAS.
- J. Huang, W. Ye, S. Zha, Y. Tao, M. Yang, K. Huang, J. Liu, Y. H. Fung, Y. Li, P. Li, L. Zhu and C. S. Lee, J. Lumin., 2021, 232, 117856 CrossRef CAS.
- M. Nakamura, T. Sanji and M. Tanaka, Chem. – Eur. J., 2011, 17, 5344–5349 CrossRef CAS PubMed.
- G. Jiang, W. Zhu, Q. Chen, X. Li, G. Zhang, Y. Li, X. Fan and J. Wang, Sens. Actuators, B, 2018, 261, 602 CrossRef CAS.
- N. Meher and P. K. Iyer, Angew. Chem., Int. Ed., 2018, 57, 8488–8892 CrossRef CAS PubMed.
- J. Zeng, J. Wu, H. Chen and S. Ni, International Journal of Agricultural Science and Food Technology, 2021, 7, 331–334 Search PubMed.
- (a) S. Banik, S. K. Melanthota, Arbaaz, J. M. Vaz, V. M. Kadambalithaya, I. Hussain, S. Dutta and N. Mazumder, Anal. Bioanal. Chem., 2021, 413, 2389–2406 CrossRef CAS PubMed; (b) K. E. McCrackena and J. Y. Yoon, Anal. Methods, 2016, 8, 6591–6601 RSC; (c) Pratibha, A. Kapoor, J. K. Rajput and A. Kumar, Anal. Chem., 2022, 94, 17685–17691 CrossRef CAS PubMed.
- P. Singh, L. S. Mittal, G. Bhargava and S. Kumar, Chem. – Asian J., 2017, 12, 890–899 CrossRef CAS PubMed.
- A. H. Malik, S. Hussain and P. K. Iyer, Anal. Chem., 2016, 88, 7358–7364 CrossRef CAS PubMed.
- S. A. Moayed, A. Bigdeli and M. R. H. Nezhad, Food Chem., 2022, 384, 132459 CrossRef PubMed.
- R. R. Nair, S. Debnath, S. Das, P. Wakchaure, B. Ganguly and P. B. Chatterjee, ACS Appl. Bio Mater., 2019, 2, 2374–2387 CrossRef CAS PubMed.
Footnote |
| † Electronic supplementary information (ESI) available. See DOI: https://doi.org/10.1039/d3sd00300k |
| This journal is © The Royal Society of Chemistry 2024 |

