
 Open Access Article
 This Open Access Article is licensed under a Creative Commons Attribution-Non Commercial 3.0 Unported Licence
Promoting OH* adsorption by defect engineering of CuO catalysts for selective electro-oxidation of amines to nitriles coupled with hydrogen production†
Xu
Yang
,
Enhui
Wei
,
Yuan
Dong
,
Yu
Fan
,
Hongtao
Gao
,
Xiliang
Luo
 * and
Wenlong
Yang
*
* and
Wenlong
Yang
*
Key Laboratory of Optic-electric Sensing and Analytical Chemistry for Life Science, MOE, Key Laboratory of Analytical Chemistry for Life Science in Universities of Shandong, College of Chemistry and Molecular Engineering, Qingdao University of Science and Technology, Qingdao 266042, P. R. China. E-mail: xiliangluo@qust.edu.cn; wlyang@qust.edu.cn
First published on 1st July 2024
Abstract
Developing a high-efficiency benzylamine oxidation reaction (BOR) to replace the sluggish oxygen evolution reaction (OER) is an attractive pathway to promote H2 production and concurrently realize organic conversion. However, the electrochemical BOR performance is still far from satisfactory. Herein, we present a self-supported CuO nanorod array with abundant oxygen vacancies on copper foam (Vo-rich CuO/CF) as a promising anode for selective electro-oxidation of benzylamine (BA) to benzonitrile (BN) coupled with cathodic H2 generation. In situ infrared spectroscopy demonstrates the selective conversion of BA into BN on Vo-rich CuO. Furthermore, in situ Raman spectroscopy discloses a direct electro-oxidation mechanism of BA driven by electroactive hydroxyl species (OH*) over the Vo-rich CuO catalyst. Theoretical and experimental studies verify that the presence of oxygen vacancies is more favorable for the adsorption of OH* and BA molecules, enabling accelerated kinetics for the BOR. As expected, the Vo-rich CuO/CF electrode delivers outstanding BOR activity and stability, giving a high faradaic efficiency (FE) of over 93% for BN production at a potential of 0.40 V vs. Ag/AgCl. Impressively, almost 100% FE for H2 production can be further achieved at the NiSe cathode by integrating BA oxidation in a two-electrode electrolyzer.
Introduction
Water electrolysis to produce hydrogen has been deemed as a promising strategy to address the increasing energy crisis and environmental issues resulting from the immoderate depletion of non-renewable fossil fuels. However, compared to the cathodic hydrogen evolution reaction (HER), the kinetics of the anodic oxygen evolution reaction (OER) is thermodynamically more sluggish because of its complicated four-electron transfer process, necessitating high overpotentials to drive this electrochemical process, thus severely hindering the overall energy conversion efficiency of water splitting.1–5 In this regard, constructing a hybrid water electrolysis system by replacing the sluggish OER with more advantageous electro-oxidation of organic small molecules has been deemed as a feasible strategy to promote sustainable hydrogen production in the cathode and concurrently accomplish biomass upgrading instead of valueless oxygen production in the anode.6–10 As an appealing anodic reaction coupled with the HER with a lower energy consumption, selective electro-oxidation of primary amines into nitriles holds immense promise for feedstock fabrication in the chemical industry, especially considering the widespread applications of nitriles in the fields of pharmaceuticals, pesticides, dyes and fine chemicals, which could significantly alleviate serious production safety and environment issues inevitably involved in the traditional synthetic routes.11–15 Therefore, it is highly necessary and economically profitable to develop a desirable anode for selectively electrooxidizing primary amines to nitriles at low potential with high faradaic efficiency.Recently, great effort has been made to pursue earth-abundant 3d transition metals as advanced alternatives to noble-metal-based catalysts in the area of electrochemistry, thanks to their attractive advantages of environmental friendliness, rich sources, low cost and high efficiency.16–21 In particular, copper-based catalysts, as one promising group of anode candidates with versatile oxidation properties, are extensively applied for energy and biomass conversion. For instance, Cu-based oxides or hydroxides formed on the surface of commercial copper foam (CF) have been demonstrated to boost electro-oxidative glucose upgrading paired with cathodic hydrogen production.22,23 Antiperovskite Cu3N nanosheets exhibit outstanding electrochemical activity for selective oxidation of methanol to formate.24 The self-construction of Cu2S nanosheets achieves significantly enhanced electrochemical conversion of 5-hydroxymethylfurfural to 2,5-furandicarboxylic acid.25 Surprisingly, the electro-oxidation performance of Cu-based catalysts, to the best of our knowledge, has rarely been reported to selectively convert primary amines to nitriles through a facile dehydrogenation process. On the other hand, due to the lack of a systematic study on the mechanism of amine oxidation and complex surface reconstruction of Cu-based catalysts during the electro-oxidation reaction, fundamental understanding of the activity origin of Cu-based catalysts is imperative yet still indeterminate, making it more difficult to guide the further optimization of electrocatalytic efficiency towards chemical conversion. As one fascinating amelioration strategy, defect engineering, especially focusing on oxygen vacancies (Vo) existing widely in metal oxides or hydroxides, could endow the catalysts with significantly modified electronic structures and enhanced molecule adsorption/activation capacity, which enables great opportunities to synergistically regulate the reaction kinetics for achieving enhanced catalytic performance.26–31 Accordingly, it is reasonable to anticipate that the incorporation of oxygen vacancies into Cu-based oxides or hydroxides can remarkably improve their electro-oxidation properties. Nevertheless, the crucial roles that oxygen vacancies play in the electro-oxidation of primary amines remain largely elusive in spite of the notable impact of oxygen vacancies on the electrocatalytic activity.
Bearing the above considerations in mind, herein, we construct a self-supported CuO nanorod array with abundant oxygen vacancies on copper foam (denoted as Vo-rich CuO/CF) as a highly active anode to selectively electro-oxidize benzylamine (BA) to benzonitrile (BN) and concurrently boost the H2 production at the cathode. Furthermore, taking Vo-rich CuO as a proof-of-concept model, the relationship between oxygen vacancies and BA oxidation reaction (BOR) activity was elucidated by combining theoretical simulations and experimental validations. With the aid of in situ spectroscopy, the BOR mechanism on Vo-rich CuO was systematically investigated. Benefiting from the presence of numerous Vo defects together with the array configuration, the as-obtained Vo-rich CuO/CF electrode shows a high activity for BA oxidation coupled with H2 evolution at the cathode, resulting in simultaneous organic conversion and clean energy generation.
Results and discussion
As illustrated in Fig. 1A, Cu(OH)2 nanorod arrays were prepared as initial precursors by a facile wet chemical oxidation procedure on CF, which were in situ topologically transformed into a Vo-rich CuO/CF electrode through a fast calcination process at 250 °C for 10 min in an argon atmosphere. As revealed by the scanning electron microscopy (SEM) images in Fig. 1B and C, the surface of bare CF is smooth without discernible attachments, while plenty of Cu(OH)2 nanorods are grown on the CF surface with the chemical oxidation reaction occurring, in good agreement with earlier reports. As shown in Fig. 1D, the pristine morphology and size of the nanorod arrays are substantially preserved, with the exception of a rougher surface (inset in Fig. 1D) after the annealing treatment of Cu(OH)2 precursors on CF, suggesting a phase transformation from Cu(OH)2 to CuO. Also, the X-ray diffraction (XRD) pattern in Fig. S1† confirms the formation of the CuO crystalline phase (JCPDS No. 48-1548) on CF. Furthermore, the as-obtained CuO nanorod arrays were ultrasonically scratched from CF to perform transmission electron microscopy (TEM) analysis. Fig. 1E and F show that the CuO nanorod possesses a typical porous structure primarily due to the decomposition of the Cu(OH)2 precursor, which is favorable for the penetration of the electrolyte and reactant into the interior of the catalyst to promote an electrochemical process. The high-resolution TEM (HRTEM) image in Fig. 1G shows clear lattice fringes with interplanar distances of 0.237 and 0.256 nm indexed respectively to the (111) and (11−1) planes of CuO crystals. The corresponding selected-area electron diffraction (SAED) pattern in Fig. S2† reveals the polycrystalline nature of CuO nanorods.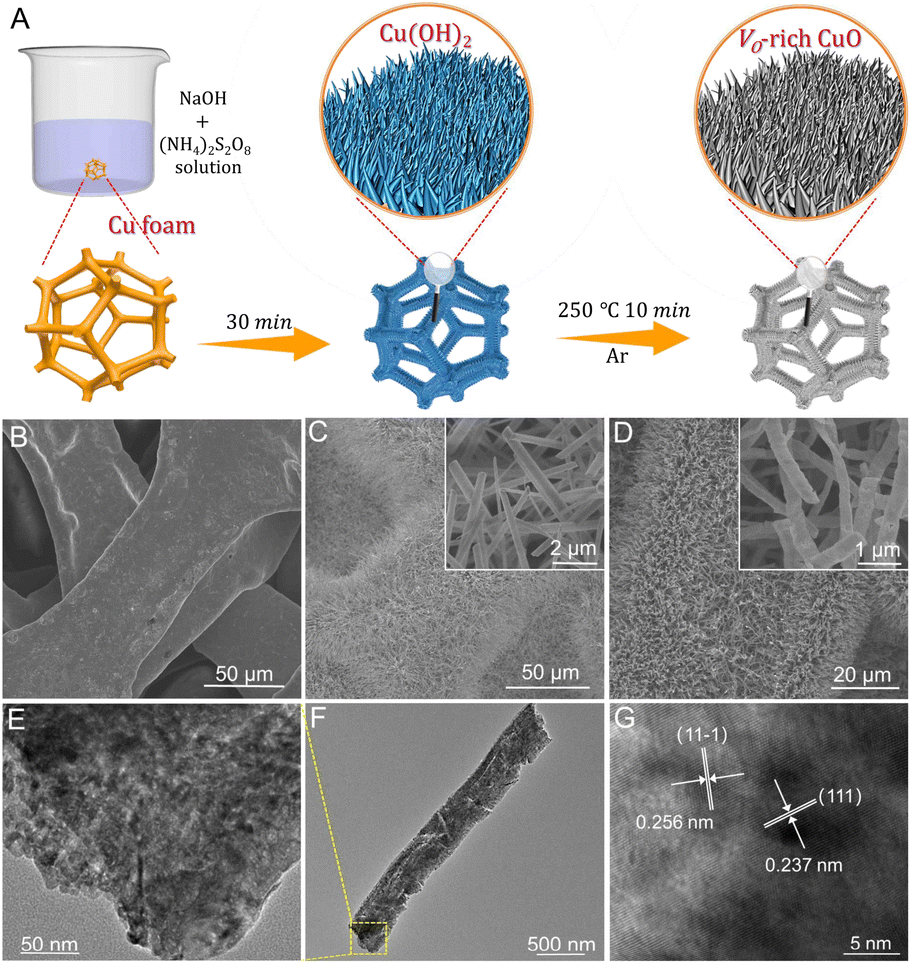 | ||
| Fig. 1 (A) Schematic illustration of the preparation of the Vo-rich CuO/CF electrode. (B) SEM image of bare Cu foam. (C) SEM image ((inset): enlargement) of Cu(OH)2 arrays grown on Cu foam. The inset shows the enlarged Cu(OH)2 nanorods. (D) SEM image ((inset): enlargement) of Vo-rich CuO on Cu foam. (E and F) TEM images and (G) HRTEM image of a single Vo-rich CuO nanorod. | ||
For comparison, a CuO sample that is poor in oxygen vacancies (Vo-poor CuO) was also obtained as a reference by calcining the powdery Vo-rich CuO sample in air. Notably, SEM image (Fig. S3†) and powder XRD patterns (Fig. 2A) indicate that Vo-rich CuO and Vo-poor CuO samples possess similar morphology and size as well as crystalline structures. Raman spectra in Fig. 2B were further employed to gain the structural information of CuO nanorods, from which both of the two samples show three characteristic peaks at 274, 320 and 610 cm−1 corresponding respectively to the Ag, Bg1 and Bg2 modes of CuO.32,33 Moreover, X-ray photoelectron spectroscopy (XPS) was carried out to uncover the valence states and chemical compositions. As shown in Fig. 2C, the high-resolution Cu 2p spectra exhibit two prominent peaks at around 934.0 and 953.8 eV with an energy difference of 19.8 eV, which can be indexed respectively to the 2p3/2 and 2p1/2 spin–orbit states in CuO, indicating that Cu species are mainly in +2 oxidation states in both samples. The high-resolution O 1s spectra in Fig. 2D can be fairly fitted into three peaks at about 529.6, 531.3 and 533.6 eV, ascribed to the lattice oxygen, oxygen vacancy and absorbed water molecule, respectively.33,34 By contrast, the integral peak area for the oxygen vacancies of Vo-rich CuO is obviously larger than that of Vo-poor CuO, revealing a higher quantity of oxygen vacancies in the Vo-rich CuO sample. Furthermore, electron paramagnetic resonance (EPR) was performed to reconfirm the presence of oxygen vacancies. As shown in Fig. 2E, the signal intensity of oxygen vacancies (g = 2.004) in Vo-rich CuO is evidently stronger than that in Vo-poor CuO, verifying that Vo-rich CuO possesses a higher quantity of oxygen vacancies as compared with Vo-poor CuO. Therefore, these results consistently illustrate the successful synthesis of CuO nanorods that are rich and poor in oxygen vacancies. According to recent studies, the adsorption of amines on the catalyst surface plays a crucial role in determining its electrocatalytic BOR performance. Thus, the BA adsorption behavior on the CuO catalysts was further investigated by NH3 temperature-programmed desorption (NH3-TPD) measurements in consideration of an unequal sp3 hybridization model of the N atom in the amine group of BA (Fig. 2F). As can be seen, the desorption peaks appearing in the region of 400–600 °C for both CuO catalysts are attributed to the strongly acidic sites. Compared to Vo-poor CuO, the larger peak area for Vo-rich CuO implies more Lewis acidic sites on the catalyst. As expected, the quantity of Lewis acidic sites on the Vo-rich CuO catalyst is found to be 1.11 mmol g−1, higher than the value for the Vo-poor CuO catalyst (1.00 mmol g−1), which demonstrates that the introduction of oxygen vacancies can augment the quantity of Lewis acidic sites for the adsorption of BA molecules to ultimately boost the electro-oxidation activity.35,36
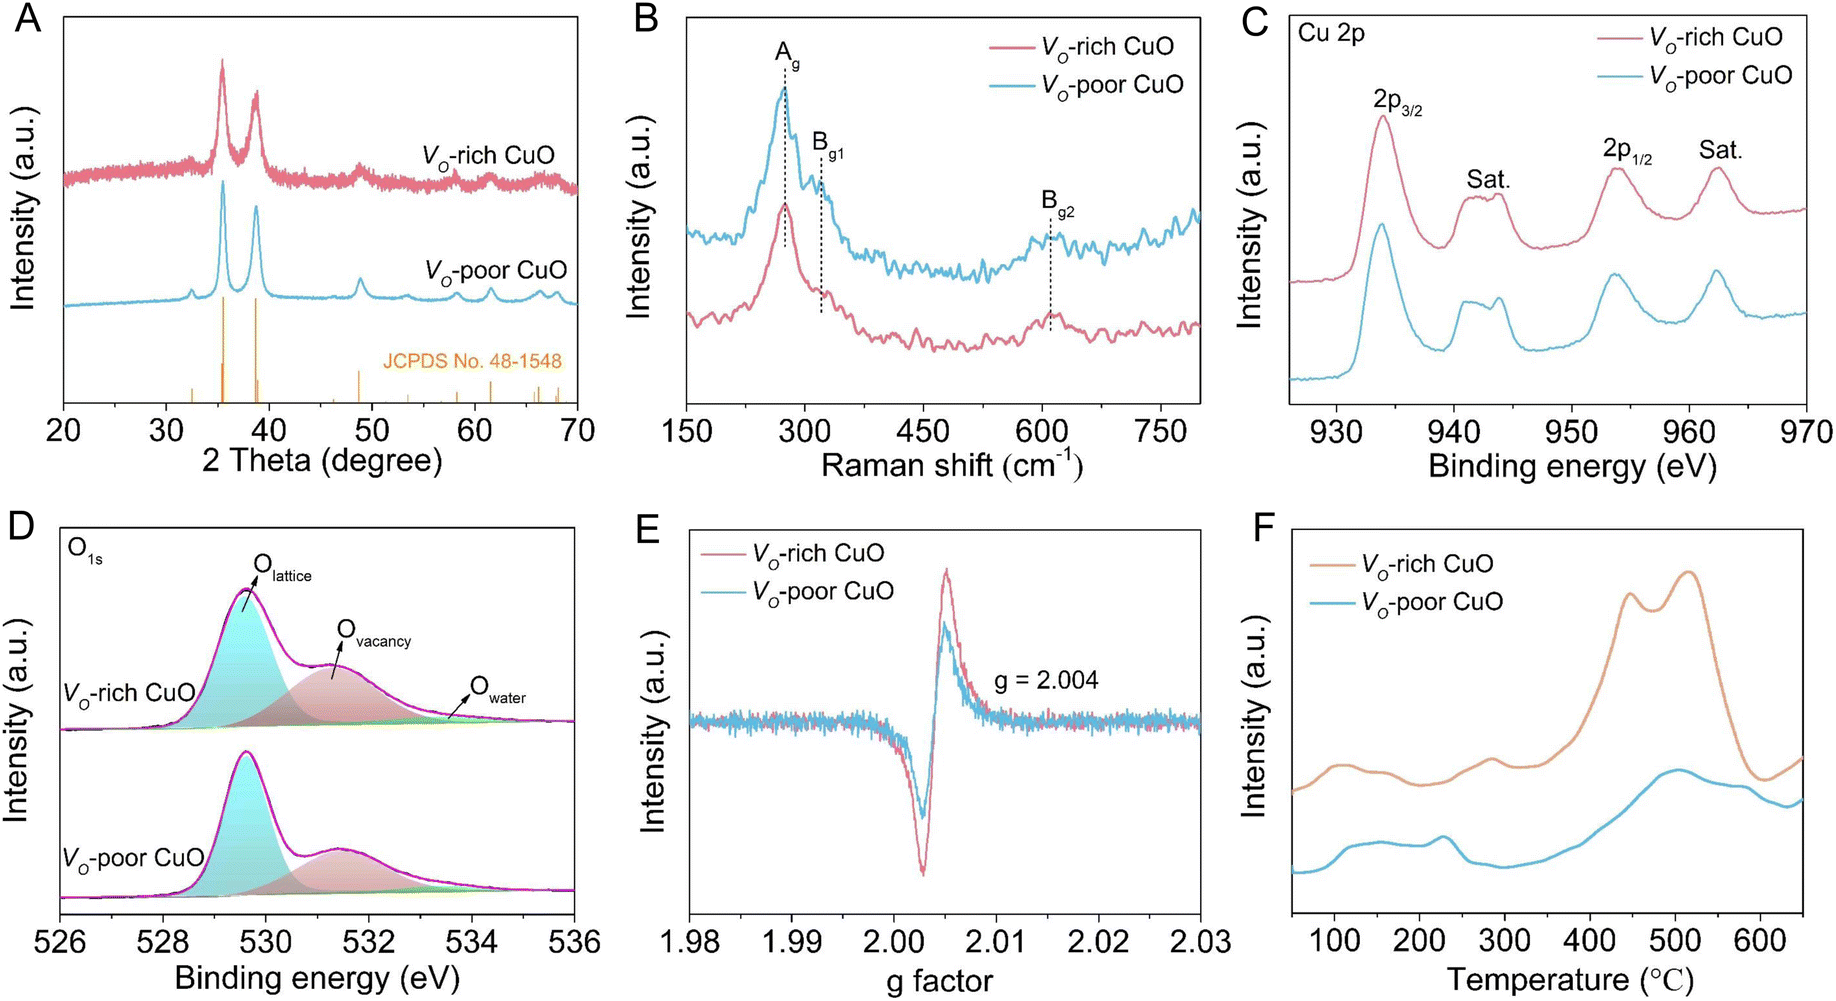 | ||
| Fig. 2 Characterization of Vo-rich and Vo-poor CuO samples. (A) XRD patterns, (B) Raman spectra, (C) Cu 2p spectra, (D) O 1s spectra, (E) EPR spectra and (F) NH3-TPD curves. | ||
To unravel the effect of oxygen vacancies on BA electro-oxidation, the electrocatalytic BOR activities of Vo-rich and Vo-poor CuO samples were evaluated in 1.0 M KOH with or without 25 mM BA using a typical three-electrode system. As shown in Fig. S4,† the linear sweep voltammetry (LSV) curves of both CuO samples exhibit negligible anodic current densities for the OER in 1.0 M KOH solution, manifesting their relatively poor electrocatalytic activities towards water oxidation. Meanwhile, the anodic current densities increase sharply after the addition of BA, indicating their excellent electrochemical response for BA oxidation. Fig. 3A displays the comparison of LSV curves for the BOR over the two CuO electrodes, showing that the Vo-rich CuO electrode achieves a superior electrochemical BOR activity relative to the Vo-poor CuO electrode, which can be further verified by the turnover frequency (TOF) in Fig. 3B. In particular, the Vo-rich CuO electrode presents a TOF value of 1.38 × 10⁻³ s−1 for the BOR, roughly 2.60 times higher than that of the Vo-poor CuO electrode (0.53 × 10⁻³ s−1) at a potential of 0.40 V vs. Ag/AgCl. Furthermore, the Tafel plots in Fig. 3C reveal that the Vo-rich CuO electrode (38.7 mV dec−1) possesses a much smaller Tafel slope compared with the Vo-poor CuO electrode (104.2 mV dec−1), which is indicative of its faster reaction kinetics for the BOR. Next, electrochemical impedance spectroscopy (EIS) was applied to probe the reaction kinetics of the CuO electrodes. The Nyquist plots (Fig. 3D and the inset) disclose that Vo-rich CuO electrode exhibits a lower charge-transfer resistance (Rct) than the Vo-poor CuO electrode, demonstrating its more efficient charge-transfer kinetics during the BOR process. Besides, the electrochemical double-layer capacitance (Cdl) was adopted to assess the electrochemical surface area (ECSA). As shown in Fig. S5† and 3E, the Cdl value of the Vo-rich CuO electrode is calculated to be 2.20 mF cm−2, which is approximately 2.39 times larger than that of the Vo-poor CuO electrode (0.92 mF cm−2), indicating the more exposed electroactive sites associated with the higher quantity of oxygen vacancies in the Vo-rich CuO catalyst. In addition, open-circuit potential (OCP) curves in Fig. 3F show that the OCP values for both CuO electrodes decrease distinctly when 25 mM BA was injected into 1 M KOH electrolyte. Compared to the Vo-poor CuO electrode, the Vo-rich CuO electrode presents a more significant OCP decline after the addition of BA, reflecting the stronger chemisorption of BA molecules on the catalyst surface,37,38 which is in good accordance with the NH3-TPD result. All of these electrochemical analyses and measurements undoubtedly shed light on the positive role of oxygen vacancies in promoting the electrocatalytic BOR process.
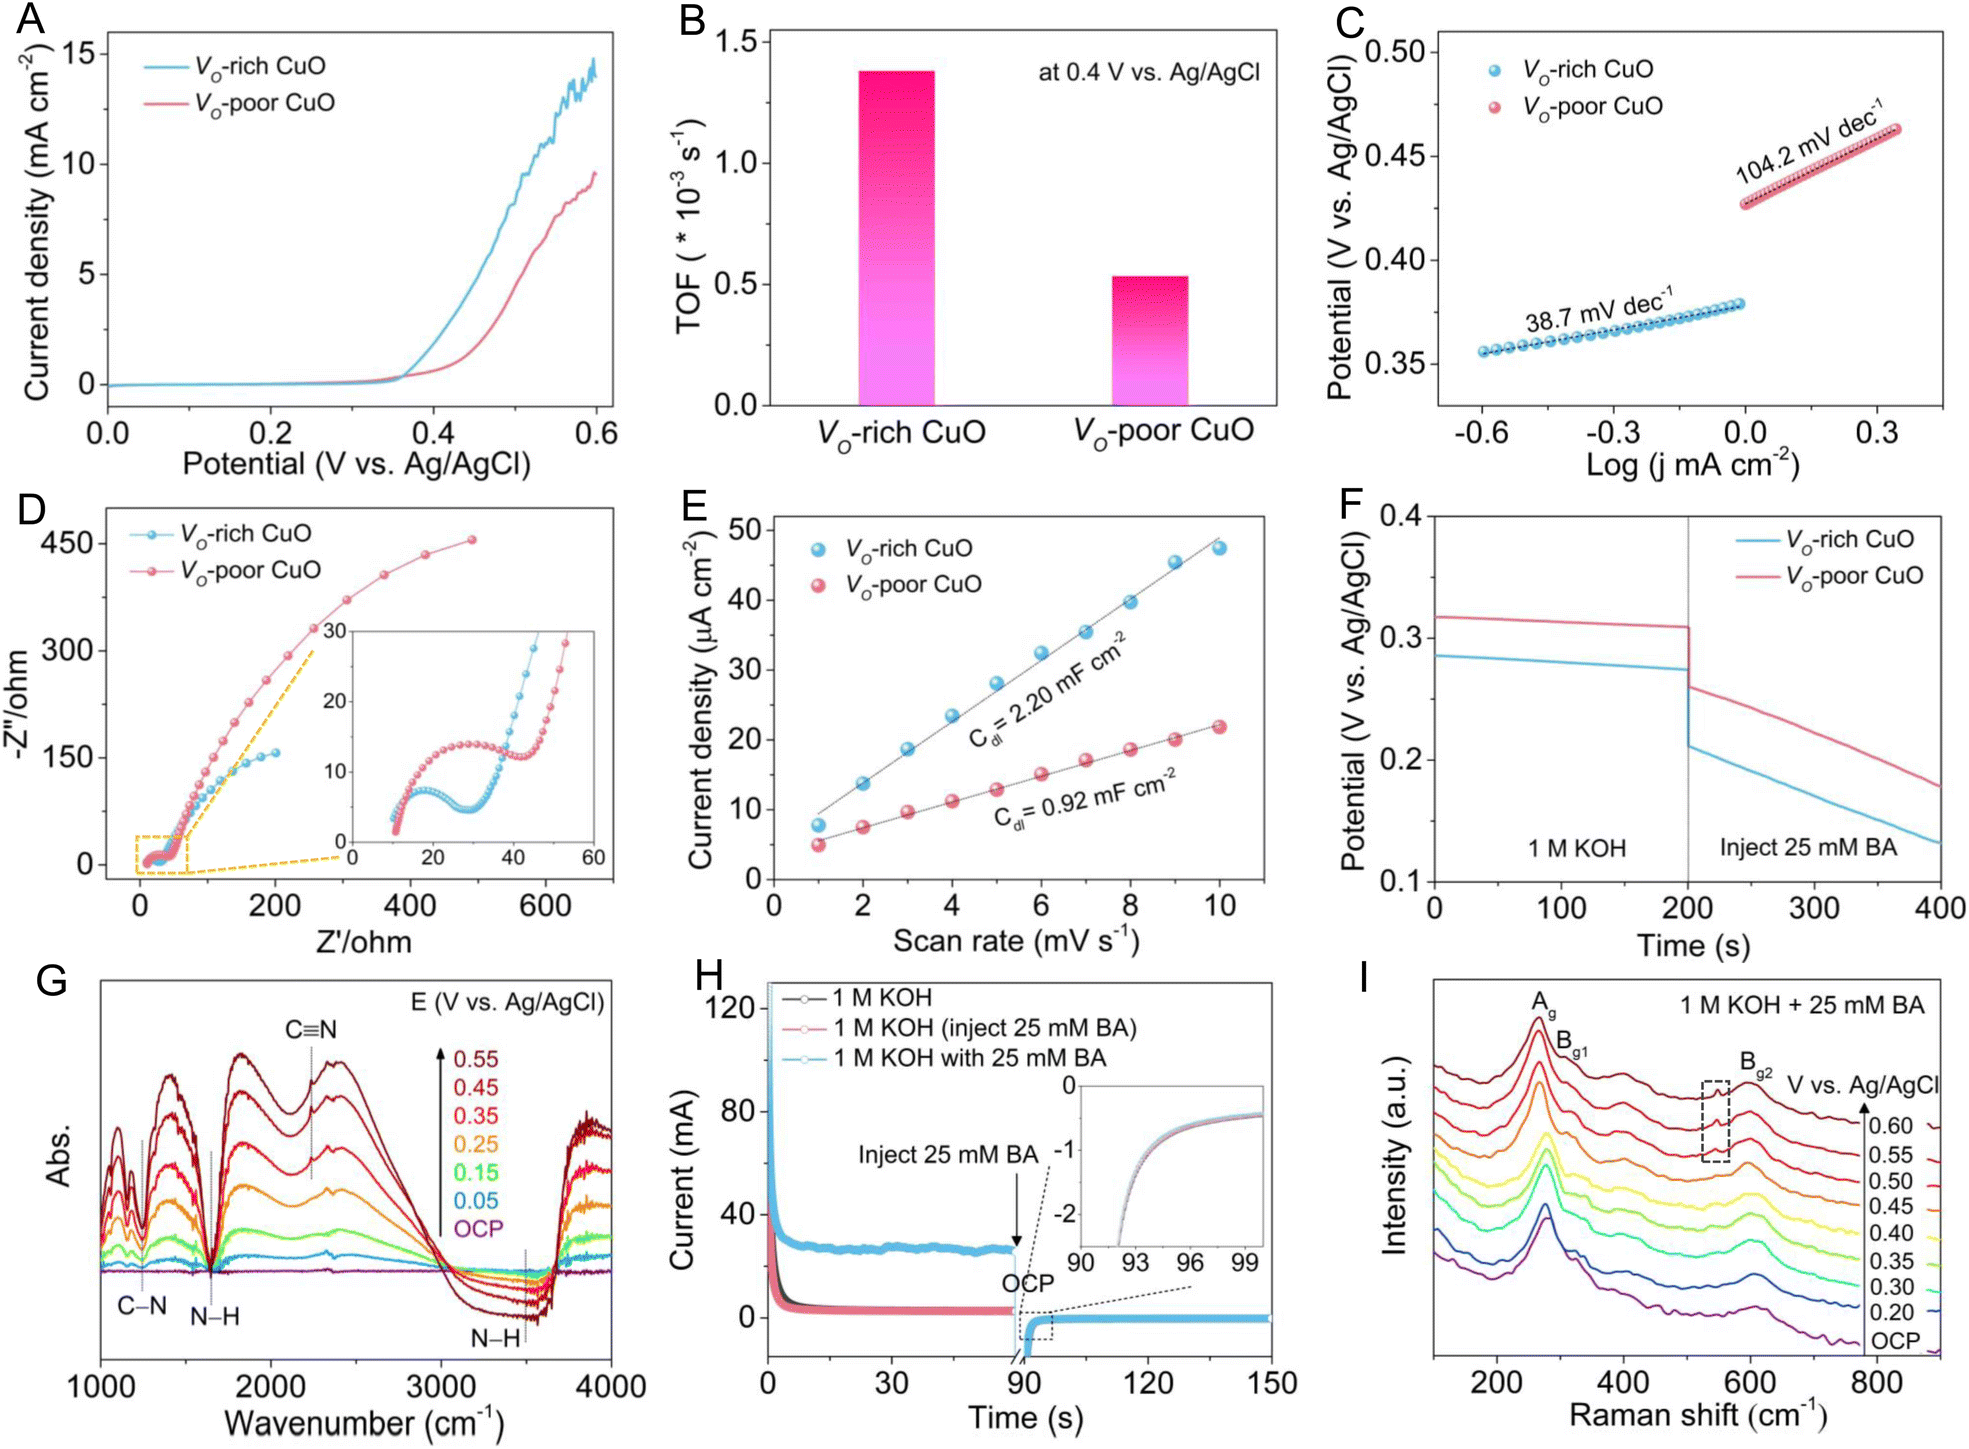 | ||
| Fig. 3 (A) LSV curves, (B) the corresponding TOF values and (C) Tafel plots, and (D) Nyquist plots ((inset): enlargement) of Vo-rich and Vo-poor CuO samples in 1.0 M KOH solution with 25 mM BA. (E) The estimated Cdl values of Vo-rich and Vo-poor CuO samples in 1.0 M KOH electrolyte. (F) OCP curves for the Vo-rich CuO sample obtained before and after the injection of 25 mM BA in 1.0 M KOH solution. (G) Potential-dependent in situ FT-IR spectroscopy of the Vo-rich CuO sample in 1.0 M KOH electrolyte with 25 mM BA. (H) STEP curves ((inset): enlargement) recorded on the Vo-rich CuO/CF electrode. (I) In situ Raman spectra of the Vo-rich CuO sample at different potentials in 1.0 M KOH electrolyte with 25 mM BA. | ||
To acquire atomic-level insights into the electrochemical oxidation of BA to BN, potential-dependent in situ Fourier transform infrared (FT-IR) spectroscopy was implemented to monitor the evolution of intermediates and products over the Vo-rich CuO electrode. As displayed in Fig. 3G, a broad adsorption peaks at around 3495 cm−1 can be ascribed to the stretching vibration of the N–H bond in the physically adsorbed BA molecule, while the peak at around 1645 cm−1 belongs to the bending vibration of the N–H bond in the chemically adsorbed BA molecule. Evidently, both of the two peaks gradually become more negative as the applied potential increases, uncovering the increasing consumption of BA. Notably, with the increase of potential, the more negative adsorption peak at about 1240 cm−1 and the more positive adsorption peak at about 2235 cm−1 can be assigned to the stretching vibration of the C–N bond and C![[triple bond, length as m-dash]](https://www.rsc.org/images/entities/char_e002.gif) N bond, respectively, which is indicative of the complete dehydrogenation of the amine group to the nitrile group.37,39 These results clearly validate the electrochemical conversion of BA to BN through a simple dehydrogenation reaction pathway on the Vo-rich CuO electrode. As reported before, either the chemisorbed hydroxyl species (OH*) or surface-reconstructed oxyhydroxides on metal oxides can serve as electroactive species for catalyzing nucleophile electro-oxidation.40,41 In this regard, multi-potential step (STEP) measurements on the Vo-rich CuO/CF electrode were performed to clarify the electro-oxidation mechanism for the BOR. As shown in Fig. 3F, the first stage is to form CuOOH via surface reconstruction of CuO at 0.60 V vs. Ag/AgCl. After that, 25 mM BA was instantly injected into the electrolyte once the OCP period started. And the third stage at 0.20 V vs. Ag/AgCl is to survey the possible reaction between CuOOH and BA. Upon the injection of BA, only inappreciable differences in current responses in the third step can be identified as compared to the STEP curve in 1.0 M KOH, demonstrating that the CuOOH reduction and the BA oxidation are not spontaneous.22,38,42 Thus, it is reasonably speculated that the BOR pathway involves a direct oxidation mechanism relevant to the as-adsorbed OH*, rather than an indirect oxidation mechanism relying on the formation of the CuOOH phase over the Vo-rich CuO/CF electrode. To deeply elucidate the BOR activity origin for the CuO catalyst, in situ Raman spectroscopy was conducted to trace the variations in the surface structure of Vo-rich CuO during the electrochemical BOR process. As shown in Fig. 3G, the Raman peaks at around 268, 310 and 601 cm−1 are ascribed to the Ag, Bg1 and Bg2 modes of CuO, respectively, agreeing well with the aforementioned Raman analysis. It should be noted that no obvious additional peak can be detected until the potential exceeds 0.50 V vs. Ag/AgCl, indicating that the catalytic activity origin for BA oxidation is the electroactive OH* in the form of CuO(OH)ads intermediates, which in turn reconfirms the direct electro-oxidation mechanism for the BOR. After reaching the potential of 0.50 V vs. Ag/AgCl, a new peak appears at 545 cm−1, corresponding closely to the O–Cu–O stretching vibration of the CuOOH phase.25,43 Meanwhile, the intensity of the CuOOH peak becomes stronger with the increase of potential, revealing the gradually reinforced surface reconstruction of CuO at these potentials, which is mainly attributed to the excessive accumulation of CuO(OH)ads intermediates and the resultant phase transformation at higher potentials.41
N bond, respectively, which is indicative of the complete dehydrogenation of the amine group to the nitrile group.37,39 These results clearly validate the electrochemical conversion of BA to BN through a simple dehydrogenation reaction pathway on the Vo-rich CuO electrode. As reported before, either the chemisorbed hydroxyl species (OH*) or surface-reconstructed oxyhydroxides on metal oxides can serve as electroactive species for catalyzing nucleophile electro-oxidation.40,41 In this regard, multi-potential step (STEP) measurements on the Vo-rich CuO/CF electrode were performed to clarify the electro-oxidation mechanism for the BOR. As shown in Fig. 3F, the first stage is to form CuOOH via surface reconstruction of CuO at 0.60 V vs. Ag/AgCl. After that, 25 mM BA was instantly injected into the electrolyte once the OCP period started. And the third stage at 0.20 V vs. Ag/AgCl is to survey the possible reaction between CuOOH and BA. Upon the injection of BA, only inappreciable differences in current responses in the third step can be identified as compared to the STEP curve in 1.0 M KOH, demonstrating that the CuOOH reduction and the BA oxidation are not spontaneous.22,38,42 Thus, it is reasonably speculated that the BOR pathway involves a direct oxidation mechanism relevant to the as-adsorbed OH*, rather than an indirect oxidation mechanism relying on the formation of the CuOOH phase over the Vo-rich CuO/CF electrode. To deeply elucidate the BOR activity origin for the CuO catalyst, in situ Raman spectroscopy was conducted to trace the variations in the surface structure of Vo-rich CuO during the electrochemical BOR process. As shown in Fig. 3G, the Raman peaks at around 268, 310 and 601 cm−1 are ascribed to the Ag, Bg1 and Bg2 modes of CuO, respectively, agreeing well with the aforementioned Raman analysis. It should be noted that no obvious additional peak can be detected until the potential exceeds 0.50 V vs. Ag/AgCl, indicating that the catalytic activity origin for BA oxidation is the electroactive OH* in the form of CuO(OH)ads intermediates, which in turn reconfirms the direct electro-oxidation mechanism for the BOR. After reaching the potential of 0.50 V vs. Ag/AgCl, a new peak appears at 545 cm−1, corresponding closely to the O–Cu–O stretching vibration of the CuOOH phase.25,43 Meanwhile, the intensity of the CuOOH peak becomes stronger with the increase of potential, revealing the gradually reinforced surface reconstruction of CuO at these potentials, which is mainly attributed to the excessive accumulation of CuO(OH)ads intermediates and the resultant phase transformation at higher potentials.41
To expound the important role of oxygen vacancies in boosting the electrochemical BOR process, density functional theory (DFT) calculations were carried out by utilizing Vo-CuO and Vo-free CuO as catalyst models (Fig. S8†). As shown in Fig. 4A and B, the calculated density of states (DOS) indicates that the presence of oxygen vacancies has a prominent influence on the electronic structure of semiconducting CuO. In detail, Vo-CuO possesses a much lower band gap of 0.41 eV with respect to Vo-free CuO (0.94 eV), revealing an easier electron transition from the valence band to the conduction band of the CuO catalyst and thereby enhanced charge transfer ability upon the incorporation of oxygen vacancies. Moreover, the d-band center, as a representative descriptor for the electrocatalytic properties of 3d transition metals,20,44 was found to be −5.08 eV for Vo-CuO, which is closer to the Fermi level as compared to that of Vo-free CuO (−5.40 eV). This is largely conducive to the adsorption of reaction intermediates, especially for electroactive OH*, thus leading to improved catalytic kinetics for BA oxidation. Generally, the chemisorption of OH− species onto the CuO surface is an essential procedure to generate reactive OH* in the nucleophile electro-oxidation reaction.38,41,42 As displayed in Fig. 4C and Table S1,† the introduction of oxygen vacancies can effectively decrease the adsorption energy of OH* from the Vo-free CuO (−0.57 eV) surface to the Vo-CuO (−0.85 eV) surface, indicating the more favorable generation kinetics of active OH* species on the Vo-CuO surface. Furthermore, the lower adsorption energy (Fig. 4C and Table S2†) of the BA molecule onto the Vo-CuO surface (−1.51 eV) demonstrates optimized BA adsorption behavior upon the incorporation of oxygen vacancies into CuO (−0.83 eV), which matches well with the OCP curves and NH3-TPD results. Moreover, the desorption energies of the as-formed BN molecule from the catalyst surface were also calculated to highlight the effect of oxygen vacancies on the BOR performance. As shown in Fig. 4D and Table S3,† the BN desorption energy on the Vo-CuO surface is found to be 0.23 eV, obviously smaller than that on Vo-free CuO (0.44 eV), meaning that newly formed BN molecules can be more rapidly desorbed from the Vo-CuO surface, which is beneficial for refreshing active sites and thus enhancing the overall catalytic efficiency for BN generation. Notably, the overall BOR routes for Vo-free CuO and Vo-CuO catalysts were also simulated by DFT calculations and the corresponding results are listed in Tables S4 and S5.† The calculated dehydrogenation pathways of BA into BN (Fig. 4E, S9 and S10†) demonstrate that the energy barrier of the rate-determining step on Vo-CuO is 1.40 eV, much smaller than that on Vo-free CuO (1.78 eV), indicating that the presence of oxygen vacancies could markedly reduce the energy barrier for intermediate generation during the dehydrogenation process. All the DFT results consistently shed light on the positive effects of oxygen vacancies on BA electro-oxidation, which can be responsible for the enhanced electrochemical BOR activity.
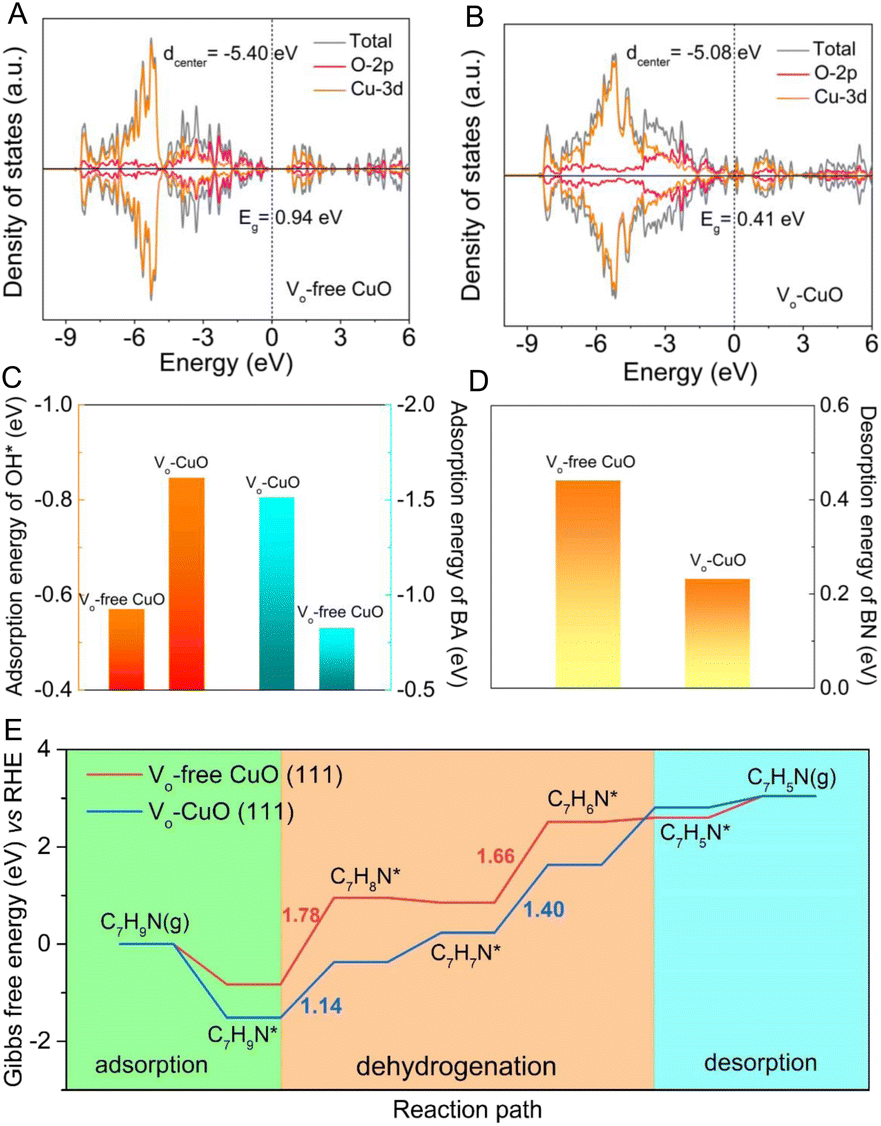 | ||
| Fig. 4 The calculated density of states of (A) Vo-free CuO and (B) Vo-CuO. (C) The adsorption energies of OH* and BA onto Vo-free CuO (111) and Vo-CuO (111) surfaces. (D) The calculated desorption energies of BN from Vo-free CuO (111) and Vo-CuO (111) surfaces. (E) The calculated energy profiles of the BOR process on Vo-free CuO (111) and Vo-CuO (111) surfaces. | ||
Considering the positive role of oxygen vacancies in electro-oxidation of BA to BN, the electrocatalytic BOR performance of the Vo-rich CuO/CF electrode was also measured in a standard three-electrode system. As revealed by the LSV curves in Fig. 5A, the anodic current presents a significant surge from around 0.35 V vs. Ag/AgCl after adding 25 mM BA into 1 M KOH electrolyte, suggesting the high-efficiency electrochemical conversion of BA to BN. Subsequently, chronoamperometry tests at different potentials were carried out to explore the potential-dependent products of BA oxidation (Table S6†). In this case, the collected oxidation products were qualitatively and quantitatively analyzed with a gas chromatography-mass spectrometer (GC-MS). As elaborated in Fig. 5B and S11,† BN is the dominant oxidation product and the calculated faradaic efficiencies (FEs) of BN production are over 80% in a wide potential range from 0.35 to 0.55 V vs. Ag/AgCl, which can reach up to 93.82% at 0.40 V vs. Ag/AgCl, highlighting the high selectivity towards electrochemical BN production on the Vo-rich CuO/CF electrode (as compared with recently reported Ni-based catalysts shown in Table S7†). As an essential parameter for evaluating excellent electrocatalysts, the long-term stability of the Vo-rich CuO/CF electrode was investigated by cyclic chronoamperometry tests at a constant potential of 0.40 V vs. Ag/AgCl in 1 M KOH containing 25 mM BA, during which fresh electrolyte was injected into the anodic cell after each cycle. Fig. 5C shows that the anodic current exhibits an appreciable decrease after every electrolysis cycle, mainly due to the consumption of BA in electrolyte, which can be basically recovered by replacing it with fresh electrolyte. Of note, the Vo-rich CuO/CF electrode shows negligible decline in current even undergoing six successive cycling tests, demonstrating its good electrochemical stability for the BOR. Also, the TEM image and XRD pattern as well as XPS results after the six cycling tests conformably substantiate the admirable durability for BA oxidation (Fig. S6†). Furthermore, as illustrated in Fig. 5D, a two-electrode electrolyzer was constructed by adopting the Vo-rich CuO/CF electrode as the anode and the previously reported NiSe nanoarray on nickel foam (Fig. S7†) as the cathode to achieve BN production, simultaneously facilitating H2 evolution. As shown in Fig. 5E, compared to the LSV curves in the absence of BA, conspicuous enhancements in both anodic and cathodic currents can be observed after the addition of 25 mM BA, which reveals that coupling BA oxidation with the HER is indeed an effective route to dramatically lower the electrolysis voltage for H2 generation. Besides, a chronoamperometry test was implemented at various voltages to produce H2 and BN over the CuO ‖ NiSe electrolyzer. Impressively, Fig. 5F shows that the calculated FEs for H2 generation are almost 100% in the voltage range of 1.55 to 1.70 V. Meanwhile for BN formation, the FEs were determined to be about 84.50%, 85.34%, 85.65% and 74.78% at the voltages of 1.55, 1.60, 1.65 and 1.70 V, respectively. These results clearly manifest the remarkable electrocatalytic performance for BN and H2 generation in a two-electrode configuration, indicating its potential practical availability in production. In addition, as displayed in Fig. S12,† the resulting BN product possesses hydrophobic features and can be easily separated from the electrolyte using oil–water separation membranes.45
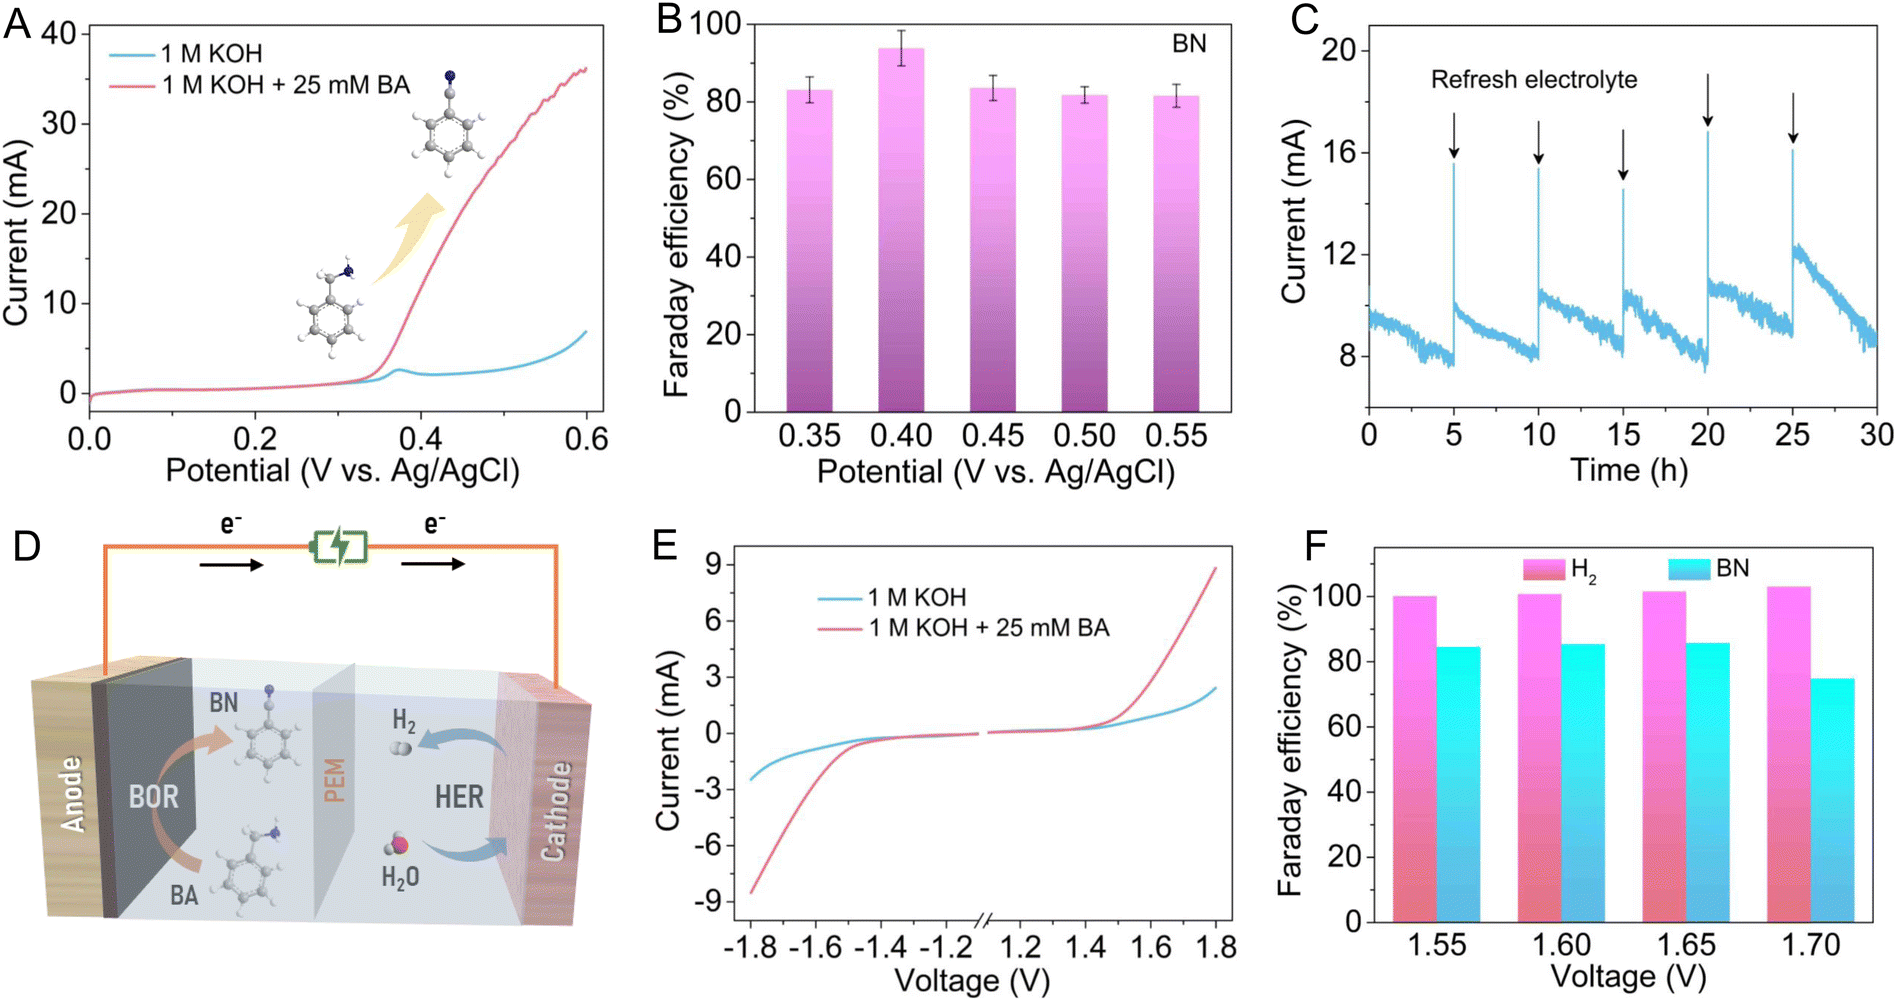 | ||
| Fig. 5 (A) LSV curves of the Vo-rich CuO electrode recorded at a scan rate of 5 mV s−1 in 1.0 M KOH solution with and without 25 mM BA. (B) The calculated FEs towards BN production at various potentials. (C) The successive chronoamperometry test at 0.40 V vs. Ag/AgCl. (D) Schematic illustration of the electrochemical conversion of BA into BN coupled with H2 production in a two-electrode electrolyzer. (E) LSV curves of the CuO ‖ NiSe electrolyzer at a scan rate of 5 mV s−1 in 1.0 M KOH solution with and without 25 mM BA. (F) The FEs for H2 and BN production at different voltages over the CuO ‖ NiSe electrolyzer. | ||
Conclusions
In summary, we reported a self-supported Vo-rich CuO/CF electrode as an advanced anode for selectively converting BA into BN with a high activity and stability, accompanying green H2 production at the cathode. The role of oxygen vacancies in the electrochemical BOR process was deeply explored by combining DFT calculations and experimental results, demonstrating that oxygen vacancies endow the CuO catalyst with enhanced adsorption capacity towards both OH* and BA molecules and consequentially optimized BOR kinetics. In situ infrared spectroscopy confirms the electrochemical dehydrogenation process from BA to BN on Vo-rich CuO. In situ Raman spectroscopy reveals that the BOR activity origin is reactive OH* in the form of CuO(OH)ads intermediates, highlighting a direct electro-oxidation pathway on Vo-rich CuO. Owing to the synergistic effects of oxygen vacancies and array structures, the Vo-rich CuO/CF electrode shows considerable electrocatalytic performance towards BA selective oxidation. Impressively, the two-electrode electrolysis achieves up to 85.65% BN selectivity and nearly 100% FEs for H2 production by applying Vo-rich CuO/CF and NiSe electrodes as the anode and cathode, respectively.Experimental
Material
All reagents were of analytical reagent grade, purchased from Sinopharm Chemical Reagent Co., Ltd, and used as received without further purification.Pretreatment of copper foam (CF)
A piece of CF (3 cm × 2 cm × 0.1 mm) was in turn treated by ultrasonication with acetone, 3 M HCl aqueous solution, deionized water and anhydrous ethanol for 15, 60, 5 and 5 min, respectively. Then, the cleaned CF was dried in air at 65 °C.Synthesis of Vo-rich CuO nanorod arrays on CF
Firstly, the Cu(OH)2 precursor on CF was fabricated through a modified method reported previously.46 Typically, 40 mmol sodium hydroxide and 2 mmol ammonium persulfate were sequentially dissolved in 15 mL deionized water with continuous stirring to form a transparent solution. After that, cleaned CF was completely immersed into the above solution for 30 min under ambient conditions. Then, the as-prepared Cu(OH)2 precursor on CF was rinsed with deionized water and anhydrous ethanol several times, and dried at 65 °C in air. Ultimately, Vo-rich CuO nanorod arrays on CF were prepared by a fast annealing of the Cu(OH)2 precursor on CF at 250 °C for 10 min under an Ar atmosphere.Synthesis of Vo-poor CuO nanorods
Vo-rich CuO nanorods were scratched from CF by ultrasonication and then calcined in air at 350 °C for 2 hours with a heating rate of 5 °C min−1 to synthesize Vo-poor CuO nanorods.Synthesis of NiSe nanorod arrays on nickel foam (NF)
According to the literature,12 50 mg of selenium powder, 3 mL of deionized water, 2 mL of ethylenediamine and a piece of freshly cleaned NF (3 cm × 1 cm × 0.1 cm) were added to a 20 mL autoclave. After ultrasonication for 10 min, the autoclave was heated and kept at 180 °C for 1 h. Then, the as-prepared product on NF was washed with hydrazine hydrate, deionized water and anhydrous ethanol several times, and dried at 65 °C in air.Characterization
X-ray diffraction patterns (XRD) were acquired on a Japan Rigaku D/max-rA equipped with graphite monochromatized high-intensity Cu Kα radiation (λ = 1.54178 Å). The field-emission scanning electron microscopy (FESEM) images were obtained by using a JEOL JSM-6700F scanning electron microscope. Transmission electron microscopy (TEM) and high-resolution transmission electron microscopy (HRTEM) were carried out on a JEOL-2010 TEM at an acceleration voltage of 200 kV. X-ray photoelectron spectroscopy (XPS) was conducted on an ESCALAB MKII X-ray photoelectron spectrometer with an excitation source of Mg Kα = 1253.6 eV. Raman spectra were collected on a confocal micro-Raman spectrometer Lab-RAMARAMIS Horiba Jobin-Yvon apparatus with a laser excitation wavelength of 532 nm with appropriate filters. Electron paramagnetic resonance (EPR) spectroscopy was performed on a Bruker A300 spectrometer. An NH3 temperature-programmed desorption (NH3-TPD) experiment was carried out on a Micromeritics TP-5080D system. 60 mg of catalysts were placed in a quartz-tube reactor and then heated at 300 °C with a heating rate of 10 °C min−1 for 60 min under a pure He atmosphere. After cooling down to 50 °C, the gas atmosphere was switched to 10% NH3/He for the saturated adsorption of NH3 gas and then switched to pure He for 60 min to remove physically adsorbed NH3 gas. The thermal conductivity detector (TCD) signals were recorded with a ramp rate of 10 °C min−1 to 800 °C.In situ Fourier transformed infrared (FTIR) spectra were recorded on a Thermo Scientific Nicolet 6700 FT-IR spectrometer equipped with an attenuated total reflection (ATR) configuration using a liquid nitrogen cooled MCT-A detector. Typically, 2 mg of catalysts and 40 μL of Nafion solution (5 wt%, Sigma-Aldrich) were ultrasonically dispersed in 460 μL of water and 500 μL of ethanol solution to form a homogeneous ink. After that, 50 μL of the as-formed catalyst ink was loaded onto a smooth glassy carbon electrode (6 mm in diameter) as the working electrode that was pressed against a CaF2 crystal with a thickness of 2 mm in this test. The resolution of spectra was set to 4.0 cm−1 with 32 scans per spectrum and the angle of the incident beam was set to 60°. A saturated Ag/AgCl electrode and a graphite electrode were respectively employed as the reference electrode and the counter electrode. The data were recorded at different potentials in 1.0 M KOH containing 25 mM benzylamine after 60 s of electrolysis.
In situ Raman spectra were recorded on a confocal Raman microscope (HR Evolution, HORIBA) with a laser excitation wavelength of 532 nm. All measurements were carried out in a typical three-electrode configuration on a CHI 760E electrochemical station by using a graphite electrode as the counter electrode, a saturated Ag/AgCl electrode as the reference electrode and a glassy carbon electrode (3 mm in diameter) with catalysts as the working electrode. In brief, 4 mg of catalysts, 30 μL of 5 wt% Nafion solutions and 1 mL of water–isopropanol solution (volume ratio of 3![[thin space (1/6-em)]](https://www.rsc.org/images/entities/char_2009.gif) :1) were sonicated to form a homogeneous ink, which was then added dropwise on a clean glassy carbon electrode (5 μL of the above ink). The data were collected in 1.0 M KOH containing 25 mM benzylamine at different potentials.
:1) were sonicated to form a homogeneous ink, which was then added dropwise on a clean glassy carbon electrode (5 μL of the above ink). The data were collected in 1.0 M KOH containing 25 mM benzylamine at different potentials.
Electrochemical measurements
All of the electrochemical tests were carried out in a H-type cell by using a DuPont Nafion PFSA N115 as a proton exchange membrane (PEM) on an electrochemical workstation (CHI660B). The three-electrode system consists of a working electrode, a saturated Ag/AgCl reference electrode and a graphite rod counter electrode. For the powdery samples, 4 mg of powdery catalysts were dispersed into a mixture of Nafion solution (30 μL, 5 wt%) and water–isopropanol solution (1 mL, volume ratio of 3:1) by sonication. Then, 5 μL of the as-formed catalyst ink (about 19.4 μg of catalyst) was well dispersed onto a glassy carbon (GC) electrode (3 mm in diameter) as the working electrode. Therefore, the catalyst loading on the GC electrode is about 0.277 mg cm−2. As for the two-electrode electrolysis, Vo-rich CuO nanorod arrays on CF (1 cm × 1 cm) and NiSe nanorod arrays on NF (1 cm × 1 cm) were used as the anode and cathode, respectively. Linear sweep voltammetry (LSV) was performed in 1.0 M KOH solution with and without 25 mM benzylamine at a scan rate of 5 mV s−1. Electrochemical impedance spectroscopy (EIS) was performed in 1.0 M KOH containing 25 mM benzylamine at a potential of 0.40 V vs. Ag/AgCl. The amplitude of the used voltage was 5 mV, and the frequency range was 100 K Hz to 1 Hz. The successive chronoamperometry tests were conducted in 1.0 M KOH containing 25 mM benzylamine at a potential of 0.40 V vs. Ag/AgCl.
Data availability
The data supporting this article have been included as part of the ESI.†Author contributions
X. Yang: investigation, validation, data curation, writing – original draft. E. H. Wei: investigation, validation. Y. Dong: investigation. Y. Fan: investigation. H. T. Gao: software. X. L. Luo: resources, supervision. W. L. Yang: conceptualization, validation, data curation, resources, supervision, writing – original draft, writing – review & editing.Conflicts of interest
There are no conflicts to declare.Acknowledgements
This work was supported by the National Natural Science Foundation of China (21805149 and 21675093), the Natural Science Foundation of Shandong Province of China (ZR2018BB012 and 2015ZRB01A0D), and the Taishan Scholar Program of Shandong Province of China (ts20110829).Notes and references
- Y. Jiao, Y. Zheng, M. Jaroniec and S. Z. Qiao, Chem. Soc. Rev., 2015, 44, 2060–2086 RSC.
- G. G. Liu, P. Li, G. X. Zhao, X. Wang, J. T. Kong, H. M. Liu, H. B. Zhang, K. Chang, X. G. Meng, T. Kako and J. H. Ye, J. Am. Chem. Soc., 2016, 138, 9128–9136 CrossRef CAS PubMed.
- S. L. Zhao, Y. Wang, J. C. Dong, C. T. He, H. J. Yin, P. F. An, K. Zhao, X. F. Zhang, C. Gao, L. J. Zhang, J. W. Lv, J. X. Wang, J. Q. Zhang, A. M. Khattak, N. A. Khan, Z. X. Wei, J. Zhang, S. Q. Liu, H. J. Zhao and Z. Y. Tang, Nat. Energy, 2016, 1, 16184 CrossRef CAS.
- L. Dai, Z. N. Chen, L. X. Li, P. Q. Yin, Z. Q. Liu and H. Zhang, Adv. Mater., 2020, 32, 1906915 CrossRef CAS PubMed.
- D. J. Zhou, S. Y. Wang, Y. Jia, X. Y. Xiong, H. B. Yang, S. Liu, J. L. Tang, J. M. Zhang, D. Liu, L. R. Zheng, Y. Kuang, X. M. Sun and B. Liu, Angew. Chem., Int. Ed., 2019, 58, 736–740 CrossRef CAS PubMed.
- W. B. Wang, Y. B. Zhu, Q. L. Wen, Y. T. Wang, J. Xia, C. C. Li, M. W. Chen, Y. W. Liu, H. Q. Li, H. A. Wu and T. Y. Zhai, Adv. Mater., 2019, 31, 1900528 CrossRef PubMed.
- Y. X. Hao, D. S. Yu, S. Q. Zhu, C. H. Kuo, Y. M. Chang, L. Q. Wang, H. Y. Chen, M. H. Shao and S. J. Peng, Energy Environ. Sci., 2023, 16, 1100–1110 RSC.
- L. F. Fan, Y. X. Ji, G. X. Wang, J. X. Chen, K. Chen, X. Liu and Z. H. Wen, J. Am. Chem. Soc., 2022, 144, 7224–7235 CrossRef CAS PubMed.
- B. Zhou, Y. Y. Li, Y. Q. Zou, W. Chen, W. Zhou, M. L. Song, Y. J. Wu, Y. X. Lu, J. L. Liu, Y. Y. Wang and S. Y. Wang, Angew. Chem., Int. Ed., 2021, 60, 22908–22914 CrossRef CAS PubMed.
- C. Wang, H. L. Lu, Z. Y. Mao, C. L. Yan, G. Z. Shen and X. F. Wang, Adv. Funct. Mater., 2020, 30, 2000556 CrossRef CAS.
- Y. Wang, Y. Y. Xue, L. T. Yan, H. P. Li, Y. P. Li, E. H. Yuan, M. Li, S. N. Li and Q. G. Zhai, ACS Appl. Mater. Interfaces, 2020, 12, 24786–24795 CrossRef CAS PubMed.
- Y. Huang, X. D. Chong, C. B. Liu, Y. Liang and B. Zhang, Angew. Chem., Int. Ed., 2018, 57, 13163–13166 CrossRef CAS PubMed.
- Y. Ding, B. Q. Miao, S. N. Li, Y. C. Jiang, Y. Y. Liu, H. C. Yao and Y. Chen, Appl. Catal., B, 2020, 268, 118393 CrossRef CAS.
- K. L. Wei, X. Wang, X. L. Jiao, C. Li and D. R. Chen, Appl. Surf. Sci., 2022, 578, 152065 CrossRef CAS.
- Y. X. Sun, H. Shin, F. Y. Wang, B. L. Tian, C. W. Chiang, S. T. Liu, X. S. Li, Y. Q. Wang, L. Y. Tang, W. A. Goddard and M. N. Ding, J. Am. Chem. Soc., 2022, 144, 15185–15192 CrossRef CAS PubMed.
- J. S. Li, R. L. Wei, X. Wang, Y. Zuo, X. Han, J. Arbiol, J. Llorca, Y. Y. Yang, A. Cabot and C. H. Cui, Angew. Chem., Int. Ed., 2020, 59, 20826–20830 CrossRef CAS PubMed.
- J. Hao, J. W. Liu, D. Wu, M. X. Chen, Y. Liang, Q. Wang, L. Wang, X. Z. Fu and J. L. Luo, Appl. Catal., B, 2021, 281, 119510 CrossRef CAS.
- X. L. Chen, X. Zhong, B. W. Yuan, S. Q. Li, Y. B. Gu, Q. Q. Zhang, G. L. Zhuang, X. N. Li, S. W. Deng and J. G. Wang, Green Chem., 2019, 21, 578–588 RSC.
- H. Pang, Z. B. Yu, X. N. Qin, B. Fan, R. H. Jiang, S. Li, Y. P. Hou, W. J. Tang, M. Wang and Z. K. Shi, J. Colloid Interface Sci., 2023, 646, 503–516 CrossRef CAS PubMed.
- Y. N. Men, X. Z. Su, P. Li, Y. Tan, C. X. Ge, S. F. Jia, L. Li, J. B. Wang, G. Z. Cheng, L. Zhuang, S. L. Chen and W. Luo, J. Am. Chem. Soc., 2022, 144, 12661–12672 CrossRef CAS PubMed.
- Y. C. Feng, S. S. Long, X. Tang, Y. Sun, R. Luque, X. H. Zeng and L. Lin, Chem. Soc. Rev., 2021, 50, 6042–6093 RSC.
- Y. Wang, M. Xu, X. Wang, R. X. Ge, Y. Q. Zhu, A. Z. Li, H. Zhou, F. E. Chen, L. R. Zheng and H. H. Duan, Sci. Bull., 2023, 68, 2982–2992 CrossRef CAS PubMed.
- Y. Q. Zhang, B. Zhou, Z. X. Wei, W. Zhou, D. D. Wang, J. Tian, T. H. Wang, S. L. Zhao, J. L. Liu, L. Tao and S. Y. Wang, Adv. Mater., 2021, 33, 2104791 CrossRef CAS PubMed.
- L. Zhao, Q. J. Sun, M. Li, Y. F. Zhong, P. Q. Shen, Y. X. Lin and K. Xu, Sci. China Mater., 2023, 66, 1820–1828 CrossRef CAS.
- Z. Y. Fan, Q. Q. Yang, W. J. Zhang, H. M. Wen, H. Y. Yuan, J. He, H. G. Yang and Z. P. Chen, Nano Lett., 2023, 23, 11314–11322 CrossRef CAS.
- Z. Cheng, L. Qin, M. Q. Guo, J. A. Fan, D. K. Xu and L. S. Fan, Phys. Chem. Chem. Phys., 2016, 18, 16423–16435 RSC.
- Q. Q. Ji, L. Bi, J. T. Zhang, H. J. Cao and X. S. Zhao, Energy Environ. Sci., 2020, 13, 1408–1428 RSC.
- X. X. Wei, X. J. Wen, Y. Y. Liu, C. Chen, C. Xie, D. D. Wang, M. Y. Qiu, N. H. He, P. Zhou, W. Chen, J. Cheng, H. Z. Lin, J. F. Jia, X. Z. Fu and S. Y. Wang, J. Am. Chem. Soc., 2022, 144, 11530–11535 CrossRef CAS PubMed.
- H. Wang, D. Y. Yong, S. C. Chen, S. L. Jiang, X. D. Zhang, W. Shao, Q. Zhang, W. S. Yan, B. C. Pan and Y. Xie, J. Am. Chem. Soc., 2018, 140, 1760–1766 CrossRef CAS PubMed.
- Y. Qiao, S. Yang, X. Sun, C. Liu, Z. Liu, X. Li, L. Li, H. Liu and L. Wang, Chem. Eng. J., 2024, 481, 148703 CrossRef CAS.
- S. D. Yang, X. Guo, X. N. Li, T. Z. Wu, L. H. Zou, Z. Y. He, Q. Xu, J. J. Zheng, L. Chen, Q. Y. Wang and Z. C. Xu, Angew. Chem., Int. Ed., 2024, 63, e202317957 CrossRef CAS PubMed.
- W. Z. Z. Zhang, N. N. Zhu, L. C. Ding, Y. Hu and Z. C. Wu, Inorg. Chem., 2021, 60, 19356–19364 CrossRef CAS PubMed.
- X. H. Zhong, S. J. Liang, T. T. Yang, G. C. Zeng, Z. Q. Zhong, H. Deng, L. Zhang and X. L. Sun, ACS Nano, 2022, 16, 19210–19219 CrossRef CAS PubMed.
- H. J. Wang, Y. A. Guo, C. J. Li, H. J. Yu, K. Deng, Z. Q. Wang, X. N. Li, Y. Xu and L. Wang, ACS Appl. Mater. Interfaces, 2022, 14, 34761–34769 CrossRef CAS PubMed.
- M. K. Zhang, Y. Zou, S. Zhang and Y. Q. Qu, Inorg. Chem. Front., 2022, 9, 4899–4906 RSC.
- S. X. Bai, L. Chen, J. J. Bai, C. H. Lv, S. D. Xu, D. Zhang, H. B. Meng, C. L. Guo, H. M. Yang and C. J. Shang, Inorg. Chem. Front., 2023, 10, 4695–4701 RSC.
- L. Y. Zeng, W. B. Chen, Q. H. Zhang, S. Z. Xu, W. Y. Zhang, F. Lv, Q. Z. Huang, S. G. Wang, K. Yin, M. G. Li, Y. Yang, L. Gu and S. J. Guo, ACS Catal., 2022, 12, 11391–11401 CrossRef CAS.
- P. Zhou, X. S. Lv, S. S. Tao, J. C. Wu, H. F. Wang, X. X. Wei, T. H. Wang, B. Zhou, Y. X. Lu, T. Frauenheim, X. Z. Fu, S. Y. Wang and Y. Q. Zou, Adv. Mater., 2022, 34, 2204089 CrossRef CAS PubMed.
- W. Wang, Y. Wang, R. Yang, Q. Wen, Y. Liu, Z. Jiang, H. Li and T. Zhai, Angew. Chem., Int. Ed., 2020, 59, 16974–16981 CrossRef CAS PubMed.
- H. B. Tao, Y. H. Xu, X. Huang, J. Z. Chen, L. J. Pei, J. M. Zhang, J. G. G. Chen and B. Liu, Joule, 2019, 3, 1498–1509 CrossRef CAS.
- W. Chen, C. Xie, Y. Y. Wang, Y. Q. Zou, C. L. Dong, Y. C. Huang, Z. H. Xiao, Z. X. Wei, S. Q. Du, C. Chen, B. Zhou, J. M. Ma and S. Y. Wang, Chem, 2020, 6, 2974–2993 CAS.
- Y. Wang, Y. Q. Zhu, Z. H. Xie, S. M. Xu, M. Xu, Z. Z. Li, L. N. Ma, R. X. Ge, H. Zhou, Z. H. Li, X. G. Kong, L. R. Zheng, J. H. Zhou and H. H. Duan, ACS Catal., 2022, 12, 12432–12443 CrossRef CAS.
- Y. L. Deng, A. D. Handoko, Y. H. Du, S. B. Xi and B. S. Yeo, ACS Catal., 2016, 6, 2473–2481 CrossRef CAS.
- Z. J. Zhao, S. H. Liu, S. J. Zha, D. F. Cheng, F. Studt, G. Henkelman and J. L. Gong, Nat. Rev. Mater., 2019, 4, 792–804 CrossRef.
- Q. Ma, H. Cheng, Y. Yu, Y. Huang, Q. Lu, S. Han, J. Chen, R. Wang, A. G. Fan and H. Zhang, Small, 2017, 13, 1700391 CrossRef PubMed.
- W. X. Zhang, X. G. Wen, S. H. Yang, Y. Berta and Z. L. Wang, Adv. Mater., 2003, 15, 822 CrossRef CAS.
Footnote |
| † Electronic supplementary information (ESI) available. See DOI: https://doi.org/10.1039/d4sc01571a |
| This journal is © The Royal Society of Chemistry 2024 |