
 Open Access Article
 This Open Access Article is licensed under a Creative Commons Attribution-Non Commercial 3.0 Unported Licence
Alloying Pd with Ru enables electroreduction of nitrate to ammonia with ∼100% faradaic efficiency over a wide potential window†
Yue
Hu
ab,
Jiawei
Liu
c,
Wenyu
Luo
b,
Jinfeng
Dong
b,
Carmen
Lee
b,
Nan
Zhang
d,
Mengxin
Chen
b,
Yifan
Xu
b,
Dongshuang
Wu
b,
Mingsheng
Zhang
c,
Qiang
Zhu
 c,
Erhai
Hu
b,
Dongsheng
Geng
*e,
Lixiang
Zhong
*f and
Qingyu
Yan
*bc
c,
Erhai
Hu
b,
Dongsheng
Geng
*e,
Lixiang
Zhong
*f and
Qingyu
Yan
*bc
aSchool of Mathematics and Physics, University of Science and Technology Beijing, Beijing, 100083, China
bSchool of Materials Science and Engineering, Nanyang Technological University, 639798, Singapore. E-mail: AlexYan@ntu.edu.sg
cInstitute of Materials Research and Engineering, A*STAR, 138634, Singapore
dState Key Laboratory of Applied Organic Chemistry, Frontiers Science Center for Rare Isotopes, College of Chemistry and Chemical Engineering, Lanzhou University, Lanzhou, 730000, China
eSchool of Chemistry and Materials Science, Nanjing University of Information Science & Technology, Nanjing, 210044, China. E-mail: dgeng@nuist.edu.cn
fSchool of Physics, Beijing Institute of Technology, Beijing, 100081, China. E-mail: zhonglx@bit.edu.cn
First published on 3rd May 2024
Abstract
Electrocatalytic nitrate (NO3−) reduction reaction (eNO3−RR) to ammonia under ambient conditions is deemed a sustainable route for wastewater treatment and a promising alternative to the Haber–Bosch process. However, there is still a lack of efficient electrocatalysts to achieve high NH3 production performance at wastewater-relevant low NO3− concentrations. Herein, we report a Pd74Ru26 bimetallic nanocrystal (NC) electrocatalyst capable of exhibiting an average NH3 FE of ∼100% over a wide potential window from 0.1 to −0.3 V (vs. reversible hydrogen electrode, RHE) at a low NO3− concentration of 32.3 mM. The average NH3 yield rate at −0.3 V can reach 16.20 mg h−1 cm−2. Meanwhile, Pd74Ru26 also demonstrates excellent electrocatalytic stability for over 110 h. Experimental investigations and density functional theory (DFT) calculations suggest that the electronic structure modulation between Pd and Ru favors the optimization of NO3− transport with respect to single components. Along the *NO3 reduction pathway, the synergy between Pd and Ru can also lower the energy barrier of the rate-determining steps (RDSs) on Ru and Pd, which are the protonation of *NO2 and *NO, respectively. Finally, this unique alloying design achieves a high-level dynamic equilibrium of adsorption and coupling between *H and various nitrogen intermediates during eNO3−RR.
1. Introduction
Ammonia (NH3) not only is a key industrial feedstock for the manufacture of chemicals such as fertilizers,1 but is also deemed a promising green energy carrier due to its high energy density (4.3 kWh kg−1), zero carbon emission, and easy liquefaction.2 For a century, industrial NH3 has been mainly produced by the energy- and carbon-intensive Haber–Bosch process.3 This process consumes about 5.5 EJ of energy (≈38 GJ/tNH3) per year and emits over 450 million metric tons of carbon dioxide (≈2.9 tCO2/tNH3).4,5Electrocatalytic nitrogen (N2) reduction reaction (eNRR) and eNO3−RR using water as a proton source have been explored as appealing alternatives.6–13 They hold promise for green NH3 production due to ambient operating conditions and compatibility with intermittent renewable electricity. Among them, eNRR is hindered by the high dissociation energy (941 kJ mol−1) of the N![[triple bond, length as m-dash]](https://www.rsc.org/images/entities/char_e002.gif) N bond and poor solubility (6.8 × 10⁻⁴ M in water) of N2 in aqueous electrolytes.14,15 This leads to NH3 production being far below the targets for feasible industrial installations imposed by the US Department of Energy (DOE) (current density >300 mA cm−2, FE >90%, and yield rate >60 mg h−1 cm−2).16 Compared to N2, the more reactive NO3− has a significantly lower dissociation energy (204 kJ
N bond and poor solubility (6.8 × 10⁻⁴ M in water) of N2 in aqueous electrolytes.14,15 This leads to NH3 production being far below the targets for feasible industrial installations imposed by the US Department of Energy (DOE) (current density >300 mA cm−2, FE >90%, and yield rate >60 mg h−1 cm−2).16 Compared to N2, the more reactive NO3− has a significantly lower dissociation energy (204 kJ![[thin space (1/6-em)]](https://www.rsc.org/images/entities/char_2009.gif) mol−1 for the N
mol−1 for the N![[double bond, length as m-dash]](https://www.rsc.org/images/entities/char_e001.gif) O bond) and absolute solubility in water.10 This makes NO3− a more suitable nitrogen source for electrocatalytic NH3 synthesis. In fact, eNO3−RR has a more positive standard reduction potential (E0 = 0.69 V vs. RHE, hereafter) than eNRR (E0 = 0.093 V) in an electrolyte at pH = 14, implying more favorable thermodynamic conditions.17 Although NO3− is a downstream product of NH3 in the industry,18 the availability of environmental pollutant NO3− makes NH3 production by eNO3−RR a feasible strategy for “turning waste into wealth”. Excessive nitrogen fixation activities of human beings have led to massive amounts of NO3− being released into the environment. Therefore, various industrial and agricultural effluents rich in NO3− can be used as NO3− resources for eNO3−RR to produce NH3. However, most of the practical effluents have low NO3− concentrations, ranging from a few to tens of mM only.19,20 In this case, the bias applied to overcome the reaction kinetics of eNO3−RR to NH3 readily induces the competing hydrogen evolution reaction (HER).21 Hence, it is challenging to design electrocatalysts that can simultaneously achieve high NH3 FE and yield rate at low NO3− concentrations when driven at low potentials.
O bond) and absolute solubility in water.10 This makes NO3− a more suitable nitrogen source for electrocatalytic NH3 synthesis. In fact, eNO3−RR has a more positive standard reduction potential (E0 = 0.69 V vs. RHE, hereafter) than eNRR (E0 = 0.093 V) in an electrolyte at pH = 14, implying more favorable thermodynamic conditions.17 Although NO3− is a downstream product of NH3 in the industry,18 the availability of environmental pollutant NO3− makes NH3 production by eNO3−RR a feasible strategy for “turning waste into wealth”. Excessive nitrogen fixation activities of human beings have led to massive amounts of NO3− being released into the environment. Therefore, various industrial and agricultural effluents rich in NO3− can be used as NO3− resources for eNO3−RR to produce NH3. However, most of the practical effluents have low NO3− concentrations, ranging from a few to tens of mM only.19,20 In this case, the bias applied to overcome the reaction kinetics of eNO3−RR to NH3 readily induces the competing hydrogen evolution reaction (HER).21 Hence, it is challenging to design electrocatalysts that can simultaneously achieve high NH3 FE and yield rate at low NO3− concentrations when driven at low potentials.
eNO3−RR to NH3 needs to undergo a complex transfer and coupling of eight electrons and nine protons, involving multiple intermediates in the process.10 Apart from the competing HER, the catalytic performance is also limited by the mismatch in the kinetics of multiple conversion steps.22,23 It has been reported that the reaction pathway from eNO3−RR to NH3 can be optimized by tuning the adsorption energies of protons and key reaction intermediates.17,24–28 According to the Sabatier principle, the interaction strength between catalytic sites and reactive species needs to be moderate.29 In addition, the generation of *H (where * denotes an adsorbed species) needs to be ensured to facilitate the deoxygenation and hydrogenation steps of eNO3−RR to NH3.30 Palladium (Pd) and ruthenium (Ru) have good water dissociation ability and high coverage of *H on the surface during eNO3−RR under neutral or alkaline conditions.31–34 Although this is kinetically favorable for the competing HER, the Pd(111) facet was found to have the ability to catalyze the conversion of NO3− into NO2−,35 and Ru was found to exhibit significant activity for NO2− to NH3.36 This inspired us to alloy these two metals to tailor the geometry and electronic structure of the catalyst, which promises to optimize the adsorption of reactive species while ensuring the supply of *H.
Herein, PdRu bimetallic NCs with different Pd/Ru molar ratios were synthesized and employed as catalysts for NH3 production by eNO3−RR under alkaline conditions. Pd74Ru26 NCs exhibit the best NH3 production performance. When operating under the NO3− concentration (32.3 mM) of typical industrial wastewater, an average NH3 FE close to 100% can be obtained over a wide potential window (400 mV, from 0.1 to −0.3 V), with an average NH3 yield rate of 16.20 mg h−1 cm−2 at −0.3 V. When operating at a NO3− concentration of 100 mM, the potential window for obtaining ∼100% NH3 FE can be extended from 0.1 to −0.9 V, and the average NH3 yield rate at −0.9 V can reach 42.98 mg h−1 cm−2, approaching the DOE targets. Meanwhile, Pd74Ru26 NCs also demonstrate excellent electrocatalytic stability during consecutive electrolysis for over 110 h. Moreover, the concentration of nitrate nitrogen (NO3−–N, 451.6 µg mL−1) in a simulated industrial wastewater can be decreased to the drinkable water level after 170 min with a final NO3−-to-NH3 conversion efficiency over 90%. Experimental investigations and DFT calculations suggest that the electronic structure modulation between Pd and Ru promotes the transport of NO3−, as well as the protonation of *NO2 (RDS of Ru) and *NO (RDS of Pd).
2. Results and discussion
2.1 Synthesis and structural characterization
PdxRuy bimetallic NCs with varying Pd/Ru molar ratios (x/y) were synthesized through co-electrodepositing Pd and Ru on porous carbon fiber paper (CFP) under galvanostatic current (Fig. 1a and Methods). As control samples, Pd and Ru NCs were synthesized by monometallic electrodeposition under the same conditions (Methods). During the electroreduction process, CO2 was continuously bubbled to compete with the metals for reduction to control the morphology of PdxRuy NCs. In the case of the precursor Pd and Ru ions at a ratio of 3:1, PdRu NCs formed by electrodeposition without CO2 bubbling tend to aggregate into bulks (ESI Fig. S1†). The bubbling of CO2 broke the PdRu NCs into well-dispersed spherical particles with diameters of around 50 nm (Fig. 1b). From the transmission electron microscopy (TEM) images at higher magnification (Fig. 1c), the PdRu NCs are loosely clustered.
 | ||
| Fig. 1 Synthesis and structural characterization of Pd74Ru26 NCs. (a) Schematic diagram of the synthesis process. (b) and (c) TEM images at different magnifications. (d) XRD patterns of Ru, Pd and Pd74Ru26. (e) HRTEM image and the corresponding FFT pattern (inset) of the selected area with the red dashed square. (f) TEM-EDS elemental mapping images and (g) corresponding elemental line scan of Pd and Ru. | ||
The crystal structures of the Ru, Pd and PdxRuy NCs were further examined by X-ray diffraction (XRD), high-resolution TEM (HRTEM), and energy-dispersive spectroscopy (EDS). The XRD pattern of Ru NCs (Fig. 1d) displays five broad diffraction peaks in the range of 35 to 75°, which can be ascribed to hexagonal close-packed (hcp) Ru (PDF#06-0663). The TEM image (ESI Fig. S2a†) shows that the Ru NCs are highly agglomerated with each crystal size of about 5 nm. The observed lattice spacing of 0.214 nm can match the (002) crystal plane of hcp Ru (ESI Fig. S2b†). The corresponding fast Fourier-transform (FFT) pattern along the [0110] zone axis (ESI Fig. S2c†) further confirmed the hcp phase of Ru NCs. The three sharp diffraction peaks in the XRD pattern of Pd NCs (Fig. 1d) can be well indexed to the (111), (200) and (220) crystal planes of face-centered cubic (fcc) Pd (PDF#89-4897). The TEM image (ESI Fig. S3a†) shows that Pd NCs show a large diameter of ∼200 nm. A lattice spacing of 0.228 nm was observed in the HRTEM image (ESI Fig. S3b†), which corresponds to the (111) crystal plane of fcc Pd. In the XRD patterns of PdxRuy NCs (ESI Fig. S4†), the diffraction peaks of fcc Pd shift toward higher angles after introducing more Ru. This is due to Ru having a smaller ionic radius. Partial alloying of Pd with Ru causes the shrinkage of the lattice.37 In addition, the weak diffraction peak appearing at 44.6° in the XRD patterns (Fig. 1d and ESI Fig. S2†) can be attributed to the (101) crystal plane of hcp Ru, indicating that slight compositional segregation occurred during the alloying process.38 The shift of this peak to a higher angle is possibly due to the inherent compressive strain derived from lattice mismatch between the fcc PdxRuy and hcp Ru.39 The formation mechanism of fcc PdxRuy NCs can be inferred as Pd2+ ions with a high standard electrode potential (+0.915 V versus standard hydrogen electrode, vs. SHE)40 are preferentially reduced to fcc Pd during the electrodeposition process, and then serve as templates for the growth of Pd and Ru.41,42 The HRTEM image (Fig. 1e) of Pd74Ru26 NCs displays a lattice spacing of 0.224 nm, which is between the fcc Ru(111) interplanar spacing (0.221 nm) and the fcc Pd(111) interplanar spacing (0.228 nm). This is consistent with the XRD results. Moreover, the corresponding FFT pattern (inset of Fig. 1e) along the [011] zone axis exhibits bright diffraction points indexed to the (111) and (200) crystal planes of fcc Pd74Ru26. The TEM-EDS elemental mapping images (Fig. 1f and S5a†) and the corresponding elemental line scan (Fig. 1g), as well as scanning TEM-EDS elemental mapping images (ESI Fig. S6†) reveal an even distribution of Pd and Ru in Pd74Ru26 NCs. Likewise, a uniform distribution of Pd and Ru atoms in both Pd90Ru10 and Pd57Ru43 NCs was also observed (ESI Fig. S7a and S8a†). The Pd:Ru atomic ratio of PdxRuy NCs was determined from the EDS spectra as shown in ESI Fig. S5b, Fig. S7b and Fig. S8b.† The atomic ratios of Pd and Ru in PdxRuy bimetallic NCs were also determined by inductively coupled plasma optical emission spectroscopy (ICP-OES), and Pd:Cu atomic ratios similar to the EDS results were obtained (ESI Table S1†).
The electronic properties of Pd74Ru26 NCs were investigated by X-ray photoelectron spectroscopy (XPS). The XPS survey spectra (ESI Fig. S9†) show the existence of obvious Pd 3d, Ru 3p and Ru 3d peaks. The calculated surface Pd/Ru atomic ratio is 74.18:25.82 (ESI Table S2†) from XPS data, which is also close to the EDS result (ESI Fig. S5b†). The Pd2+ 3d peaks and Ru4+ 3p peaks in the deconvoluted Pd 3d XPS spectra (Fig. 2a) and Ru 3p XPS spectra (Fig. 2b), respectively, are due to the partial oxidation of the Pd74Ru26, Pd and Ru surfaces. In the deconvoluted Pd 3d XPS spectrum of Pd74Ru26 (upper region in Fig. 2a), the peaks located at 335.34 eV and 340.60 eV can be attributed to Pd0 3d5/2 and Pd0 3d3/2, respectively. Notably, the Pd0 3d peaks undergo a negative shift by around 0.29 eV compared with that of Pd (lower region in Fig. 2a), indicating a redistribution of the electrons between Pd and Ru after their alloying. From the deconvoluted Ru 3p XPS spectrum of Pd74Ru26 (upper region in Fig. 2b), the peaks of Ru0 3p3/2 (462.56 eV) and Ru0 3p1/2 (485.24 eV) positively shift by about 0.21 eV compared with that of Ru (lower region in Fig. 2b). Also, a ∼0.27 eV positive shift of Ru0 3d5/2 after alloying can be observed in the high-resolution Ru 3d XPS spectra (Fig. 2c), aligning with the C 1s peaks (284.8 eV). These results demonstrate an obvious electron transfer from Ru to Pd in the Pd74Ru26 NCs, which will affect the d-band centers and thus the adsorption energies of reactive species.25,43
 | ||
| Fig. 2 Analysis of the electronic properties of PdxRuy NCs. (a) The deconvoluted Pd 3d XPS spectra of Pd74Ru26 and Pd. (b) The deconvoluted Ru 3p XPS spectra of Pd74Ru26 and Ru. (c) Ru 3d XPS spectra of Pd74Ru26 and Ru. (d) Normalized Pd K-edge XANES spectra of PdxRuy and Pd foil. (e) Magnified displays of the Z1 and Z2 regions in (d). (f) FT EXAFS spectra of PdxRuy and Pd foil. (g) Normalized Ru K-edge XANES spectra of PdxRuy and Ru foil. (h) Magnified displays of the Z1 and Z2 regions in (g). (i) FT EXAFS spectra of PdxRuy and Ru foil. | ||
X-ray absorption fine structure spectroscopy (XAFS) was further performed to reveal the electronic interactions and local coordination of Pd and Ru in PdxRuy NCs. The normalized Pd K-edge X-ray absorption near-edge structure (XANES) spectra (Fig. 2d) show that the absorption near-edge position of PdxRuy NCs is very close to that of the Pd foil reference. This indicates that Pd exists in a metallic state in PdxRuy NCs. Zooming in on the Z1 and Z2 regions of Pd K-edge XANES spectra (Fig. 2e), it can be seen that the white line intensity and absorption edge energy gradually decrease with the increase of Ru ratio. This means Ru can induce electron enrichment on Pd in PdxRuy. Fig. 2f shows that the Fourier transformed (FT) extended X-ray absorption fine structure (EXAFS) spectra at the Pd K-edge of PdxRuy are similar to that of Pd foil, but with a negative shift for the main peak as the Ru ratio increases. This indicates that Ru atoms are dissolved into the Pd lattice and coordinate with Pd atoms to form Pd–Ru bonds, which affects the average distance of Pd–Pd bonds. To further know the coordination structure of PdxRuy NCs and supplement the FT-EXAFS analysis, we fitted the FT-EXAFS curves based on the fcc configuration model (ESI Fig. S10†). The curve fitting results (ESI Table S3†) reveal the scattering path of Pd–Pd/Ru in PdxRuy with a coordination number of around 10, which is evidently lower than that (12) of Pd foil. Besides, in comparison with Pd foil, the fcc PdxRuy NCs exhibit a shorter interatomic distance (RPd-Pd/Ru), which decreases as the Ru ratio increases. Fig. 2g shows a similar normalized Ru K-edge XANES spectra of the PdxRuy NCs and Ru foil reference, also indicating that Ru exists in a metallic state in PdxRuy NCs. Compared with Pd K-edge XANES spectra, the magnified displays of the Z1 and Z2 regions in Ru K-edge XANES spectra signify that the white line intensity and absorption edge energy increase with the Pd ratio in PdxRuy. This proves that the electron enrichment of Pd in PdxRuy is due to the electron transfer from Ru to Pd, which is in line with XPS results. From the FT EXAFS spectra at the Ru K-edge (Fig. 2i), the position of the main peak attributed to the Ru–M (M = Ru/Pd) scattering path shifts positively with increasing Pd ratio in PdxRuy. This further demonstrates the solid solution characteristics of Ru and Pd in PdxRuy. The impact of electron redistribution within Pd and Ru in Pd74Ru26 on water dissociation and the adsorption of reactive species will be further discussed in the mechanistic analysis section.
2.2 Electrochemical activity and kinetics analysis
The electrochemically active surface areas (ECSAs) of the Pd, Ru and Pd74Ru26 NCs were evaluated by measuring the electric double layer capacitance (Cdl). On the basis of the cyclic voltammetry (CV) curves obtained at different scan rates (ESI Fig. S11†), the Cdl for Pd, Ru and Pd74Ru26 NCs was calculated to be 99.82, 84.68 and 110.08 mF cm−2, respectively (Fig. 3a). This indicates that the spherical Pd74Ru26 NCs expose more active sites than highly agglomerated Ru NCs and large-diameter Pd NCs. Linear sweep voltammetry (LSV) tests were performed to investigate the reaction activity and kinetics of Pd, Ru and PdxRuy NCs for eNO3−RR. As shown in Fig. 3b, PdxRuy exhibit more positive onset potentials and larger current responses for eNO3−RR compared to Pd and Ru. This suggests that the alloying of Pd with Ru can effectively enhance NO3− adsorption/activation and improve the catalytic activity for eNO3−RR. The highest current density during the potential variation implies that Pd74Ru26 is the best eNO3−RR catalyst among PdxRuy. This may be due to the fact that the electronic interaction of Pd and Ru in PdxRuy is affected by the composition ratio, and this electronic modulation is directly related to its adsorption of reactants. According to the Sabatier principle,29 catalysts with moderate adsorption energy are provided with the best catalytic activity. Therefore, by optimizing the component ratio in PdxRuy, Pd74Ru26 can achieve superior eNO3−RR activity. Tafel slopes were derived from the LSV curves (Fig. 3c) to evaluate the electron transfer kinetics of Pd, Ru and PdxRuy NCs during eNO3−RR. Pd74Ru26 exhibits a Tafel slope of 188.02 mV dec−1, which is lower than that of Pd (223.19 mV dec−1) and Ru (205.09 mV dec−1). This indicates that alloying Pd and Ru in an optimized ratio can promote the electron transfer for eNO3−RR. This is supported by the smaller charge-transfer resistance (Rct) of Pd74Ru26 (0.27 Ω) compared to Ru (0.45 Ω) and Pd (1.01 Ω) during eNO3−RR, as known from electrochemical impedance spectra (EIS, Fig. 3d).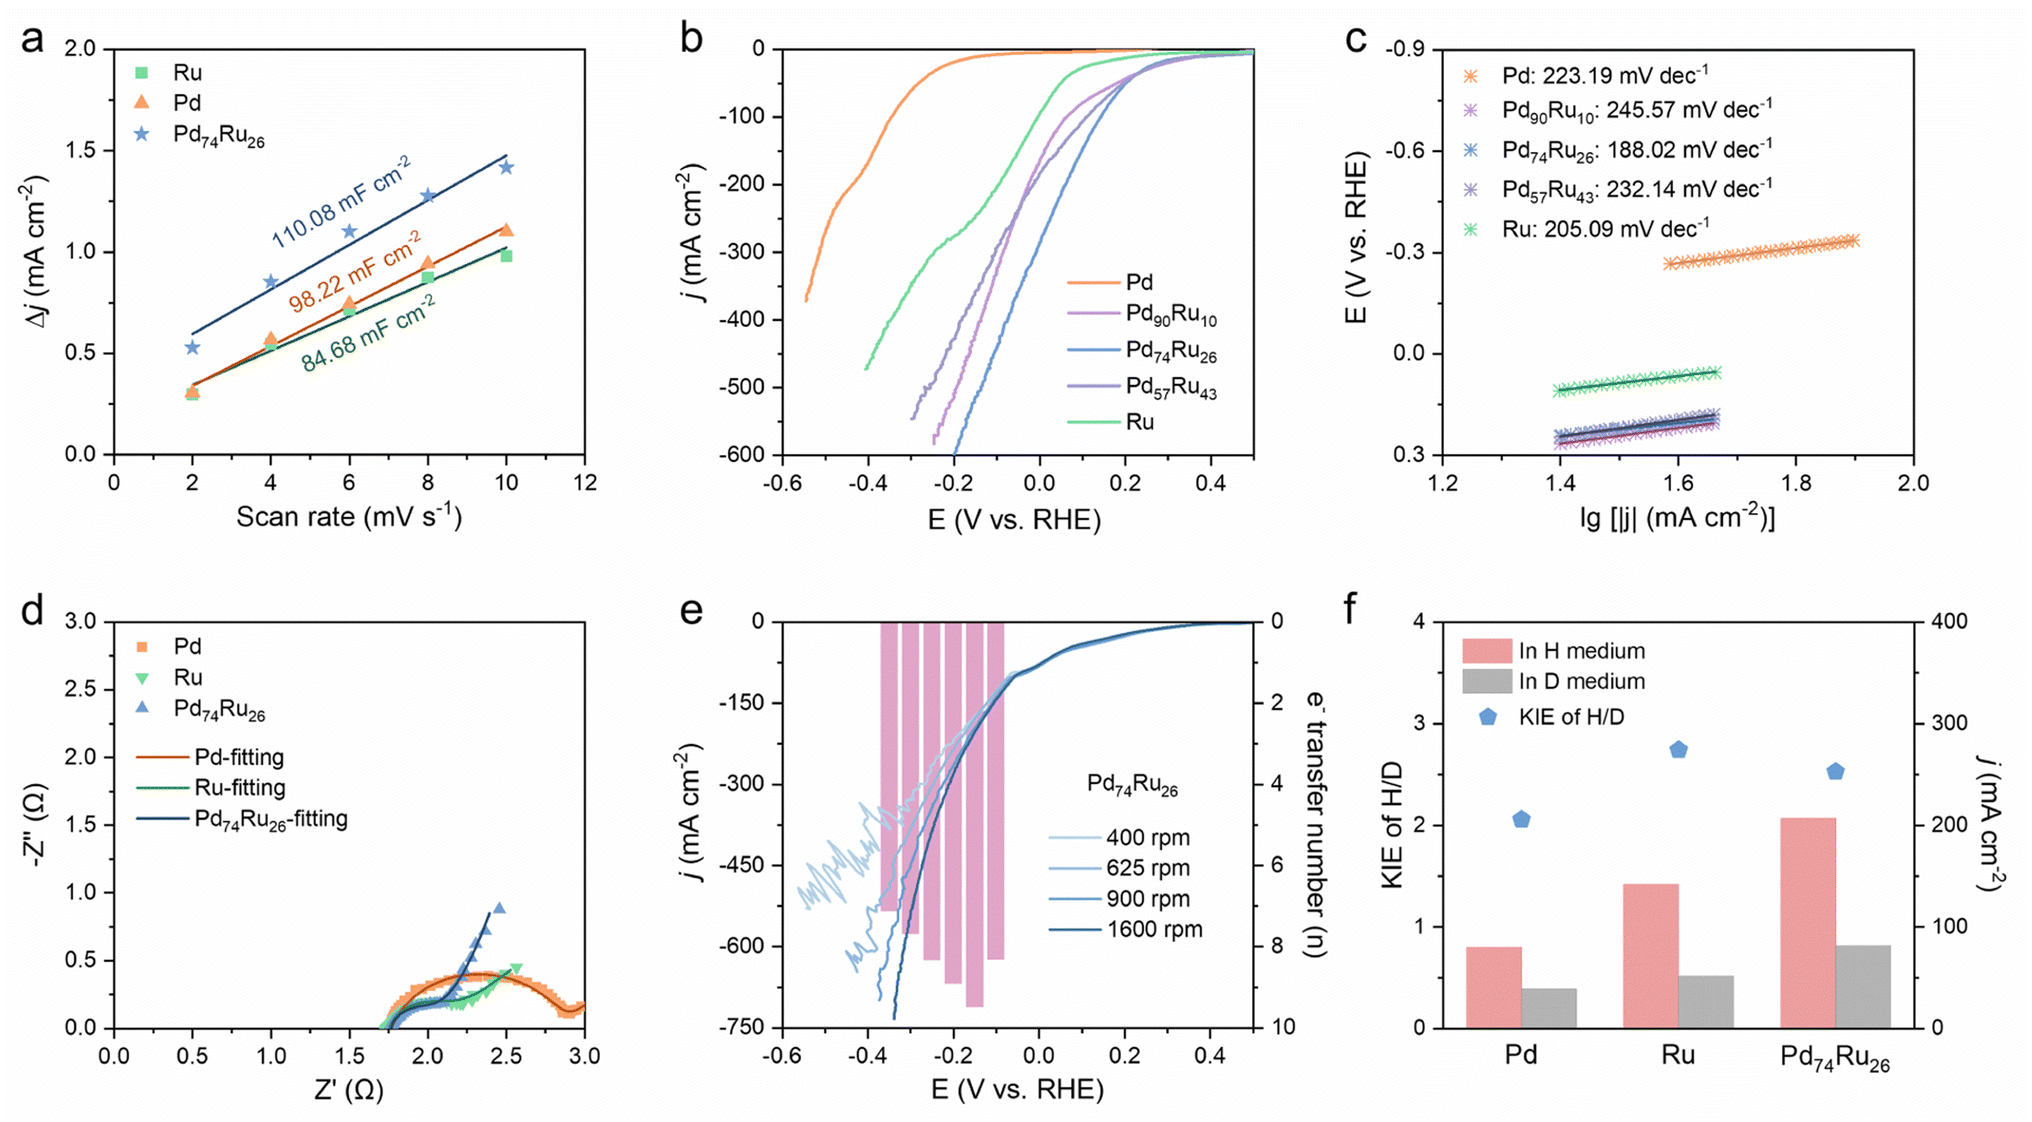 | ||
| Fig. 3 Electrochemical activity and kinetics analysis of Pd, Ru and PdxRuy NCs. (a) Calculated Cdl for Pd, Ru and Pd74Ru26 NCs. (b) LSV curves (80% iR corrected) of Pd, Ru and PdxRuy NCs in 1 M KOH with 100 mM NO3−. (c) Corresponding Tafel slopes of the LSV curves. (d) EIS of Pd at −0.3 V, Ru at 0.1 V and Pd74Ru26 at 0.2 V during eNO3−RR. (e) LSV curves (80% iR corrected) at different rotation rates in 1 M KOH with 100 mM NO3−, and corresponding electron transfer numbers at different potentials for Pd74Ru26 NCs. (f) KIE(H/D) values of Pd, Ru and Pd74Ru26 NCs estimated using the ratio of current density in a purely protic medium and a purely deuterium medium. | ||
To examine the NO3− to NH3 conversion on the catalysts, the number of transferred electrons (n) on Pd (ESI Fig. S12a†), Ru (ESI Fig. S12b†) and Pd74Ru26 (Fig. 3e) during eNO3−RR was estimated from the slopes of the Koutecký–Levich (K–L) plots (ESI Fig. S13†). For Pd, the n values from −0.4 to −0.55 V are close to 3, indicating that Pd is more prone to the 2-electron transfer reaction from NO3− to NO2−. Unlike Pd, the n values of Ru in the potential interval of −0.1 to −0.35 V are >5. This signifies that the steps involving multi-electron (compared to 2-electron) transfer in eNO3−RR can occur on Ru, which is conducive to the generation of the final product NH3. After alloying Pd and Ru to Pd74Ru26, direct 8-electron transfer processes are seen over the potential range between −0.1 and −0.35 V. This suggests that the direct reduction of NO3− to NH3 occurs readily over Pd74Ru26. Additionally, a quasi-first-order reaction kinetics relationship between current density and NO3− concentration on Pd74Ru26 at −0.1 V is obtained (ESI Fig. S14†). This indicates that eNO3−RR on Pd74Ru26 driven by this potential is only related to the adsorption of NO3−, and is not subject to the kinetic constraints of the intermediate reaction steps.
To explore the *H usage capability of the catalysts during eNO3−RR, the proton transfer rate was evaluated through the kinetic isotope effect (KIE) of H/D (KIEH/D) (ESI Fig. S15†).28,30 As shown in Fig. 3f, the KIEH/D values of Pd at −0.3 V, Ru at 0 V and Pd74Ru26 at 0 V are 2.06, 2.74 and 2.52, respectively. They all refer to the primary kinetic isotope effect, suggesting that the rate-determining step (RDS) of eNO3−RR involves breaking the H–OH bond of H2O and coupling *H with nitrogen intermediates.27 The lowest KIEH/D value of Pd indicates that it has the optimum water dissociation and *H consumption rates, but is driven at a more negative potential. At 0 V, the lower KIEH/D value of Pd74Ru26 compared to Ru demonstrates that the *H transfer kinetics associated with the RDS of eNO3−RR is improved. Combined with the analysis of K–L plots, it can be deduced that alloying Pd with Ru in a reasonable ratio can optimize the adsorption/coupling of protons and nitrogen intermediates to a high level of dynamic equilibrium.
2.3 Performance of eNO3−RR
The performance of eNO3−RR to NH3 on Pd, Ru and Pd74Ru26 NCs was first evaluated at an industrial wastewater-relevant NO3− concentration of 32.3 mM (2000 ppm)44,45 under ambient conditions using a standard three-electrode H-type cell (Methods). LSV curves of Pd, Ru and Pd74Ru26 NCs (Fig. 4a) preliminarily show that they all have eNO3−RR activity, as reflected by the positively shifted onset potentials and increased current densities after adding NO3−. The lowest onset potential of 0.3 V and the maximum increase in current density indicate an optimized eNO3−RR activity of Pd74Ru26 NCs as compared to the other two samples. To further determine the contribution of eNO3−RR activity to NH3 production, we performed 1 h potentiostatic eNO3−RR on Pd, Ru and Pd74Ru26 at different applied potentials, respectively (ESI Fig. S16†). The average FE (Fig. 4b) of the main products NO2− and NH3 was then calculated by detecting the remaining NO3− as well as NO2− and NH3 in the post-reaction electrolyte. NOx− (NO3− and NO2−) and NH3 were quantitatively determined by ultraviolet-visible (UV-vis) spectrophotometry and ion chromatography with calibration curves, respectively (ESI Fig. S17 and S18†). As shown in Fig. 4b, both Pd74Ru26 and Ru showed high NH3 FE over 98% at a positive applied potential of 0.1 V, while Pd has no eNO3−RR activity yet. The NH3 yield rate of Pd74Ru26 is 4.4 mg h−1 cm−2, which is almost 3 times that of Ru (Fig. 4c). Despite the satisfactory NH3 FE of Pd74Ru26 and Ru, their NH3 yield rates are well below the DOE targets of >60 mg h−1 cm−2.16 Hence, the NH3 production performance of these three catalysts at more negative potentials was further analyzed. Pd exhibits ∼66% NH3 FE at tested potentials from −0.3 to −0.5 V, all accompanied by a considerable NO2− FE of ∼20% (Fig. 4b). This suggests that Pd has good NO3− to NO2− conversion ability, but the kinetics of *NO2− hydrogenation to *NH3 is weak, leading to an accumulation of NO2−. The average NH3 FE of Ru decreases from 98.2% at 0.1 V to 60.5% at −0.5 V as the potential shifts negatively. At −0.5 V, the negligible NO2− FE and the observed substantial bubble generation during the reaction indicate that the main competition for the reduction of NO3− to NH3 on Ru is the HER. For Pd74Ru26, an average NH3 FE close to 100% is obtained over a wide potential window from 0.1 to −0.3 V, signifying a near-complete conversion of participating NO3− to NH3 during the 1 h eNO3−RR process. At −0.3 V, the average NH3 yield rate and jNH3 of Pd74Ru26 reach respectively 16.2 mg h−1 cm−2 and 208.0 mA cm−2, which are 7.2 and 9.1 times higher than those of Pd (Fig. 4c and d). Although Ru shows a relatively high NH3 FE of 89.7% at −0.3 V, the average NH3 yield rate and jNH3 are only 11.8 mg h−1 cm−2 and 152.4 mA cm−2 (Fig. 4c and d). The difference in NH3 production performance between Ru and Pd74Ru26 becomes increasingly prominent with the negative shift of potential. At −0.5 V, the average NH3 FE, NH3 yield rate and jNH3 of Pd74Ru26 are respectively 91.6%, 20.6 mg h−1 cm−2 and 261.0 mA cm−2, which are about 1.5, 1.7 and 1.7 times those of Ru. These results demonstrate a good synergistic catalytic behavior of Pd and Ru in Pd74Ru26 for NH3 production by eNO3−RR. To unveil the intrinsic activity of the catalysts, we normalized the current density by the ECSA (ESI Table S4†). Although Pd74Ru26 and Ru present similar ECSA-normalized total current density curves (ESI Fig. S19a†), Pd74Ru26 shows the largest ECSA-normalized jNH3 at each potential (ESI Fig. S19b†). This indicates that alloying Pd and Ru to Pd74Ru26 synergistically promotes the intrinsic activity of eNO3−RR to NH3. | ||
| Fig. 4 Performance of eNO3−RR. LSV curves of Pd, Ru and Pd74Ru26 NCs in 1 M KOH with/without 32.3 mM NO3− (a), and the corresponding NH3 and NO2− FE (b), NH3 yield rate (c), and jNH3 (d) in 1 M KOH with 32.3 mM NO3−. (e) 1H NMR spectra of electrolytes after eNO3−RR without NO3−, with 32.3 mM 14NO3−, and with 32.3 mM 15NO3− sources, respectively. (f) Time-dependent concentration of NO3−–N, NH3–N, and NO2−–N and corresponding NH3 FE for eNO3−RR using Pd74Ru26 NCs at −0.3 V in simulated industrial wastewater containing 1 M KOH and 32.3 mM NO3−. NH3 FE and yield rate (g) as well as jNH3 and LSV curve (h) of Pd74Ru26 NCs in 1 M KOH with 100 mM NO3−. (i) Long-term CP stability test of Pd74Ru26 NCs at 200 mA cm−2 in 1 M KOH with 32.3 mM NO3− using an H-type flow cell. | ||
N isotope labeled eNO3−RR experiments and 1H nuclear magnetic resonance (NMR) tests were performed to assess the origin of the detected ammonia nitrogen (NH3–N) (Fig. 4e). After running eNO3−RR on Pd74Ru26 in NO3−-free electrolyte (ESI Fig. S20a†), NH3 was barely detected in the post-reaction electrolyte (ESI Fig. S20b†). As expected, there was no NH4+ signal in the 1H NMR spectrum. After running eNO3−RR on Pd74Ru26 with 14NO3− and 15NO3− sources, clear characteristic signals corresponding to 14NH4+ (triple peaks) and 15NH4+ (double peaks) appeared in the 1H NMR spectra of the post-reaction electrolytes, respectively. This proves that the product NH3–N does originate from eNO3−RR. Afterwards, the 15NH3 yield rate was quantified by the linear fitting calibration curves obtained from the 1H NMR peaks. The results agree well with the UV-vis spectrophotometric measurement results, proving the reliability of the ammonia production performance test (ESI Fig. S21†). Additionally, we performed control experiments with a bare CFP electrode to confirm that eNO3−RR principally occurs on Pd74Ru26 (ESI Fig. S22†). Considering the incompletely exposed CFP area in the Pd74Ru26/CFP electrode and the extremely low NH3 yield rates of the bare CFP electrode, the impact of CFP on the performance results of Pd74Ru26 is negligible.
To evaluate the NO3− removal capacity of Pd74Ru26 in simulated industrial wastewater, a continuous eNO3−RR was carried out at −0.3 V with a starting NO3− concentration of 32.3 mM (equivalent to 451.6 µg ml−1 NO3−–N). The conversion of elemental N was tracked by determining the concentrations of NO3−, NO2− and NH3 in the electrolyte at different times (Fig. 4f). As eNO3−RR proceeded, NO3−–N was gradually reduced to NH3–N with a conversion rate of 90.6% at the 200th min (ESI Fig. S23†). No toxic pollutant NO2− was detected in the entire electrolysis process, which prevented the secondary pollution to the environment. After 170 min of electrolysis, the residual NO3−–N (11.26 µg ml−1) fell below the acceptable drinking water level (<11.29 µg ml−1) stipulated by the World Health Organization (WHO).46 It should be mentioned that the NH3 FE was maintained at ∼100% until the NO3−–N dropped to 147.4 µg ml−1 (i.e., 10.5 mM NO3−) after 1 hour.
To explore the potential of Pd74Ru26 for NH3 production with ∼100% FE over a wider NO3− concentration range, we examined its NH3 production performance at a starting NO3− concentration of 100 mM. As shown in Fig. 4g, the potential window for obtaining ∼100% NH3 FE can be extended from 0.1 to −0.9 V, and the average NH3 yield rate at −0.9 V can reach 42.98 mg h−1 cm−2, approaching the DOE target of >60 mg h−1 cm−2.16 The nearly consistent agreement between the average jNH3 and LSV curves at different potentials in this potential interval further verified the performance of Pd74Ru26 for NH3 production with full FE (Fig. 4h). The performance of Pd74Ru26 for NH3 production by eNO3−RR exceeds that of most previously reported electrocatalysts (ESI Fig. S24 and Table S5†).
Long-term stability of a catalyst is crucial for its practical applications. Here, an over 100 h chronopotentiometry (CP) test was conducted in an H-type flow cell to assess the catalytic stability of Pd74Ru26 (Fig. 4i). The potential maintaining a current density of 200 mA cm−2 was stable around −0.3 V with measured NH3 FE over 90% at different times. The XRD patterns (ESI Fig. S25†), TEM mapping images (ESI Fig. S26†) and HRTEM image (ESI Fig. S27†) of Pd74Ru26 after the stability test reveal no obvious changes in its morphology and structure. Moreover, the XPS analysis of Pd74Ru26 after a 114 h CP test shows little change in the chemical compositions and oxidation states (ESI Fig. S28 and Table S2†). These results suggest that the structurally stable Pd74Ru26 NCs possess remarkable catalytic stability for eNO3−RR to NH3.
2.4 Reaction mechanism analysis
Operando Fourier transform infrared spectroscopy (FTIR) tests were performed to detect the reactive species on Pd, Ru and Pd74Ru26 during eNO3−RR from OCP to −1 V, as shown in Fig. 5a–c. Positive and negative infrared bands correspond to consumed and produced species, respectively.47 At the open circuit potential (OCP), the FTIR spectra of Pd, Ru and Pd74Ru26 have no obvious signals. When the applied potential gradually shifts negatively, some characteristic peaks appear. For Pd, the characteristic peaks located at ∼1130 cm−1, ∼1240 cm−1, ∼1445 cm−1, and ∼1625 cm−1 can be respectively assigned to the N–O bond, the N–O antisymmetric stretching of NO2−, the wagging of –NH2, and the bending of H2O.28,37 For Ru and Pd74Ru26, besides the same characteristic peaks as Pd, characteristic peaks located at ∼1345 cm−1, ∼3380 cm−1, and ∼3750 cm−1 can also be observed. They can be attributed to the N–O asymmetric stretching vibration of NO3−, the O–H stretching of H2O, and the bending of N–H,28,37 respectively. Among them, the emergence of –NH2 wagging and N–H bending confirms the formation of NH3. The emergence of the N–O bond and the N–O antisymmetric stretching of NO2− means the formation of key intermediates in the deoxygenation process. The emergence of O–H stretching and H2O bending indicates the involvement of H2O in the reaction. In the FTIR spectra of Ru and Pd74Ru26, the peak intensity of the N–O asymmetric stretching vibration of NO3− gradually increases with the potential, indicating the consumption of NO3−. From the FTIR spectra collected on Pd, the most intense peak is the N–O antisymmetric stretching of NO2−. This indicates the presence of considerable NO2− on the Pd surface, consistent with experimental observations (Fig. 4b). From the FTIR spectra collected on Ru and Pd74Ru26, the most intense peaks are the H2O bending and N–O bond, respectively. This indicates that eNO3−RR occurs more fully on Pd74Ru26, also consistent with experimental observations (Fig. 4b). According to the above results, the volcano-type relationship between PdxRuy and eNO3−RR activity can be further explained as follows. For Pd90Ru10, a large amount of Pd may lead to insufficient adsorption of intermediate NO2, thereby inhibiting the subsequent conversion of NO2 to NH3. For Pd57Ru43, excess Ru may lead to excessive adsorption of H2O, which is not conducive to the coupling of protons and nitrogen intermediates. Alloying Pd and Ru to Pd74Ru26 can optimize the adsorption/coupling of proton and nitrogen intermediates to a high level of dynamic equilibrium.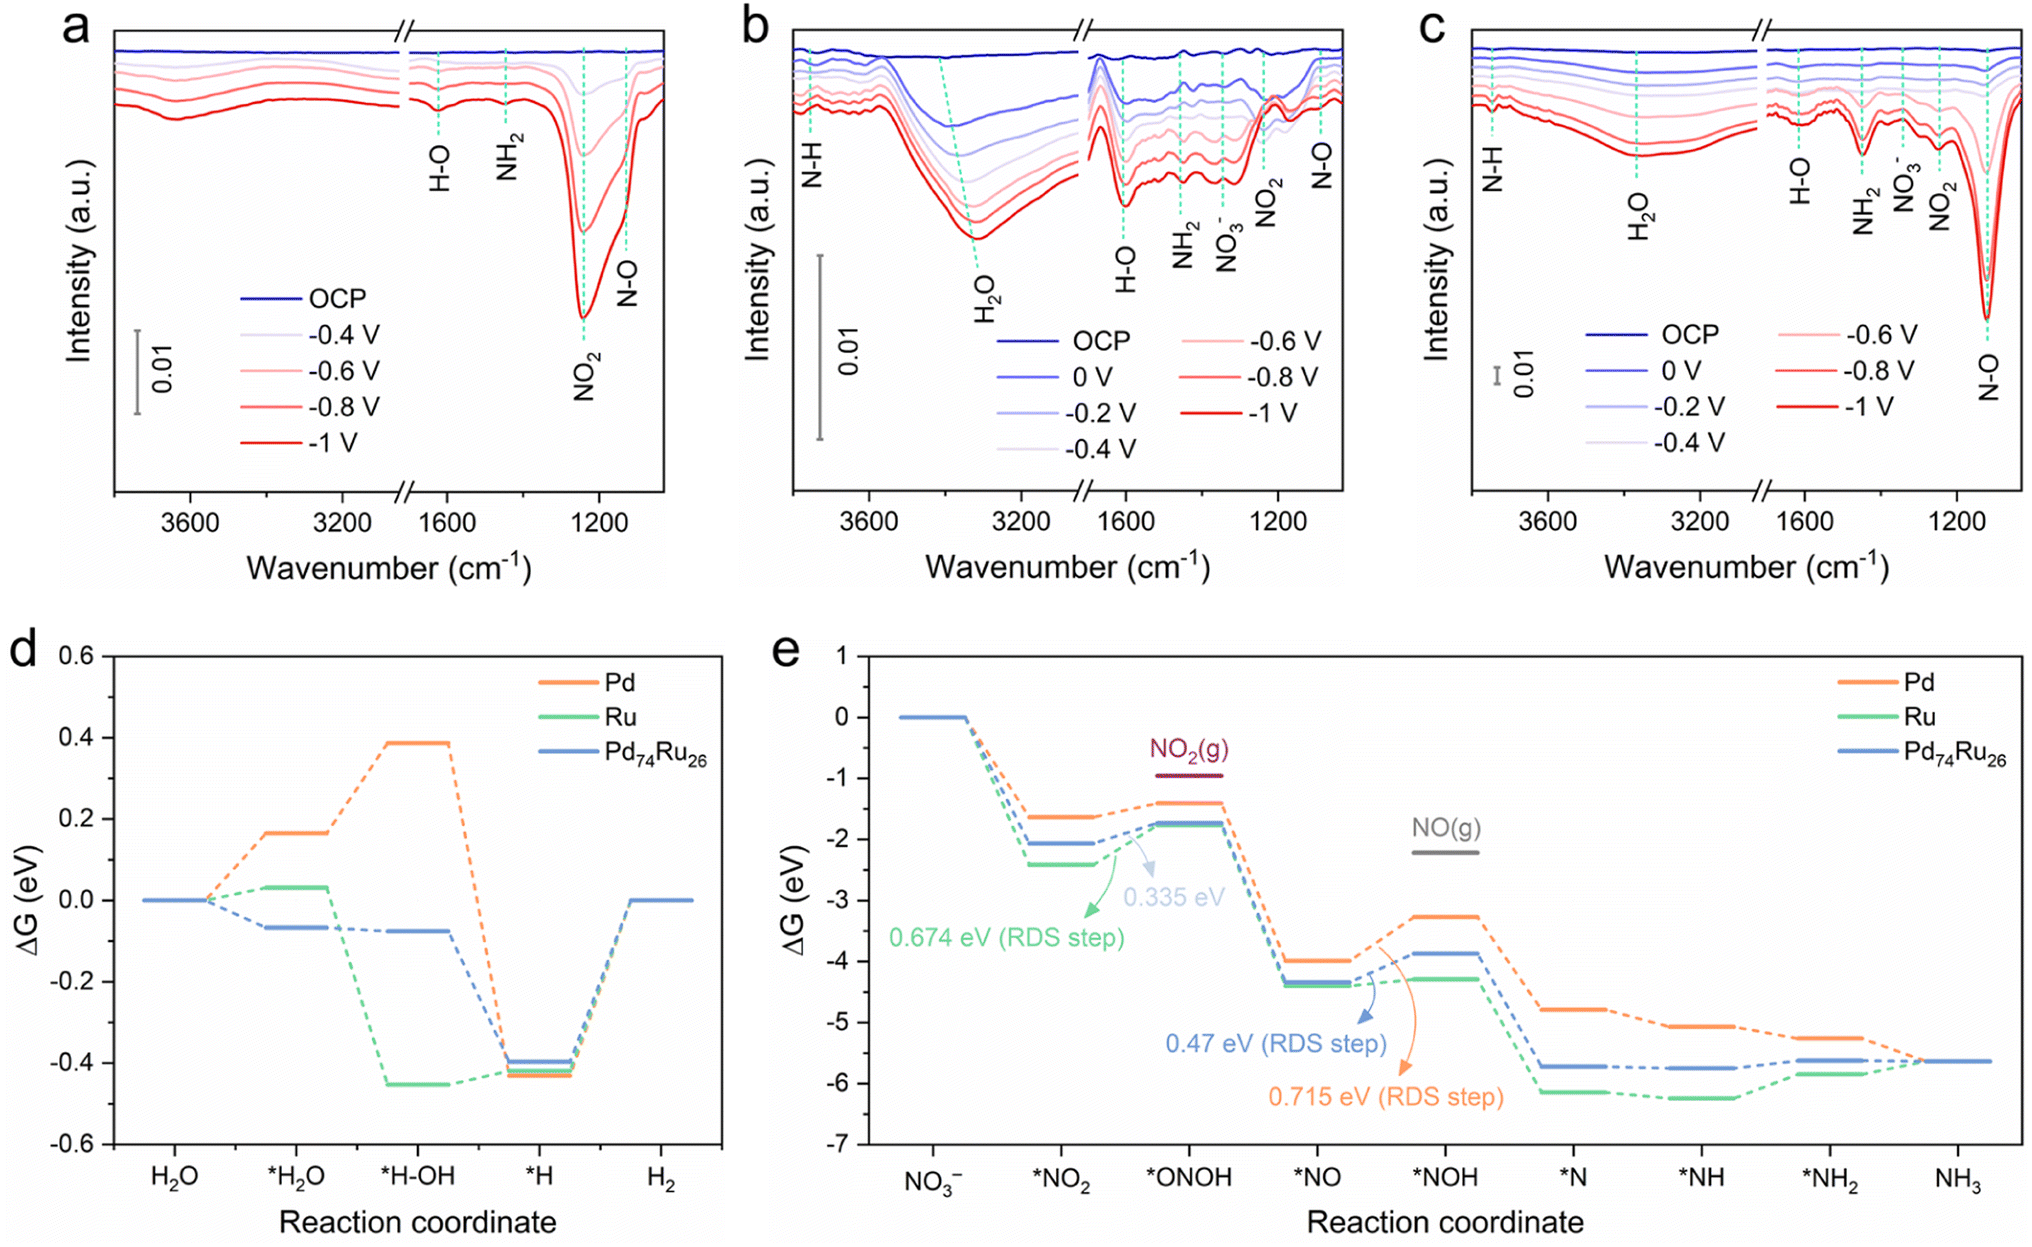 | ||
| Fig. 5 Operando FTIR spectra collected on Pd (a), Ru (b) and Pd74Ru26 (c) during eNO3−RR from OCP to −1 V. The free energy diagram of each intermediate state during the HER (d) and eNO3RR (e) on the three surfaces calculated at 0 V. | ||
Density functional theory (DFT) calculations were further performed to investigate the eNO3−RR mechanism and understand the synergistic catalytic behavior of Pd and Ru in Pd74Ru26. Three stable and confirmed surfaces, including Pd(111), Ru(001) and Pd74Ru26(111), were selected to build models. The adsorption configurations of each intermediate on the three surfaces during the HER and eNO3RR steps were optimized (ESI Fig. S29†). Based on the experimental results, the three catalysts all have eNO3−RR activity and undergo NH3-producing pathways, meaning that they can all reduce NO3−. However, NO3− typically has low binding affinity and nucleophilicity on transition metals owing to its symmetrical (D3h) resonant structure.48 Moreover, it is thermodynamically difficult to adsorb negatively charged free NO3− on the surface of the negative electrode, especially under a more negative reduction potential. Given the strong hydrogen bonding between NO3− and H2O in the aqueous electrolyte,23 the adsorption of NO3− on the electrode surface largely depends on the affinity for H2O. Consequently, appropriately enhanced H2O adsorption on the Pd74Ru26(111) surface compared to Pd(111) and Ru(001) surfaces favors the transport and subsequent reduction of NO3− (Fig. 5d). This also corresponds to Pd74Ru26 exhibiting the most positive onset potential for eNO3−RR (Fig. 4a). The step from *H to H2 on the three surfaces is thermodynamically uphill and the energy barriers are almost identical, which suggests that they all have similar *H retention capabilities. In this case, the *H on the surface of Pd74Ru26 will more readily bind to the high-density *NO3−, thus facilitating the subsequent proton-coupled electron transfer process to produce NH3.
The most thermodynamically favorable eNO3−RR pathway on the three surfaces was studied, involving a sequential deoxidation (*NO3 to *N) followed by a sequential hydrogenation (*N to *NH3) process (ESI Fig. S30–S32† and DFT calculations).17,49,50 The diagram based on the Gibbs free energy change (ΔG) of each reaction state calculated under 0 V is shown in Fig. 5e. In terms of the ΔG over the entire eNO3−RR path, the introduction of Ru into Pd mainly optimizes the deoxidation steps compared to the single components. It can be seen that the three surfaces all display energy barriers for the protonation of *NO2 and *NO. For the Ru(001) surface, the RDS is the reduction of *NO2 to *ONOH with a high ΔG of 0.674 eV, while for the Pd(111) surface, the RDS is the reduction of *NO to *NOH with a higher ΔG of 0.715 eV. Alloying Pd and Ru to the Pd74Ru26(111) surface results in the same RDS as for Pd, but with a much lower ΔG of 0.47 eV. This is consistent with the experimental results on the order of performance of the catalysts for NH3 production via eNO3−RR, i.e., Pd74Ru26 > Ru > Pd. Appearance of considerable NO2− FE on Pd may be due to its relatively high ΔG of *ONOH as shown in Fig. 5d, which allows the desorption of *ONOH to form NO2−.
Based on the above analysis, the electronic interactions between Pd and Ru in Pd74Ru26 optimize the performance of eNO3−RR to NH3 mainly in two aspects: (1) improving the transport of NO3− to the catalyst surface by increasing the affinity of H2O, and (2) lowering the protonation energy barriers for two key intermediates *NO2 (compared to Ru) and *NO (compared to Pd).
3. Conclusions
To summarize, we designed a Pd74Ru26 bimetallic electrocatalyst via a tailored electrodeposition method for highly efficient NH3 production via eNO3−RR under alkaline conditions. When operating at the NO3− concentration (32.3 mM) of typical industrial wastewater, Pd74Ru26 exhibits nearly full NH3 FE over a wide potential window from 0.1 to −0.3 V, with an average NH3 yield rate of 16.20 mg h−1 cm−2 at −0.3 V. The potential window for obtaining ∼100% NH3 FE can be extended from 0.1 to −0.9 V at a NO3− concentration of 100 mM, with the average NH3 yield rate reaching 42.98 mg h−1 cm−2 at −0.9 V. Meanwhile, Pd74Ru26 also demonstrates excellent electrocatalytic stability during a 114 h CP test. Experimental investigations and DFT calculations suggest that the remarkable performance of eNO3−RR to NH3 originates from the optimized transport of NO3− and protonation of key intermediates *NO2 (compared to Ru) and *NO (compared to Pd), which benefits from the electronic structure modulation of Pd and Ru in Pd74Ru26. This work provides not only an eNO3−RR catalyst for NH3 production with nearly full FE, but also an effective route to design eNO3−RR catalysts capable of balancing the adsorption and coupling of *H with various nitrogen intermediates.Author contributions
Yue Hu mainly conducted the design, synthesis, structural analysis and electrocatalytic measurements, and prepared the original manuscript. Jiawei Liu, Wenyu Luo, Jinfeng Dong, Carmen Lee, and Hu Erhai assisted with the characterization analysis and electrocatalytic measurements. Zhang Nan assisted with the Operando Fourier transform infrared spectroscopy (FTIR) tests. Mengxin Chen assisted with the 1H nuclear magnetic resonance (NMR) testing. Yifan Xu and Dongshuang Wu assisted with the X-ray absorption spectroscopy tests and analysis. Mingsheng Zhang and Qiang Zhu assisted with the X-ray photoelectron spectroscopy tests. Lixiang Zhong assisted with the density functional theory calculations and analysis. Dongsheng Geng and Qingyu Yan supervised the work and revised the manuscript. All authors participated in the discussion of the results.Conflicts of interest
The authors declare no conflicting interests regarding the content of this article.Acknowledgements
The authors acknowledge funding support from the 111 Project (no. B170003), Outstanding Young Talents Program (Overseas), Nanjing University of Information Science & Technology, Singapore MOE AcRF Tier 1 grant no. 2020-T1-001-031 and RT6/22, and Singpaore RIE2025 USS LCER PHASE 2 PROGRAMME U2305D4001. The XAFS measurement was conducted at BL14b2, SPring-8 under beam proposal 2023A1735. Yifan Xu and Dongshuang Wu acknowledge the NAP-SUG from NTU and tier 1 grant (RG81/22) from MOE to support the overseas XAFS experiments. They also greatly appreciate the technical support from the beam scientists Okkyun SEO and Takeshi WATANABE.References
- Y. Wang, C. Wang, M. Li, Y. Yu and B. Zhang, Nitrate electroreduction: mechanism insight, in situ characterization, performance evaluation, and challenges, Chem. Soc. Rev., 2021, 50, 6720–6733 RSC.
- A. Valera-Medina, H. Xiao, M. Owen-Jones, W. I. F. David and P. J. Bowen, Ammonia for power, Prog. Energy Combust. Sci., 2018, 69, 63–102 CrossRef.
- C. Smith, A. K. Hill and L. Torrente-Murciano, Current and future role of Haber–Bosch ammonia in a carbon-free energy landscape, Energy Environ. Sci., 2020, 13, 331–344 RSC.
- J. Lim, C. A. Fernández, S. W. Lee and M. C. Hatzell, Ammonia and nitric acid demands for fertilizer use in 2050, ACS Energy Lett., 2021, 6, 3676–3685 CrossRef CAS.
- X. Liu, A. Elgowainy and M. Wang, Life cycle energy use and greenhouse gas emissions of ammonia production from renewable resources and industrial by-products, Green Chem., 2020, 22, 5751–5761 RSC.
- J. G. Chen, R. M. Crooks, L. C. Seefeldt, K. L. Bren, R. M. Bullock, M. Y. Darensbourg, P. L. Holland, B. Hoffman, M. J. Janik, A. K. Jones, M. G. Kanatzidis, P. King, K. M. Lancaster, S. V. Lymar, P. Pfromm, W. F. Schneider and R. R. Schrock, Beyond fossil fuel–driven nitrogen transformations, Science, 2018, 360, eaar6611 CrossRef PubMed.
- B. H. R. Suryanto, H.-L. Du, D. Wang, J. Chen, A. N. Simonov and D. R. MacFarlane, Challenges and prospects in the catalysis of electroreduction of nitrogen to ammonia, Nat. Catal., 2019, 2, 290–296 CrossRef CAS.
- I. E. Khalil, C. Xue, W. Liu, X. Li, Y. Shen, S. Li, W. Zhang and F. Huo, The role of defects in metal–organic frameworks for nitrogen reduction reaction: when defects switch to features, Adv. Funct. Mater., 2021, 31, 2010052 CrossRef CAS.
- C. Lv, J. Liu, C. Lee, Q. Zhu, J. Xu, H. Pan, C. Xue and Q. Yan, Emerging p-block-element-based electrocatalysts for sustainable nitrogen conversion, ACS Nano, 2022, 16, 15512–15527 CrossRef CAS PubMed.
- X. Yang, S. Mukherjee, T. O'Carroll, Y. Hou, M. R. Singh, J. A. Gauthier and G. Wu, Achievements, challenges, and perspectives on nitrogen electrochemistry for carbon-neutral energy technologies, Angew. Chem., Int. Ed., 2023, 62, e202215938 CrossRef CAS PubMed.
- D. Liu, L. Qiao, S. Peng, H. Bai, C. Liu, W. F. Ip, K. H. Lo, H. Liu, K. W. Ng, S. Wang, X. Yang and H. Pan, Recent advances in electrocatalysts for efficient nitrate reduction to ammonia, Adv. Funct. Mater., 2023, 33, 2303480 CrossRef CAS.
- J. Liang, Z. Li, L. Zhang, X. He, Y. Luo, D. Zheng, Y. Wang, T. Li, H. Yan, B. Ying, S. Sun, Q. Liu, M. S. Hamdy, B. Tang and X. Sun, Advances in ammonia electrosynthesis from ambient nitrate/nitrite reduction, Chem, 2023, 9, 1768–1827 CAS.
- Z. W. Seh, J. Kibsgaard, C. F. Dickens, I. Chorkendorff, J. K. Nørskov and T. F. Jaramillo, Combining theory and experiment in electrocatalysis: insights into materials design, Science, 2017, 355, eaad4998 CrossRef PubMed.
- X. Cui, C. Tang and Q. Zhang, A review of electrocatalytic reduction of dinitrogen to ammonia under ambient conditions, Adv. Energy Mater., 2018, 8, 1800369 CrossRef.
- H. Shen, C. Choi, J. Masa, X. Li, J. Qiu, Y. Jung and Z. Sun, Electrochemical ammonia synthesis: mechanistic understanding and catalyst design, Chem, 2021, 7, 1708–1754 CAS.
- G. Soloveichik, M. Acharya, H. Cheeseman, D. Wicks and D. J. U. D. Tew, Renewable Energy to Fuels through Utilization of Energy-Dense Liquids (REFUEL), US DOE, 2016 Search PubMed.
- Y. Wang, A. Xu, Z. Wang, L. Huang, J. Li, F. Li, J. Wicks, M. Luo, D.-H. Nam, C.-S. Tan, Y. Ding, J. Wu, Y. Lum, C.-T. Dinh, D. Sinton, G. Zheng and E. H. Sargent, Enhanced nitrate-to-ammonia activity on copper–nickel alloys via tuning of intermediate adsorption, J. Am. Chem. Soc., 2020, 142, 5702–5708 CrossRef CAS PubMed.
- P. G. Falkowski, T. Fenchel and E. F. Delong, The microbial engines that drive earth's biogeochemical cycles, Science, 2008, 320, 1034–1039 CrossRef CAS PubMed.
- A. Menció, J. Mas-Pla, N. Otero, O. Regàs, M. Boy-Roura, R. Puig, J. Bach, C. Domènech, M. Zamorano, D. Brusi and A. Folch, Nitrate pollution of groundwater; all right…, but nothing else?, Sci. Total Environ., 2016, 539, 241–251 CrossRef PubMed.
- P. H. van Langevelde, I. Katsounaros and M. T. M. Koper, Electrocatalytic nitrate reduction for sustainable ammonia production, Joule, 2021, 5, 290–294 CrossRef.
- G.-F. Chen, Y. Yuan, H. Jiang, S.-Y. Ren, L.-X. Ding, L. Ma, T. Wu, J. Lu and H. Wang, Electrochemical reduction of nitrate to ammonia via direct eight-electron transfer using a copper–molecular solid catalyst, Nat. Energy, 2020, 5, 605–613 CrossRef CAS.
- Y. Wang, M. Sun, J. Zhou, Y. Xiong, Q. Zhang, C. Ye, X. Wang, P. Lu, T. Feng, F. Hao, F. Liu, J. Wang, Y. Ma, J. Yin, S. Chu, L. Gu, B. Huang and Z. Fan, Atomic coordination environment engineering of bimetallic alloy nanostructures for efficient ammonia electrosynthesis from nitrate, Proc. Natl. Acad. Sci. U. S. A., 2023, 120, e2306461120 CrossRef CAS PubMed.
- W. He, J. Zhang, S. Dieckhöfer, S. Varhade, A. C. Brix, A. Lielpetere, S. Seisel, J. R. C. Junqueira and W. Schuhmann, Splicing the active phases of copper/cobalt-based catalysts achieves high-rate tandem electroreduction of nitrate to ammonia, Nat. Commun., 2022, 13, 1129 CrossRef CAS PubMed.
- F.-Y. Chen, Z.-Y. Wu, S. Gupta, D. J. Rivera, S. V. Lambeets, S. Pecaut, J. Y. T. Kim, P. Zhu, Y. Z. Finfrock, D. M. Meira, G. King, G. Gao, W. Xu, D. A. Cullen, H. Zhou, Y. Han, D. E. Perea, C. L. Muhich and H. Wang, Efficient conversion of low-concentration nitrate sources into ammonia on a Ru-dispersed Cu nanowire electrocatalyst, Nat. Nanotechnol., 2022, 17, 759–767 CrossRef CAS PubMed.
- M. Xie, S. Tang, Z. Li, M. Wang, Z. Jin, P. Li, X. Zhan, H. Zhou and G. Yu, Intermetallic single-atom alloy In–Pd bimetallene for neutral electrosynthesis of ammonia from nitrate, J. Am. Chem. Soc., 2023, 145, 13957–13967 CrossRef CAS PubMed.
- L. Wu, J. Feng, L. Zhang, S. Jia, X. Song, Q. Zhu, X. Kang, X. Xing, X. Sun and B. Han, Boosting electrocatalytic nitrate-to-ammonia via tuning of n-intermediate adsorption on a Zn–Cu catalyst, Angew. Chem., Int. Ed., 2023, 62, e202307952 CrossRef CAS PubMed.
- Y. Zhou, R. Duan, H. Li, M. Zhao, C. Ding and C. Li, Boosting electrocatalytic nitrate reduction to ammonia via promoting water dissociation, ACS Catal., 2023, 13, 10846–10854 CrossRef CAS.
- J. Zhou, M. Wen, R. Huang, Q. Wu, Y. Luo, Y. Tian, G. Wei and Y. Fu, Regulating active hydrogen adsorbed on grain boundary defects of nano-nickel for boosting ammonia electrosynthesis from nitrate, Energy Environ. Sci., 2023, 16, 2611–2620 RSC.
- A. J. Medford, A. Vojvodic, J. S. Hummelshøj, J. Voss, F. Abild-Pedersen, F. Studt, T. Bligaard, A. Nilsson and J. K. Nørskov, From the sabatier principle to a predictive theory of transition-metal heterogeneous catalysis, J. Catal., 2015, 328, 36–42 CrossRef CAS.
- K. Fan, W. Xie, J. Li, Y. Sun, P. Xu, Y. Tang, Z. Li and M. Shao, Active hydrogen boosts electrochemical nitrate reduction to ammonia, Nat. Commun., 2022, 13, 7958 CrossRef CAS PubMed.
- Y. Wu, L. Wang, T. Bo, Z. Chai, J. K. Gibson and W. Shi, Boosting hydrogen evolution in neutral medium by accelerating water dissociation with Ru clusters loaded on Mo2CTx MXene, Adv. Funct. Mater., 2023, 33, 2214375 CrossRef CAS.
- J. Wang, L. Han, B. Huang, Q. Shao, H. L. Xin and X. Huang, Amorphization activated ruthenium–tellurium nanorods for efficient water splitting, Nat. Commun., 2019, 10, 5692 CrossRef CAS PubMed.
- L. Deng, F. Hu, M. Ma, S.-C. Huang, Y. Xiong, H.-Y. Chen, L. Li and S. Peng, Electronic modulation caused by interfacial Ni–O–M (M = Ru, Ir, Pd) bonding for accelerating hydrogen evolution kinetics, Angew. Chem., Int. Ed., 2021, 60, 22276–22282 CrossRef CAS PubMed.
- J. Chen, C. Chen, M. Qin, B. Li, B. Lin, Q. Mao, H. Yang, B. Liu and Y. Wang, Reversible hydrogen spillover in Ru-WO3−x enhances hydrogen evolution activity in neutral pH water splitting, Nat. Commun., 2022, 13, 5382 CrossRef CAS PubMed.
- J. Lim, C.-Y. Liu, J. Park, Y.-H. Liu, T. P. Senftle, S. W. Lee and M. C. Hatzell, Structure sensitivity of Pd facets for enhanced electrochemical nitrate reduction to ammonia, ACS Catal., 2021, 11, 7568–7577 CrossRef CAS.
- W. Gao, K. Xie, J. Xie, X. Wang, H. Zhang, S. Chen, H. Wang, Z. Li and C. Li, Alloying of Cu with Ru enabling the relay catalysis for reduction of nitrate to ammonia, Adv. Mater., 2023, 35, 2202952 CrossRef CAS PubMed.
- J.-Y. Fang, Q.-Z. Zheng, Y.-Y. Lou, K.-M. Zhao, S.-N. Hu, G. Li, O. Akdim, X.-Y. Huang and S.-G. Sun, Ampere-level current density ammonia electrochemical synthesis using CuCo nanosheets simulating nitrite reductase bifunctional nature, Nat. Commun., 2022, 13, 7899 CrossRef CAS PubMed.
- C. Cui, L. Gan, M. Heggen, S. Rudi and P. Strasser, Compositional segregation in shaped Pt alloy nanoparticles and their structural behaviour during electrocatalysis, Nat. Mater., 2013, 12, 765–771 CrossRef CAS PubMed.
- L. Fan, H. Shen, D. Ji, Y. Xing, L. Tao, Q. Sun and S. Guo, Biaxially compressive strain in Ni/Ru core/shell nanoplates boosts Li–CO2 batteries, Adv. Mater., 2022, 34, 2204134 CrossRef CAS PubMed.
- A. J. Bard, L. R. Faulkner and H. S. White, Electrochemical Methods: Fundamentals and Applications, John Wiley & Sons, 2001 Search PubMed.
- M. Zhao, L. Xu, M. Vara, A. O. Elnabawy, K. D. Gilroy, Z. D. Hood, S. Zhou, L. Figueroa-Cosme, M. Chi, M. Mavrikakis and Y. Xia, Synthesis of Ru icosahedral nanocages with a face-centered-cubic structure and evaluation of their catalytic properties, ACS Catal., 2018, 8, 6948–6960 CrossRef CAS.
- K. Kusada, H. Kobayashi, R. Ikeda, Y. Kubota, M. Takata, S. Toh, T. Yamamoto, S. Matsumura, N. Sumi, K. Sato, K. Nagaoka and H. Kitagawa, Solid solution alloy nanoparticles of immiscible Pd and Ru elements neighboring on Rh: changeover of the thermodynamic behavior for hydrogen storage and enhanced CO–Oxidizing ability, J. Am. Chem. Soc., 2014, 136, 1864–1871 CrossRef CAS PubMed.
- Z. Qiu, Y. Li, Y. Gao, Z. Meng, Y. Sun, Y. Bai, N.-T. Suen, H.-C. Chen, Y. Pi and H. Pang, 2D MOF-assisted pyrolysis-displacement-alloying synthesis of high-entropy alloy nanoparticles library for efficient electrocatalytic hydrogen oxidation, Angew. Chem., Int. Ed., 2023, 62, e202306881 CrossRef CAS PubMed.
- R. Chauhan and V. C. Srivastava, Electrochemical denitrification of highly contaminated actual nitrate wastewater by Ti/RuO2 anode and iron cathode, Chem. Eng. J., 2020, 386, 122065 CrossRef CAS.
- Y. Fernández-Nava, E. Marañón, J. Soons and L. Castrillón, Denitrification of wastewater containing high nitrate and calcium concentrations, Bioresour. Technol., 2008, 99, 7976–7981 CrossRef PubMed.
- World Health Organization, Guidelines for Drinking-Water Quality: First Addendum to the Fourth Edition, World Health Organization, 2017 Search PubMed.
- X. Li, P. Shen, X. Li, D. Ma and K. Chu, Sub-nm RuOx clusters on Pd metallene for synergistically enhanced nitrate electroreduction to ammonia, ACS Nano, 2023, 17, 1081–1090 CrossRef CAS PubMed.
- Y. Li, Y. K. Go, H. Ooka, D. He, F. Jin, S. H. Kim and R. Nakamura, Enzyme mimetic active intermediates for nitrate reduction in neutral aqueous media, Angew. Chem., Int. Ed., 2020, 59, 9744–9750 CrossRef CAS PubMed.
- N. C. Kani, N. H. L. Nguyen, K. Markel, R. R. Bhawnani, B. Shindel, K. Sharma, S. Kim, V. P. Dravid, V. Berry, J. A. Gauthier and M. R. Singh, Electrochemical reduction of nitrates on CoO nanoclusters-functionalized graphene with highest mass activity and nearly 100% selectivity to ammonia, Adv. Energy Mater., 2023, 13, 2204236 CrossRef CAS.
- J.-X. Liu, D. Richards, N. Singh and B. R. Goldsmith, Activity and selectivity trends in electrocatalytic nitrate reduction on transition metals, ACS Catal., 2019, 9, 7052–7064 CrossRef CAS.
Footnote |
| † Electronic supplementary information (ESI) available. See DOI: https://doi.org/10.1039/d4sc00558a |
| This journal is © The Royal Society of Chemistry 2024 |