
 Open Access Article
 This Open Access Article is licensed under a Creative Commons Attribution-Non Commercial 3.0 Unported Licence
Ab initio-based determination of lanthanoid–radical exchange as visualised by inelastic neutron scattering†
Maja A.
Dunstan
 a,
Marcus J.
Giansiracusa
a,
Simone
Calvello
ab,
Lorenzo
Sorace
c,
Anwen M.
Krause-Heuer
b,
Alessandro
Soncini
*ad,
Richard A.
Mole
*b and
Colette
Boskovic
*a
a,
Marcus J.
Giansiracusa
a,
Simone
Calvello
ab,
Lorenzo
Sorace
c,
Anwen M.
Krause-Heuer
b,
Alessandro
Soncini
*ad,
Richard A.
Mole
*b and
Colette
Boskovic
*a
aSchool of Chemistry, The University of Melbourne, Parkville, VIC 3010, Australia. E-mail: c.boskovic@unimelb.edu.au
bAustralian Nuclear Science and Technology Organisation, Locked Bag 2001, Kirrawee DC 2232, Australia. E-mail: richardm@ansto.gov.au
cINFN Sez. di Firenze, Department of Chemistry, “Ugo Schiff”, Università Degli Studi Firenze, Via Della Lastruccia, 13, 50019 Sesto Fiorentino, Italy
dDepartment of Chemical Sciences, University of Padova, Via Marzolo 1, 35131 Padova, Italy. E-mail: alessandro.soncini@unipd.it
First published on 13th February 2024
Abstract
Magnetic exchange coupling can modulate the slow magnetic relaxation in single-molecule magnets. Despite this, elucidation of exchange coupling remains a significant challenge for the lanthanoid(III) ions, both experimentally and computationally. In this work, the crystal field splitting and 4f–π exchange coupling in the erbium–semiquinonate complex [ErTp2dbsq] (Er-dbsq; Tp− = hydro-tris(1-pyrazolyl)borate, dbsqH2 = 3,5-di-tert-butyl-1,2-semiquinone) have been determined by inelastic neutron scattering (INS), magnetometry, and CASSCF-SO ab initio calculations. A related complex with a diamagnetic ligand, [ErTp2trop] (Er-trop; tropH = tropolone), has been used as a model for the crystal field splitting in the absence of coupling. Magnetic and INS data indicate antiferromagnetic exchange for Er-dbsq with a coupling constant of Jex = −0.23 meV (−1.8 cm−1) (−2Jex formalism) and good agreement is found between theory and experiment, with the low energy magnetic and spectroscopic properties well modelled. Most notable is the ability of the ab initio modelling to reproduce the signature of interference between localised 4f states and delocalised π–radical states that is evident in the Q-dependence of the exchange excitation. This work highlights the power of combining INS with EPR and magnetometry for determination of ground state properties, as well as the enhanced capability of CASSCF-SO ab initio calculations and purposely developed ab initio-based theoretical models. We deliver an unprecedentedly detailed representation of the entangled character of 4f–π exchange states, which is obtained via an accurate image of the spin–orbital transition density between the 4f–π exchange coupled wavefunctions.
Introduction
Single-molecule magnets (SMMs) are discrete molecular species that exhibit magnetic bistability at low temperature. Determined research effort has afforded significant advances in their properties since their discovery 30 years ago.1–3 Consequently, the possibility of practical applications has become realistic, for example in data-storage, qubits, or as components in spintronics devices. Compounds based on the lanthanoid (Ln) ions show higher temperature magnetic stability, utilizing the intrinsically large magnetic moments and magnetic anisotropy, especially of the latter Ln(III) ions.4 Recent advances have led to the observation of open magnetic hysteresis loops above liquid nitrogen temperature.5 These include a family of “dysprosocenium” complexes, where slow magnetic hysteresis has been observed up to 80 K.6–8 More recently, mixed-valence binuclear [(CpiPr5)2Ln2I3] (CpiPr5 = penta-isopropyl-cyclopentadienyl) complexes have exhibited record breaking coercive fields of greater than 14 T below 60 K for the Dy analogue, boasting bulk properties to challenge traditional magnetic media.9For Ln(III) single-ion magnets in the absence of exchange coupling, the magnetic properties stem from crystal field (CF) splitting of the ground spin–orbit coupled J electronic state due to the influence of the coordinated ligands. The relative order of energy levels and the purity of their composition can be tuned by an appropriate choice of ligand scaffold.4 To access slow relaxation of magnetisation, a doubly degenerate ground electronic state is required, which is fulfilled for Kramers ions such as Dy(III) and Er(III); as well as stabilisation of an easy-axis ground state, i.e. a ground electronic state dominated by a large mJ projection with unidirectional magnetic moment.10
Introducing exchange coupling with another magnetic species, such as an organic radical ligand, transition metal (TM), or a second Ln(III) ion, can be used to modulate the slow magnetic relaxation in Ln(III)-SMMs.11–15 A small exchange bias may suppress quantum tunnelling in zero-field in some cases, allowing for observation of slow magnetic relaxation in zero-magnetic field, and has been touted as a method of improving SMM behaviour in Ln systems.16,17 In contrast, weak coupling can instead provide alternative relaxation pathways that rapidly increase relaxation rates and hinder SMM performance.18 The overall magnetic moment of the complex can also be increased by coupling multiple spins into a “giant spin”, which while a common approach for TM-SMMs,19 has not been as widely used for Ln-SMMs, due to their typically weaker magnetic exchange coupling.13,20–23
Spectroscopic techniques to measure the lowest lying electronic energy levels in Ln(III) compounds with large spin–orbit coupling include EPR,24–26 luminescence,27–31 far infrared,24,32,33 and inelastic neutron scattering spectroscopies.34–38 Inelastic neutron scattering (INS) offers unique advantages – it requires no applied magnetic field to identify magnetic transitions and doesn't rely on the often weak luminescence of Ln(III) ions.39 By combining INS measurements with ab initio electronic structure calculations, the CF splitting in Ln(III) systems can be accurately determined.34,35,40 For example, previous literature studies combining INS and EPR spectroscopies with theoretical calculations provided the basis for a Ln–Ln exchange modelling framework, utilising experimental determination of exchange free ground state properties on which to build the interaction model.41,42
Splitting of electronic states due to a magnetic exchange interaction between a Ln(III) ion and radical ligands can also be measured by INS, such as in the Tb(III) complexes [Tb(hfac)3(2pyNO)] (2pyNO = tert-butyl 2-pyridyl nitroxide)43 and [{[(Me3Si)2N]2(THF)Tb}2(μ-N2)].44 Despite a few INS studies, experimental determination of the magnetic exchange coupling in Ln(III)–radical systems is typically only achieved unambiguously by magnetometry for spin-only Gd(III), due to the large unquenched orbital angular momentum of many Ln(III).45 Examples detailing the strength of exchange and modelling method have been tabulated in Table S1.† Approaches to Ln(III)–radical complex design include coordination of stable radical ligands,46 utilizing diffuse radical orbitals to offer better spatial overlap with Ln(III) electron density47–49 and electron/Ln encapsulation in endohedral fullerenes.50–52 Recently, a benzene dianion containing a radical bridging ligand was developed by Gould et al. where the binuclear Gd(III) complex [Ln2(μ-BzN6-Mes)] (BzN6-Mes = 1,3,5-tris[2,6-(N-mesityl)dimethanamino-4-tert-butylphenyl]benzene) holds the current record for Gd–ligand coupling of Jex = −43 cm−1.53 Comparing these systems becomes challenging, as in some strongly coupled systems it is unclear whether there is mixed valency at the metal ion, formally bonding orbitals or a localised radical interacting via exchange pathways.
Despite recent increases in the magnitude of the magnetic exchange coupling in Ln(III) systems, computational studies pose significant challenges, with no robust approach for modelling active spaces beyond the 4f orbitals.9,13,54–57 To develop a computational method for elucidating the exchange coupling in Ln–radical systems, combined experimental and computational studies are required to benchmark calculations.55,58
In this study, we have returned to the [LnTp2dbsq] family,46,59,60 with the aim of elucidating the low energy CF splitting and magnetic exchange coupling in a Ln–radical compound with large spin–orbit coupling through a combination of INS spectroscopy and electronic structure calculations. We have first determined the CF splitting of the diamagnetic ligand analogue [ErTp2trop] (tropH = tropolone; Er-trop)60 using ab initio electronic structure calculations, which we experimentally verify by comparison with static magnetometry and EPR spectroscopy of Er-trop. We then use a combination of INS and electronic structure calculations on [ErTp2dbsq] (Er-dbsq) to determine the CF splitting and Er–radical magnetic exchange coupling. The dynamic magnetic susceptibility data are compared for Er-trop and Er-dbsq. These systems feature very similar coordination environments, which is critical for exchange modelling, providing experimentally observable exchange-free properties to ensure the feasibility of the final exchange coupled calculation.
Results and discussion
Diffraction and structure description
The compounds Y-trop, Er-trop, and Er@Y-trop are isomorphous with the previously reported structure of the Ho(III) analogue, and consistent with the reported cell parameters for the Er(III) analogue (Table S2†).60Er-dbsq is isomorphous with the reported Y-dbsq analogue.59 The rare earth centres are all eight coordinate, with an {N6O2} coordination sphere arising from coordination to the two tripodal Tp− ligands and the bidentate trop− or dbsq˙− ligand (Fig. 1).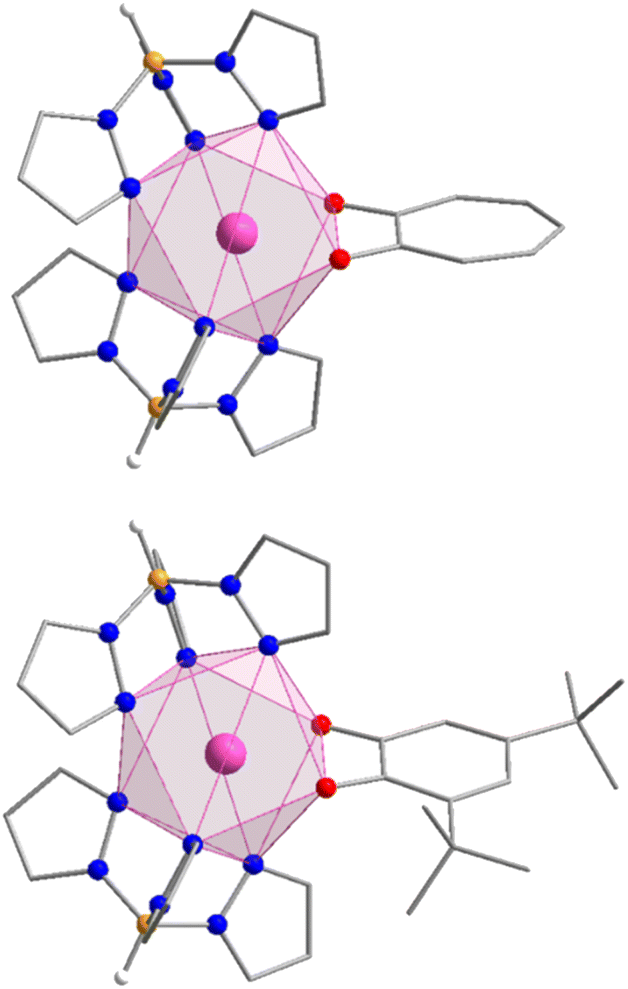 | ||
| Fig. 1 Structural representations of Er-trop and Er-dbsq from X-ray single crystal diffraction with polyhedral representation of the Er(III) coordination sphere. Selected hydrogen atoms have been omitted for clarity. Colour code: Er (pink), O (red), N (blue), B (orange), C (grey), H (white). | ||
The coordination geometry of the rare-earth centre is closest to a square antiprism for all analogues (Fig. 1), according to continuous shape analysis (Table 1), performed with the SHAPE 2.1 software.61,62 The Er(III) centre in both Er-trop and Er-dbsq have a similarly small distortion index from an ideal square antiprism of 0.501 and 0.383, respectively. The similarity between the coordination geometry at the Er(III) centre in the two analogues is further demonstrated by the Er–O and Er–N distances, with average Er–O distance of 2.280(3) Å and 2.295(2) Å, and an average Er–N distance of 2.478(7) Å and 2.482(5) Å for Er-trop and Er-dbsq, respectively.
| Parameter | Er-trop | Er-dbsq |
|---|---|---|
| a Square antiprism. b Biaugmented trigonal prism. | ||
| Distance/Å | ||
| Intramolecular Er–O | 2.280(3) | 2.2846(15), 2.3058(14) |
| Intramolecular Er–Ncoordinated | 2.489(4), 2.510(4), 2.434(4) | 2.505(2), 2.4787(18), 2.4415(18), 2.5206(18), 2.4406(18), 2.5042(18) |
| Intermolecular Er⋯Er | 9.3261(4) | 9.7648(6) |
![[thin space (1/6-em)]](https://www.rsc.org/images/entities/char_2009.gif) |
||
| Angle/° | ||
| O–Er–O | 68.37(17) | 70.02(5) |
|
||
| SHAPE parameters | ||
| SAPRa | 0.501 | 0.383 |
| BTPRb | 2.220 | 1.918 |
Using the software Mercury,63 a comparison of the two structures has been generated (Fig. S4†) by overlaying the Er and the coordinated atoms, which shows good agreement between the coordination geometry of the two structures. Due to the similarity between the coordination spheres of the two compounds, we have analysed the spectroscopic and computational data assuming the ligand geometry and therefore CF effects are the same, with the only difference being the unpaired electron on the dbsq˙− ligand in the Er-dbsq analogue.
Electronic structure calculations
Ab initio electronic structure calculations were performed to obtain the electronic energy levels, g-tensors of the lowest lying (pseudo-)doublets and wavefunction decompositions for Er-trop and Er-dbsq in order to simulate the spectroscopic and magnetic properties (Tables 2 and S4–S7†).The ab initio calculation for Er-trop predicts a ground Kramers Doublet (KD) with majority composition mJ = 68%|±13/2〉, with the first excited KD lying 8.09 meV (65.2 cm−1) higher with majority composition mJ = 84%|±15/2〉. The second excited KD is predicted to lie 11.3 meV (91.1 cm−1) above the ground state and is in contrast highly mixed, with the largest contributions coming from mJ = 19%|±1/2〉, 38%|±3/2〉, 18%|±5/2〉 and 18%|±11/2〉.
Electronic structure calculations on Er-dbsq indicate 32 low-lying electronic states (Table S6†). These states are separated by ca. 6000 cm−1 to the next states and clearly arise from coupling of the ground 4I15/2 spin–orbit term (multiplicity = 16) with the radical. The energy levels calculated in the exchange coupled spectrum are consistent with splitting of the KD states into exchange–split pairs of pseudo-doublets arising from the strong anisotropy of the Er(III) ion. The two lowest lying energy levels have a splitting of 0.29 meV (2.35 cm−1) and are separated from the first excited pseudo-doublet by around 1.25 meV (10 cm−1).
The nature of these states is represented by the effective g-tensors calculated for the pseudo-doublets (Table S11†) and their comparison with those obtained for the Er-trop CF states. The ground doublet for Er-trop yields an effective principal gz value of 14.7, which when coupled with the radical, yields a ground pseudo-doublet with effective gz = 12.9 (ca. 2 less than gz of Er-trop, indicating AF coupling) and a first excited pseudo-doublet with gz = 16.9, further details in ESI.†58
Subsequent energy levels appear in a pattern of pairs of pseudo-doublets centred at energies around the CF states observed for Er-trop, indicating this exchange-free analogue is a reasonable comparison for the exchange coupled Er-dbsq molecule. The third and fourth excited pseudo-doublets also yield gz values consistent with isolated coupling of the KD from Er-trop (gz = 17.3) with a radical to give an AF doublet at lower energy (gz = 14.8) and F doublet at higher energy (gz = 19.1). For the subsequent states, the trend in gz values is no longer observed, likely due to the highly mixed wavefunctions with more pronounced rhombic gx/y components.
These calculations allow predictions of INS transitions, with four possible excitations between states 1 → 3, 1 → 4, 2 → 3 and 2 → 4, centred around 1.1 meV (9 cm−1). If the exchange coupling between radical and 4f electrons was purely Ising-type, then only two of the four excitations would be magnetic-dipole allowed and hence observable in the INS spectrum. These would correspond to a radical–spin flip, transitioning from the antiferromagnetically coupled ground pseudo-doublet to the ferromagnetically coupled excited states.
Magnetic properties and EPR spectroscopy
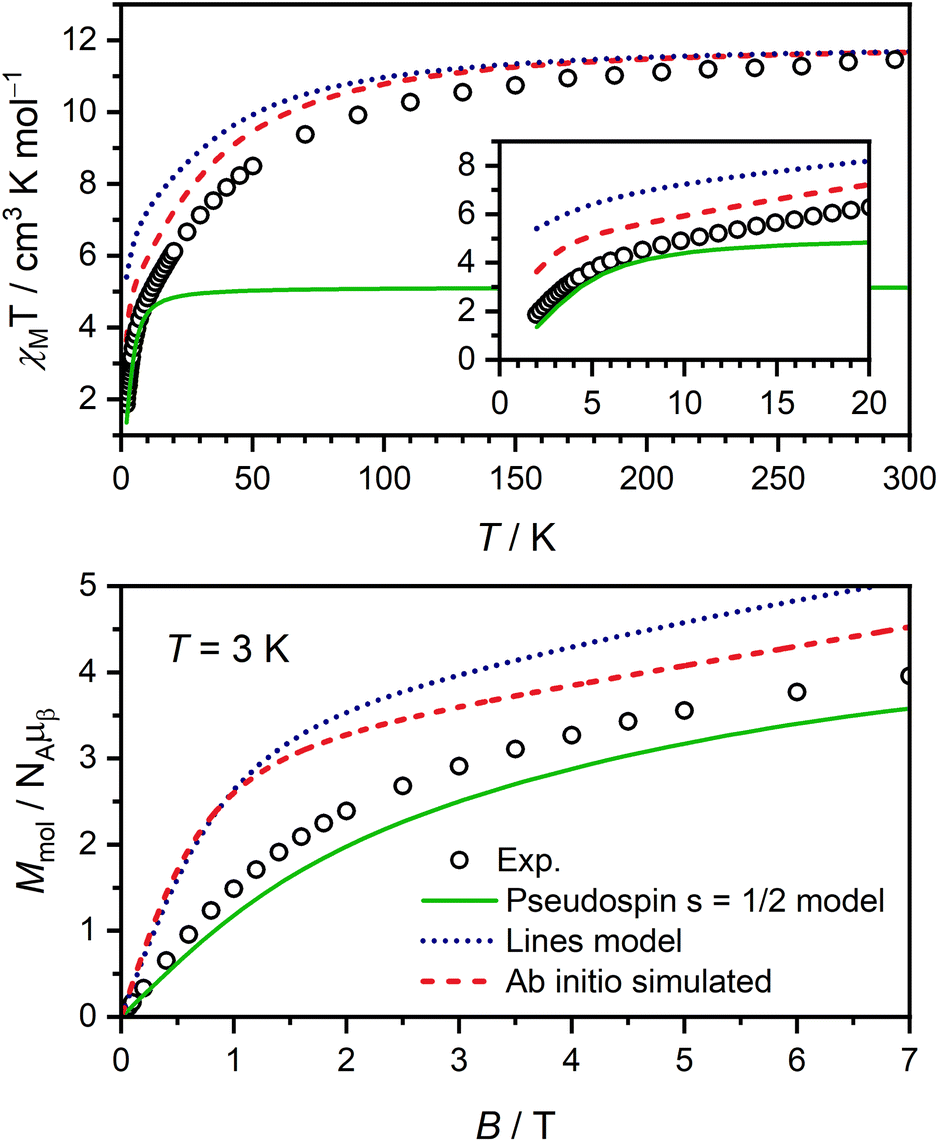
Magnetic susceptibility and magnetisation data were acquired for Er-trop and Er-dbsq (Fig. 2). The magnetic susceptibility data for both analogues agree with that reported in literature.60 For the Er-trop analogue, the experimental room temperature magnetic susceptibility temperature product (χMT) of 11.4 cm3 K mol−1 is in excellent agreement with the value of 11.3 cm3 K mol−1 simulated for a single Er(III) ion. With decreasing temperature, there is a gradual decrease in the χMT product due to depopulation of excited CF states, until 2 K.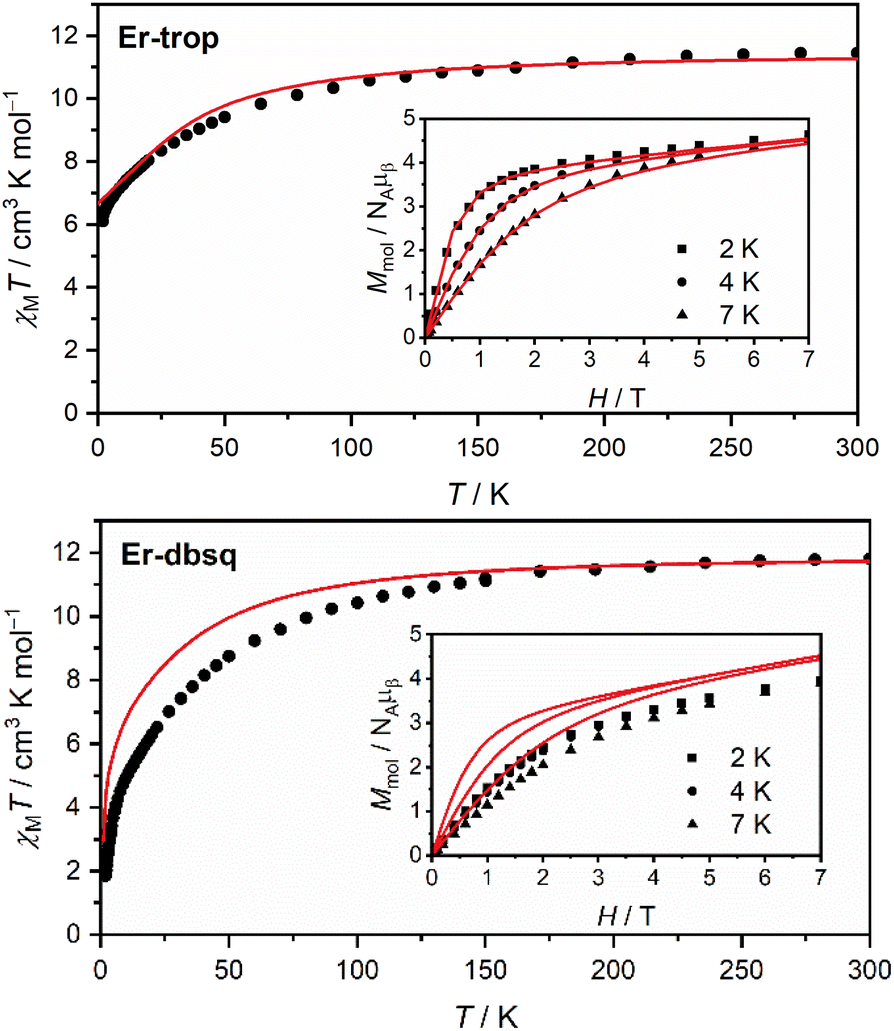 | ||
| Fig. 2 Static magnetic susceptibility data measured with Bdc = 0.1 T (black dots) and profiles simulated from electronic structure calculations (red lines) for Er-trop (top) and Er-dbsq (bottom). Inset: magnetisation data at the indicated temperatures (black data points) and profiles simulated from calculations (red lines). | ||
The magnetisation of Er-trop is not yet saturated at 7 T, reaching a value of 4.63 μB at 2.0 K, near the expected value of 4.5 for an Ising type Er(III) ion. The excellent reproduction of the experiment from calculations suggests that the predicted composition and energy of the low-lying electronic energy levels are accurate. To confirm the calculated wavefunction composition of the ground CF state for Er-trop, a low temperature X-band EPR spectrum was obtained on a powder sample (Fig. 3). The EPR spectrum of Er-trop is broad with an intense g‖ feature and a broad g⊥. The broad linewidths of the two spectral features are readily attributed to dipolar interactions between neighbouring molecules. To reduce this effect the diluted Er@Y-trop analogue was also measured, where the Er(III) ion is diluted 5% in the diamagnetic Y(III) analogue (Fig. S8†). The EPR spectrum was simulated for Seff = 1/2 with the calculated ground CF state effective g-values, using the Hamiltonian:
| ĤEPR = μBB·geff·Seff + Aeff(I·Seff) | (1) |
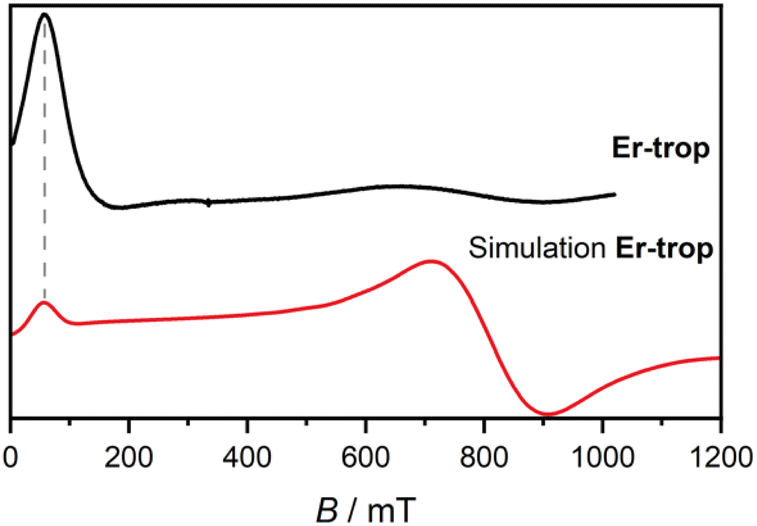 | ||
| Fig. 3 Solid state X-band EPR spectra measured at 5 K for Er-trop (black, top) with simulated spectrum from electronic structure calculations as described in the text (red, bottom). | ||
The spectrum obtained for Er@Y-trop shows similar spectral features which are far narrower than the original Er-trop sample. Here, the g-values determined are gx unobserved, gy = 0.83, and gz = 14.0, with smaller broadening evident through the obtained Lorentzian linewidth and H-strain values used (see ESI†). Through comparison of these two data sets, it is clear that the pure Er-trop system suffers from severe dipolar broadening and as such it is unclear whether the shift in g-values is a consequence of the broadening or a physical change resulting from the different matrix structure obtained via doping into the Y-trop analogue.41 Despite the near axial g-tensor determined from calculations Er-trop, the relative intensity of the peaks would be even worse when employing gx = gy = 0.83. The Er@Y-trop data are well fit for relative intensity with a rhombic model with gx unobserved and given the similar coordination environment, justifies the use of a rhombic model for Er-trop.
The χMT curve for Er-dbsq reaches a room temperature value of 11.7 cm3 K mol−1, which is consistent with an uncoupled Er(III) ion and the s = 1/2 dbsq˙− radical, and in agreement with the simulated value of 11.7 cm3 K mol−1. Below 150 K, there is a gradual decrease in the χMT product which is mostly reproduced by calculation, likely due to depopulation of excited electronic states, as in Er-trop. Below 15 K, there is a sharp decrease in both the experimental and simulated profiles, consistent with AF coupling between the Er(III) and dbsq˙− ligand. The experimentally observed trend towards zero is captured by calculation and is likely indicative of the singlet nature of the ground state, with a splitting of 0.3 meV calculated within the ground pseudo-doublet.
The high-field magnetisation value for Er-dbsq is again consistent with AF coupling between Er(III) and the dbsq˙− ligand, reaching a value of 3.96 μB at 2 K and 7 T, lower than that expected for an isolated Er(III) and measured for Er-trop. The slight deviation between experiment and theory in the magnetisation curves indicates the ground state properties are not perfectly reproduced from calculation. Nevertheless, the consistency with the susceptibility indicates a good reproduction of the overall splitting of the low-lying energy states.
To probe the effect of Er(III)–radical exchange coupling on the slow magnetic relaxation in this system, ac magnetic susceptibility measurements were performed. Slow magnetic relaxation in Er(III) compounds is not as widely observed as for Dy(III) compounds,64 and requires ligand environments that best stabilise the more prolate electron density of the higher mJ states, such as cyclooctatetraenyl ligands.65,66 A scan of the ac magnetic susceptibility for Er-trop at 2.0 K in varying applied dc fields (Fig. S18†) shows no out-of-phase component in Bdc = 0 T. Two applied fields of Bdc = 0.075 T and Bdc = 0.3 T were chosen to measure the variable temperature ac magnetic susceptibility. These data were compared with the doped sample Er@Y-trop, to identify the impact of nearest neighbour interactions. Data were interpreted using a combined relaxation model accounting for Orbach, Raman, Direct and QTM processes where appropriate as described by eqn (2).
| τ−1 = τ−10·exp(−Ueff/kT) + AT + CTn + τQTM−1 | (2) |
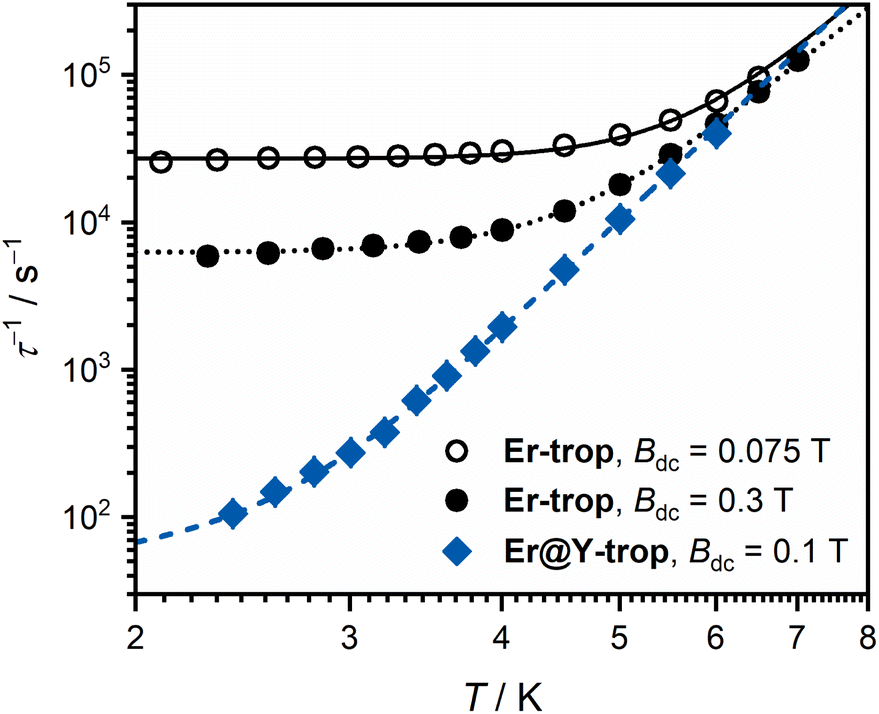 | ||
| Fig. 4 Relaxation rate plot for Er-trop in applied fields of 0.075 T (black open circles) and 0.3 T (black closed circles), and Er@Y-trop in an applied field of 0.1 T. Error bars are smaller than the data points. Lines are best fits to the data as described in the text. | ||
| Er-trop | Er@Y-trop | ||
|---|---|---|---|
| B dc | 0.075 T | 0.3 T | 0.1 T |
| C/s−1 K−n | 0.06(2) | 0.22(5) | 0.033(5) |
| n | 7.5(1) | 6.8(1) | 7.9(1) |
| τ −1 QTM/s−1 | 2.69(9) × 104 | 6.23(8) × 103 | — |
| A/s−1 K−1 | — | — | 30(3) |
Inelastic neutron scattering
In order to experimentally determine the electronic energy level splitting for Er-dbsq, we measured variable temperature INS of the partially deuterated compound Er-dbsqD. Spectra of Y-dbsqD were collected as a pseudo-diamagnetic analogue and were subtracted from the Er-dbsqD spectra. The corrected variable temperature INS spectra of Er-dbsqD are presented in Fig. 5. Four peaks are visible at both positive and negative energy transfer. Three peaks, a, I, and II, are assigned as cold transitions on the neutron energy loss side of the INS spectrum, and the corresponding peaks a′, I′, and II′ appear with increasing temperature on the neutron energy gain side of the spectra. An additional peak is observed, marked with an asterisk in Fig. 5. This peak can be unambiguously assigned as a phononic peak from analysis of the Q-dependence, which follows the Q2 dependence typical of a phonon (Fig. S15†). We therefore exclude this excitation from our further analysis.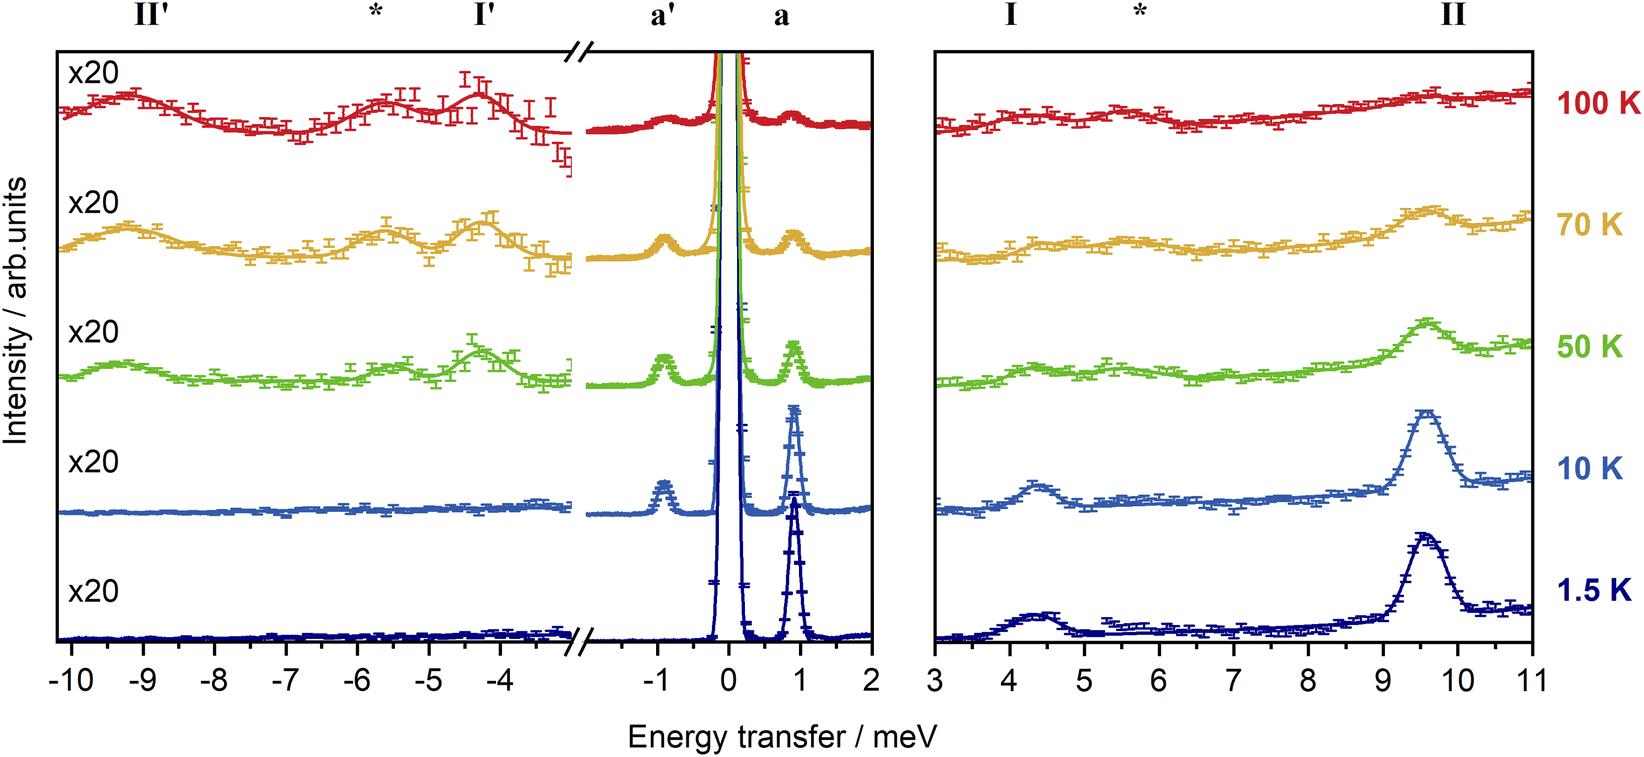 | ||
| Fig. 5 Variable temperature INS spectra of Er-dbsqD corrected for the diamagnetic contribution with subtraction of Y-dbsqD data, measured with λ = 4.69 Å and integrated over 0.28 Å−1 ≤ Q ≤ 1.95 Å−1 (left), and λ = 2.34 Å integrated over 1.30 Å−1 ≤ Q ≤ 3.65 Å−1 (right). The intensities at the two wavelengths are normalised to the elastic line intensity over the corresponding Q range. Solid lines are a sum of Gaussian fits to the observed peaks. | ||
The three remaining excitations are assigned as magnetic from analysis of their Q-dependence, with I and II following the magnetic form factor dependence (I ∝ F2(Q)) expected of a CF transition of Er(III). Additional confirmation of the three magnetic excitations can be obtained by analysis of the generalised phonon density of states (ESI† discussion).
The CF peak I is a weak peak observed at E = 4.36(2) meV, most apparent on the neutron energy loss side of the variable temperature λ = 2.34 Å spectra. Peak positions (and corresponding errors) are determined from fitting the 1.5 K data on the neutron energy loss side. Peak I has the temperature dependence expected of a magnetic excitation from the ground state – decreasing in intensity with increasing temperature as the ground state depopulates, while the corresponding peak I′ increases in intensity with increasing temperature. The next lowest energy CF transition II, at E = 9.55(1) meV, is observed on the neutron energy loss side of the spectrum in the λ = 2.34 Å spectra, with a corresponding peak II′ observed on the neutron energy gain side of the spectrum at elevated temperatures. As with the other CF peak, the temperature dependencies of II and II′ are consistent with magnetic transitions to and from the ground state and are assigned as CF transitions to a second excited CF state.
The lowest energy peak a (and a′) is observed at E = 0.918(6) meV (and E = −0.918 meV). Peak a has a temperature dependence expected of a magnetic excitation from the ground state. From inspection of the CF splitting of the Er(III) determined for Er-trop, it is unlikely that this excitation stems from a CF-like transition. Additionally, the magnitude of the magnetic exchange splitting is consistent with that observed in Er-dbsq from calculations (Table 2). The Q-dependence of an exchange transition involving two exchange-coupled metal ions is expected to follow a dependence that relies on the magnetic form factors of the two interacting spins, with an interference term, typically giving rise to a pronounced oscillatory behaviour. However, for the very common case of a radical that is coupled to a metal ion with strong axial anisotropy via a pure Ising exchange mechanism, such a transition would be dominated by a radical spin–flip, hence the Q-dependence would be dominated by the form factor of the radical spin only. The Q-dependence of peak a, while not inconsistent with an exchange interaction, shows neither the typical oscillations in intensity with Q observed for dinuclear metal complexes in literature,68–70 nor the fast-decaying behaviour expected for a pure radical spin flip transition i.e. for an Ising 4f–radical exchange mechanism (Fig. S12†). The jump diffusion model used for intermolecular exchange in a Co(II)–semiquinonate compound71 shows reasonable agreement when calculated with a distance of 12 Å, however, this spacing is not consistent with the metal–radical separation nor the intermolecular separation of metal ions. As the form factor falloff for a delocalised organic radical ligand is expected to be very different to that of the radially contracted f-orbitals of a Ln(III) ion, the interference mechanism between the two coupled spin moieties is not simple to predict without further detailed modelling. While the transition can be tentatively assigned as a magnetic exchange transition – a transition between the AF and F states from the ground CF doublet of Er(III) split by the magnetic exchange interaction with the dbsq˙− radical, additional modelling of the experimental Q-dependence will be presented following the electronic structure calculations to better qualify this assignment.
Electronic structure of Er-dbsq
First, we analyse the magnetic exchange coupling in Er-dbsq. Upon assignment of the INS peak a, we have an exchange gap energy ΔE = 0.918(6) meV. The data available allow for only the isotropic exchange coupling to be determined. Magnetic exchange coupling in orbitally degenerate lanthanoid ions can be treated using several methods. We begin by using the Lines model,72 in which the true spin of the Ln(III) ion in the |L,mL,S,mS〉 basis is used. The Lines model has been widely used for modelling exchange interactions in Ln(III) systems.73–77 In the case of Er-dbsq, we couple the SEr = 3/2 of Er(III) to the SSQ = 1/2 of the dbsq˙− ligand with the Hamiltonian:| Ĥex = −2JexŜEr·ŜSQ | (3) |
Using ΔE = −4Jex, a Jex = −0.23 meV is obtained. This, and the CF parameters (Table S5†) obtained from the electronic structure calculations on Er-trop to describe the CF splitting of the Er(III) ion are then used to simulate χMT and M vs. H, shown in Fig. 6. The Lines model provides a reasonable description of the general temperature dependence of the magnetic susceptibility but fails to accurately describe the lowest energy magnetic properties correctly. The insufficiency of the Lines model has been discussed for several Ln(III) systems.74,75,78,79
 | ||
| Fig. 6 Comparison of experimental static magnetic data for Er-dbsq with the ab initio calculated profiles (red dashed lines), the Lines model (blue dotted lines) and pseudospin model (green lines) as described in the text. | ||
We then analyse the magnetic exchange coupling using a pseudospin 1/2 model, where the Er(III) is treated as an effective Seff = 1/2 spin to couple to the dbsq˙−SSQ = 1/2, with geff values of the ground pseudo-doublet as measured by EPR used to model the anisotropy at the Er(III) centre (gx = 0.01, gy = 0.8, and gz = 12.3). Here we consider the exchange with the ground pseudo-doublet only (Ĥ1/2 = −2J1/2Ŝeff⋅ŜSQ). We use J1/2 = −0.46 meV from the observed INS transition and the experimentally determined geff values from EPR measurements. The simulations of the magnetisation curves and the low temperature χMT are in excellent agreement with the experimental data, suggesting that the calculated isotropic exchange coupling correctly describes the exchange coupling between the ground CF doublet of Er(III) and dbsq˙−.
The overall magnitude of the exchange coupling (Jex = −0.23 meV = −1.8 cm−1) is similar to the Gd(III) analogue (Jex = −5.7 cm−1) determined previously.46 One would expect that varying the Ln(III) would change the strength of the coupling within an isostructural series, and this has indeed been observed both computationally and experimentally.49,58 Often the magnetic exchange coupling in the majority of Ln–radical systems is only determined for the Gd(III) analogue – these results highlight the need to experimentally verify the magnetic exchange coupling for each Ln(III). It is worth noting that these current INS measurements cannot be used to unambiguously determine the sign of the magnetic exchange coupling, which instead has been determined from magnetometry. To confirm this by INS, either single crystal measurements or INS in an applied magnetic field would be required.80–83
Looking to the simulated electronic energy levels calculated using PHI,84 the exchange coupling within the Lines model results in the splitting of each KD of the Er(III) (as determined by calculation for Er-trop) into two sets of doublets. This is consistent with the assumption that the coupling is in the weak exchange limit. The Lines model and the energy level splitting from electronic structure calculations on Er-dbsq are presented in Fig. 7. From comparison of the experimentally determined splitting by INS, the origin of the INS transitions can then be assigned.
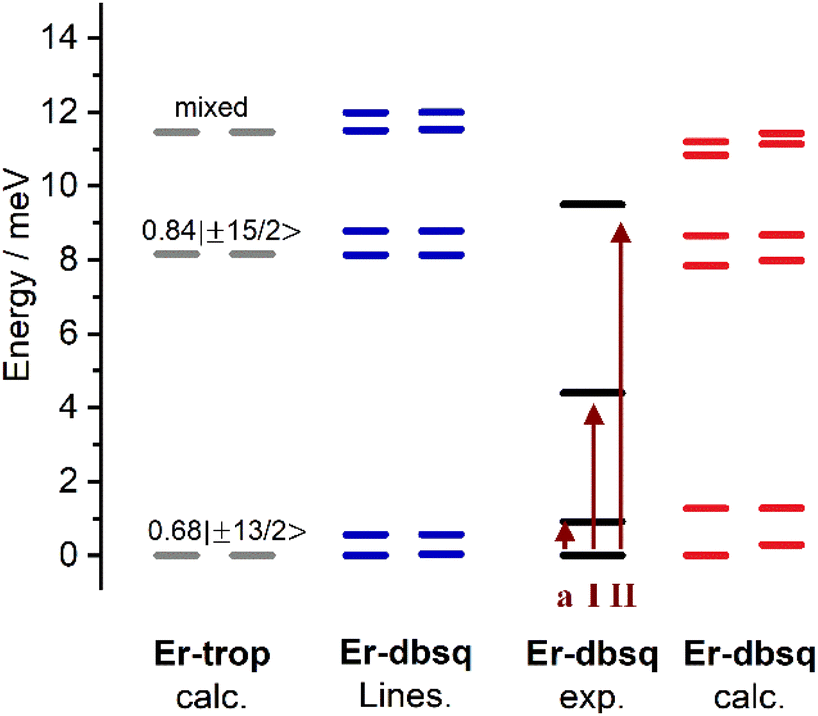 | ||
| Fig. 7 From left to right: electronic energy level splitting of the lowest CF pseudo-doublets as calculated for Er-trop (grey); electronic energy level splitting calculated for Er-dbsq as described in the text with the Lines model (blue); experimentally determined splitting for Er-dbsq with arrows indicating observed cold INS transitions (black with dark red arrows); and singlets calculated ab initio for Er-dbsq (red). Wavefunction compositions (mJ contributions greater than 10%) are indicated for Er-trop. | ||
Within the Lines model, the small exchange splitting dictates that peak I (and I′) must be a transition between the ground CF state, which in Er-trop is majority mJ = |±13/2〉 and the next CF state, of majority composition mJ = |±15/2〉, consistent with INS selection rules (ΔmJ = 0, ±1), Fig. 8. We assign the higher energy peak II (and II′) as a transition between the ground CF state and the next highest CF state, originating from the 2nd lowest excited KD in Er-trop, which is a state of highly mixed wavefunction composition with an 18% contribution of mJ = |±11/2〉, which would be allowed by INS selection rules. Worth noting is that a transition between the first excited CF level and the second CF level is not allowed by the INS selection rules, and as such is not expected to be observed, even with thermal population of these states. Within the Lines model, one would expect the transitions between the lower energy AF state of each CF state, as well as transitions between the higher energy F states of each CF state. As the energies of these transitions (AF → AF and F → F) would be approximately the same energy in the case of isotropic exchange, this is unlikely to be observed as additional splitting of peaks in the INS spectrum.
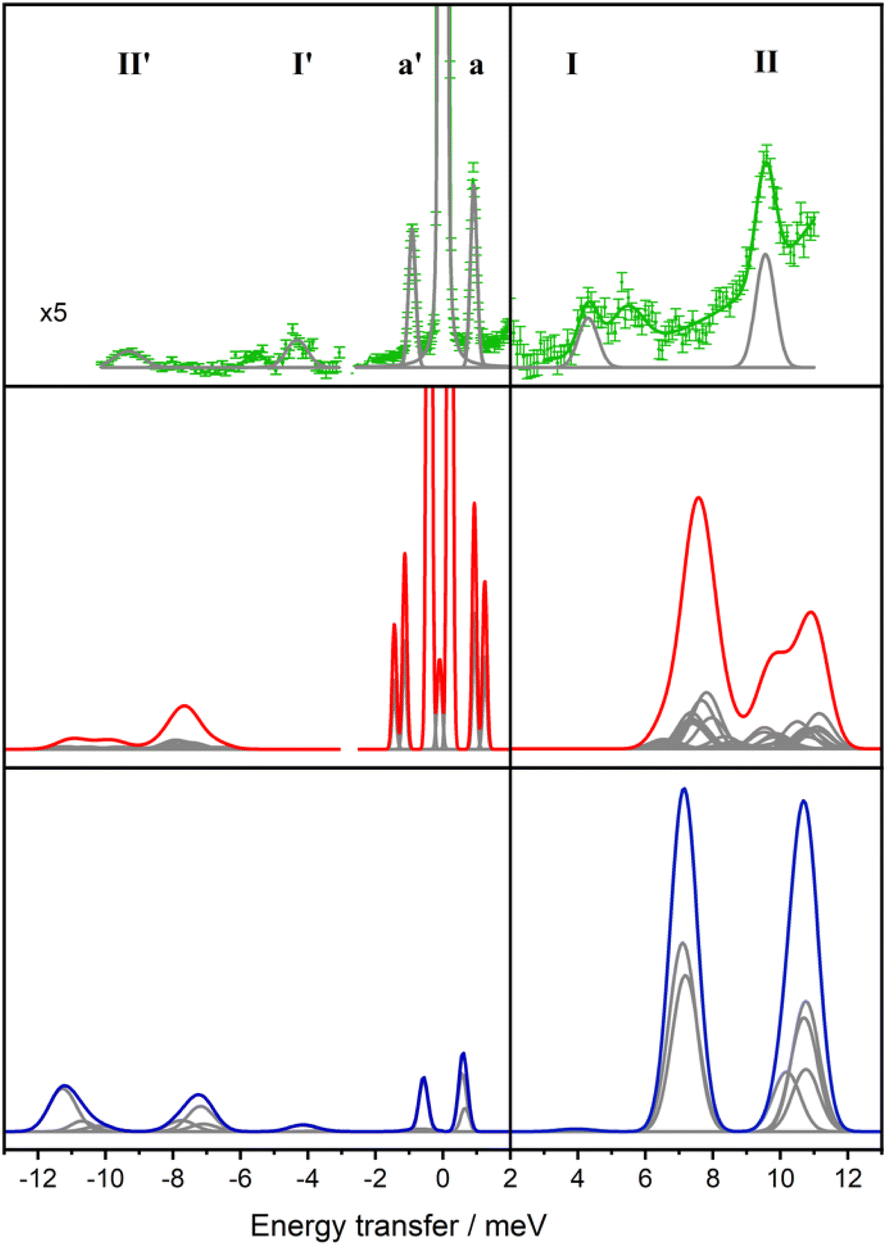 | ||
| Fig. 8 Experimental INS spectra of Er-dbsqD (top, green), spectrum simulated from electronic structure calculations (middle, red), spectrum simulated from Lines model (blue), all at 50 K. Grey curves are individual Gaussian contributions. | ||
The ab initio calculated splitting gives a similar overall profile to the Lines model, splitting the KDs into pairs of pseudo-doublets and we again assign the transitions as above. However, as some doublets from CASSCF show significant splitting, the observation of distinct transitions would now be apparent.34,58
To further compare the experimental INS data with the calculated properties of Er-dbsq, the INS spectra are simulated at 50 K and shown in Fig. 8. For the electronic structure calculations, the magnetic moment matrix element components as calculated for the spin–orbit basis from the Single_Aniso module are used to approximate the transition probabilities. Each transition is then weighted by the Boltzmann population of the initial state at 50 K and convoluted with the instrument resolution at that energy.
The simulated spectrum at 50 K reveals transitions at 1 and 1.3 meV, and two regions of moderate intensity around 8 meV and 11 meV. The Er-dbsq calculation produces a spectrum with similar features to the experimental data, giving an excellent agreement with the lowest lying peak a and good agreement with peak II. However, the transitions corresponding to peak I do not align well with the experimental data, with peak I predicted at higher energy than experimentally observed.
For the Lines model, the transition probabilities calculated in PHI84 are weighted by the Boltzmann population of the initial state and convoluted with the instrument resolution. For the Lines spectrum, it is evident that this simple isotropic Lines model displays shortcomings in the simultaneous description of the transition probabilities of the exchange transitions and the CF transitions, in that it predicts larger transition probabilities for the CF transitions than for the exchange transitions, as one would naively expect if CF transitions were solely dominated by the 13/2 → 15/2 components, while the exchange transitions were dominated solely by a radical spin flip process. However, as the analysis of the Q-dependence of the exchange transitions will show, the exchange states are of a more mixed 4f-radical nature, a feature that can only be recovered in the simplest approximation by relaxing the requirement of an isotropic Lines model (vide infra).
Both models predict a larger overall electronic energy level splitting than observed with similar levels of agreement with the experimental energies and intensities. As the transitions in Er-dbsq are at characteristically similar energies to the CF states of Er-trop, it implies the CF splitting energy is overestimated by CASSCF-SO calculations. This overestimation of the overall electronic energy level splitting found by calculation has been observed for other Ln(III) compounds, particularly Er systems, with the ab initio CF splitting sometimes adjusted with a scaling factor to accurately reproduce the experimental data.35
The final comparison necessary with computational results is to simulate a theoretical Q-dependence resulting from the interaction of the 4f and radical electrons. In an attempt to interpret the Q-dependence of the low-lying feature, we first introduce an idealised pure Ising exchange model. The major mj contributions from the Er-trop calculation are used to build a Hilbert space to model only the lowest two pseudo-doublets arising from the F and AF coupling with the radical (Fig. S28; see ESI† Model 1 for full details). From this idealised model, we observe that a transition involving solely a radical flip cannot be responsible for the experimental Q-dependence measured, as by virtue of the delocalised character of the π-spin density, this would fall off too rapidly with respect to what is observed (Fig. S29†).
Extending to an ab initio-based model Hilbert space (see ESI† Model 2 for full details), we now consider the mixed nature of the wavefunction, where ab initio results for Er-trop showed only 68%|±13/2〉 contribution to the ground state. We firstly reproduce the nature of the lowest lying four states to focus on the Q-dependence of those transitions. This is done by introducing anisotropic exchange parameters in the |mj, ms〉 product basis in order to reproduce the energy splitting of the ab initio exchange manifold more accurately than with the previous Lines model. We note that this model Hamiltonian results in a qualitatively similar wavefunction decomposition of the ground and excited pseudo-doublets (Fig. S30†). Full details for the calculation of the magnetic neutron scattering form factor arising from this model are described in the ESI.†
Arising from the model is an interference term that originates due to contributions from both the Er(III) and radical electrons. As such, the calculated form factor for transitions between the lowest exchange states now show two qualitatively new features: (i) a much slower drop-off than would be expected for purely radical or purely Er(III) based excitations, and (ii) a maximum peak predicted around Q = 0.75 Å−1, similar to the experimental data (Fig. 9 and S33†).
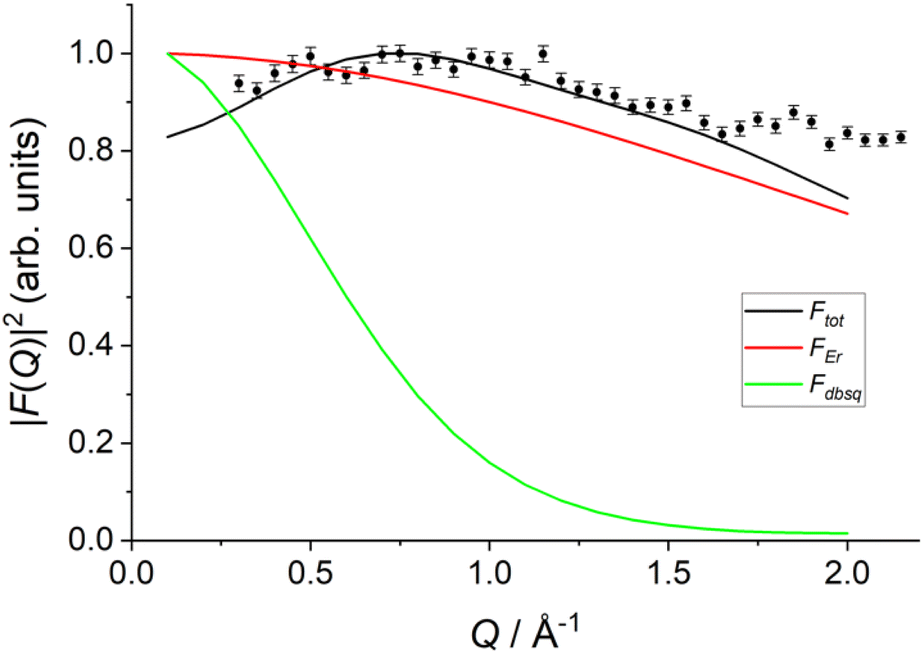 | ||
Fig. 9 Calculated form factor  estimated using eqn S10† and Model 2 for the 1 → 3, 4 transition (black line) compared to experimental data (black circles), Er(III) only form factor (red line) and dbsq˙− only form factor (green line). estimated using eqn S10† and Model 2 for the 1 → 3, 4 transition (black line) compared to experimental data (black circles), Er(III) only form factor (red line) and dbsq˙− only form factor (green line). | ||
It should be stressed that this resultant interference bears the fingerprint of an intrinsically non-Ising exchange interaction between the radical and 4f electrons, which results in a wavefunction where ms-spin states on the radical are entangled with the mixed mj-superpositions describing the KDs of the Er(III) ion. Thus, even for the relatively weak exchange observed here (cf. literature Ln–radical exchange Table S1†), a far more complex mixing of states is occurring between the Er and radical orbitals, which is contrary to an expected Ising-like exchange for a 4f–π system. The relative complex phases of the wavefunction coefficients expanded on the |mj, ms〉 product basis encoded in the transition reduced density matrices  and
and  (eqn S9†), determine a non-trivial interference term
 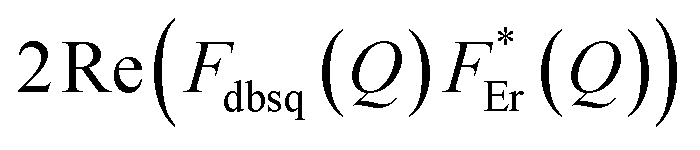 , resulting in the predicted oscillatory behaviour.
Conclusions
Herein, we report a combined spectroscopic, computational and magnetometric study of the two related compounds Er-trop and Er-dbsq. The energy level splitting of Er-trop with the diamagnetic ligand and radical ligand analogue Er-dbsq have been calculated ab initio. The simulated magnetic and spectroscopic properties from the calculations are in good agreement with experiment and allow for the determination of the lowest energy electronic levels in these compounds. Additionally, the Er(III)-semiquinonate magnetic exchange coupling was directly determined to be Jex = −0.23 meV from INS and magnetic measurements. The agreement of this exchange coupled model with experiment, and the similarity with the CASSCF-SO calculations, indicates accurate determination of the magnetic exchange coupling in this low-symmetry compound. This result highlights the capability of ab initio computations to handle the exchange between a Ln(III) ion with significant spin–orbit coupling and an organic radical ligand.We show slow magnetic relaxation for Er-trop is dominated by Raman relaxation and QTM, where the QTM is related to the dipolar interactions with neighbouring molecules. In the Er-dbsq analogue the slow relaxation is quenched completely by exchange coupling with the radical ligand, due to the loss of ground state degeneracy. The moderate coupling strength here is evidently beyond the weakly coupled limit, which can improve SMM behaviour through introduction of an exchange bias.
Spectroscopic determination of lanthanoid–radical magnetic exchange coupling is rare, as is the use of ab initio electronic structure calculations on systems with coupling to orbitally degenerate Ln(III) ions. Comparison of the calculated magnetic and spectroscopic properties from the Lines and pseudospin models with those simulated from full CASSCF/RASSI-SO calculations on the Er-dbsq system reinforce the need for high level calculations to accurately reproduce the low temperature properties of Ln(III)–radical systems. This work represents the first semi ab initio reproduction of the oscillatory Q-dependence behaviour for a Ln–radical molecule, which verifies the non-Ising-like, high degree of mixing between the Er 4f and radical π electrons. Thus, for the first time an accurate image of the transition spin and orbital current density triggered by the INS excitation has been determined for a Ln–radical system.
Data availability
Crystallographic data for all compounds have been deposited with the CCDC under deposition numbers 2287861–2287864 and can be obtained from https://www.ccdc.cam.ac.uk/. Computational output files are available at https://doi.org/10.26188/25222571. Other data are available from the authors upon reasonable request.Author contributions
M. A. D. prepared and measured the samples and wrote the draft manuscript. M. J. G. performed the calculations and spectral interpretation with support from A. S. and S. C. A. S. developed the models for Q-dependence simulation and interpretation of the INS exchange transitions. L. S. performed EPR and modelling interpretation, A. M. K.-H. prepared the deuterated ligands. R. A. M., M. A. D. and S. C. performed the INS measurements and interpreted the data. R. A. M., A. S. and C. B. supervised the project.Conflicts of interest
There are no conflicts to declare.Acknowledgements
M. A. D. acknowledges financial support from AINSE Limited (AINSE Post-Graduate Research Award) and the Australian Government for a Research Training Program stipend. C. B., R. A. M., and A. S. thank the Australian Research Council for funding (DP170100034 and DP220100398). L. S. acknowledges the financial support of INFN through NAMASSTE project. A. S. acknowledges financial support via the grant P-DiSC # BIRD2023-UNIPD, from the Department of Chemical Sciences of the University of Padova. We acknowledge the support of the Australian Centre for Neutron Scattering, Australian Nuclear Science and Technology Organisation (P8235 and access to PPMS measurements) and the Australian Government through the National Collaborative Research Infrastructure Strategy, in providing the neutron research infrastructure used in this work. The National Deuteration Facility is partly supported by the National Collaborative Research Infrastructure Strategy – an initiative of the Australian Government. This research was supported by use of the Nectar Research Cloud, a collaborative Australian research platform supported by the NCRIS-funded Australian Research Data Commons (ARDC). This research was supported by The University of Melbourne's Research Computing Services and the Petascale Campus Initiative. The authors would like to thank TrACEES and Augustine Doronila for help and access to the ICP-OES instrument.Notes and references
- M. J. Giansiracusa, G. K. Gransbury, N. F. Chilton and D. P. Mills, in Encyclopedia of Inorganic and Bioinorganic Chemistry, ed. R. A. Scott, John Wiley & Sons Ltd, Chichester West Sussex, UK, 2021, p. eibc2784 Search PubMed.
- A. Zabala-Lekuona, J. M. Seco and E. Colacio, Coord. Chem. Rev., 2021, 441, 213984 CrossRef CAS.
- R. Sessoli, H. L. Tsai, A. R. Schake, S. Wang, J. B. Vincent, K. Folting, D. Gatteschi, G. Christou and D. N. Hendrickson, J. Am. Chem. Soc., 1993, 115, 1804–1816 CrossRef CAS.
- S. T. Liddle and J. van Slageren, Chem. Soc. Rev., 2015, 44, 6655–6669 RSC.
- F. Guo, B. M. Day, Y. Chen, M. Tong, A. Mansikkamäki and R. A. Layfield, Science, 2018, 362, 1400–1403 CrossRef CAS PubMed.
- C. A. P. Goodwin, F. Ortu, D. Reta, N. F. Chilton and D. P. Mills, Nature, 2017, 548, 439–442 CrossRef CAS PubMed.
- F.-S. S. Guo, B. M. Day, Y.-C. C. Chen, M.-L. L. Tong, A. Mansikkamäki and R. A. Layfield, Angew. Chem., Int. Ed., 2017, 56, 11445–11449 CrossRef CAS PubMed.
- K. Randall McClain, C. A. Gould, K. Chakarawet, S. J. Teat, T. J. Groshens, J. R. Long and B. G. Harvey, Chem. Sci., 2018, 9, 8492–8503 RSC.
- C. A. Gould, K. R. McClain, D. Reta, J. G. C. Kragskow, D. A. Marchiori, E. Lachman, E.-S. Choi, J. G. Analytis, R. D. Britt, N. F. Chilton, B. G. Harvey and J. R. Long, Science, 2022, 375, 198–202 CrossRef CAS PubMed.
- J.-L. Liu, Y.-C. Chen and M.-L. Tong, Chem. Soc. Rev., 2018, 47, 2431–2453 RSC.
- S. Demir, I.-R. Jeon, J. R. Long and T. D. Harris, Coord. Chem. Rev., 2015, 289–290, 149–176 CrossRef CAS.
- D. Gatteschi, R. Sessoli and L. Sorace, in Handbook on the Physics and Chemistry of Rare Earths, ed. J.-C. G. Bünzli and V. K. Pecharsky, Elsevier, Amsterdam, 2016, vol. 50, pp. 91–139 Search PubMed.
- P. Zhang, R. Nabi, J. K. Staab, N. F. Chilton and S. Demir, J. Am. Chem. Soc., 2023, 145, 9152–9163 CrossRef CAS PubMed.
- F. Benner and S. Demir, Chem. Sci., 2022, 13, 5818–5829 RSC.
- C. A. Gould, E. Mu, V. Vieru, L. E. Darago, K. Chakarawet, M. I. Gonzalez, S. Demir and J. R. Long, J. Am. Chem. Soc., 2020, 142, 21197–21209 CrossRef CAS PubMed.
- L. Zhang, Y.-Q. Zhang, P. Zhang, L. Zhao, M. Guo and J. Tang, Inorg. Chem., 2017, 56, 7882–7889 CrossRef CAS PubMed.
- T. Morita, M. Damjanović, K. Katoh, Y. Kitagawa, N. Yasuda, Y. Lan, W. Wernsdorfer, B. K. Breedlove, M. Enders and M. Yamashita, J. Am. Chem. Soc., 2018, 140, 2995–3007 CrossRef CAS PubMed.
- H.-D. Li, S.-G. Wu and M.-L. Tong, Chem. Commun., 2023, 59, 6159–6170 RSC.
- D. Maniaki, E. Pilichos and S. P. Perlepes, Front. Chem., 2018, 6, 461–488 CrossRef CAS PubMed.
- P. Zhang, F. Benner, N. F. Chilton and S. Demir, Chem, 2022, 8, 717–730 CAS.
- F. Benner, L. La Droitte, O. Cador, B. Le Guennic and S. Demir, Chem. Sci., 2023, 14, 5577–5592 RSC.
- F. Benner and S. Demir, Inorg. Chem. Front., 2023, 10, 4981–4992 RSC.
- F. Delano, F. Benner, S. Jang and S. Demir, Inorg. Chem., 2023, 62, 14604–14614 CrossRef PubMed.
- M. J. Giansiracusa, E. Moreno-Pineda, R. Hussain, R. Marx, M. Martínez Prada, P. Neugebauer, S. Al-Badran, D. Collison, F. Tuna, J. van Slageren, S. Carretta, T. Guidi, E. J. L. McInnes, R. E. P. Winpenny and N. F. Chilton, J. Am. Chem. Soc., 2018, 140, 2504–2513 CrossRef CAS PubMed.
- L. Spillecke, C. Koo, O. Maximova, V. S. Mironov, V. A. Kopotkov, D. V. Korchagin, A. N. Vasiliev, E. B. Yagubskii and R. Klingeler, Dalton Trans., 2021, 50, 18143–18154 RSC.
- J. Mayans, L. Tesi, M. Briganti, M.-E. Boulon, M. Font-Bardia, A. Escuer and L. Sorace, Inorg. Chem., 2021, 60, 8692–8703 CrossRef CAS PubMed.
- B. M. Flanagan, P. V. Bernhardt, E. R. Krausz, S. R. Lüthi and M. J. Riley, Inorg. Chem., 2001, 40, 5401–5407 CrossRef CAS PubMed.
- Y. Bi, C. Chen, Y.-F. Zhao, Y.-Q. Zhang, S.-D. Jiang, B.-W. Wang, J.-B. Han, J.-L. Sun, Z.-Q. Bian, Z.-M. Wang and S. Gao, Chem. Sci., 2016, 7, 5020–5031 RSC.
- M. A. Sørensen, U. B. Hansen, M. Perfetti, K. S. Pedersen, E. Bartolomé, G. G. Simeoni, H. Mutka, S. Rols, M. Jeong, I. Zivkovic, M. Retuerto, A. Arauzo, J. Bartolomé, S. Piligkos, H. Weihe, L. H. Doerrer, J. van Slageren, H. M. Rønnow, K. Lefmann and J. Bendix, Nat. Commun., 2018, 9, 1292 CrossRef PubMed.
- M. Perfetti, M. Gysler, Y. Rechkemmer-Patalen, P. Zhang, H. Taştan, F. Fischer, J. Netz, W. Frey, L. W. Zimmermann, T. Schleid, M. Hakl, M. Orlita, L. Ungur, L. Chibotaru, T. Brock-Nannestad, S. Piligkos and J. van Slageren, Chem. Sci., 2019, 10, 2101–2110 RSC.
- D. Guettas, F. Gendron, G. Fernandez Garcia, F. Riobé, T. Roisnel, O. Maury, G. Pilet, O. Cador and B. Le Guennic, Chem.– Eur. J., 2020, 26, 4389–4395 CrossRef CAS PubMed.
- Y. Rechkemmer, J. E. Fischer, R. Marx, M. Dörfel, P. Neugebauer, S. Horvath, M. Gysler, T. Brock-Nannestad, W. Frey, M. F. Reid and J. van Slageren, J. Am. Chem. Soc., 2015, 137, 13114–13120 CrossRef CAS PubMed.
- D. H. Moseley, S. E. Stavretis, Z. Zhu, M. Guo, C. M. Brown, M. Ozerov, Y. Cheng, L. L. Daemen, R. Richardson, G. Knight, K. Thirunavukkuarasu, A. J. Ramirez-Cuesta, J. Tang and Z.-L. Xue, Inorg. Chem., 2020, 59, 5218–5230 CrossRef CAS PubMed.
- M. Vonci, M. J. Giansiracusa, R. W. Gable, W. Van den Heuvel, K. Latham, B. Moubaraki, K. S. Murray, D. Yu, R. A. Mole, A. Soncini and C. Boskovic, Chem. Commun., 2016, 52, 2091–2094 RSC.
- M. Vonci, M. J. Giansiracusa, W. Van den Heuvel, R. W. Gable, B. Moubaraki, K. S. Murray, D. Yu, R. A. Mole, A. Soncini and C. Boskovic, Inorg. Chem., 2017, 56, 378–394 CrossRef CAS PubMed.
- M. A. Dunstan, R. A. Mole and C. Boskovic, Eur. J. Inorg. Chem., 2019, 8, 1090–1105 CrossRef.
- A. M. Atkin, M. J. Giansiracusa, S. Calvello, E. Rousset, R. W. Gable, W. Phonsri, K. S. Murray, J. K. Howard, A. Soncini, R. A. Mole and C. Boskovic, Inorg. Chem., 2023, 62, 1141–1155 CrossRef CAS PubMed.
- M. A. Dunstan, M. Cagnes, W. Phonsri, K. S. Murray, R. A. Mole and C. Boskovic, Aust. J. Chem., 2022, 75, 595–609 CrossRef CAS.
- M. A. Dunstan, M. J. Giansiracusa, M. Vonci, S. Calvello, D. Yu, A. Soncini, C. Boskovic and R. A. Mole, Chem. Sci., 2023, 14, 3990–4001 RSC.
- M. J. Giansiracusa, M. Vonci, W. Van den Heuvel, R. W. Gable, B. Moubaraki, K. S. Murray, D. Yu, R. A. Mole, A. Soncini and C. Boskovic, Inorg. Chem., 2016, 55, 5201–5214 CrossRef CAS PubMed.
- M. J. Giansiracusa, E. Moreno-Pineda, R. Hussain, R. Marx, M. Martínez Prada, P. Neugebauer, S. Al-Badran, D. Collison, F. Tuna, J. van Slageren, S. Carretta, T. Guidi, E. J. L. McInnes, R. E. P. Winpenny and N. F. Chilton, J. Am. Chem. Soc., 2018, 140, 2504–2513 CrossRef CAS PubMed.
- M. J. Giansiracusa, S. Al-Badran, A. K. Kostopoulos, G. F. S. Whitehead, E. J. L. McInnes, D. Collison, R. E. P. Winpenny and N. F. Chilton, Inorg. Chem. Front., 2020, 7, 3909–3918 RSC.
- M. L. Baker, T. Tanaka, R. Murakami, S. Ohira-Kawamura, K. Nakajima, T. Ishida and H. Nojiri, Inorg. Chem., 2015, 54, 5732–5738 CrossRef CAS PubMed.
- K. Prša, J. Nehrkorn, J. Corbey, W. Evans, S. Demir, J. Long, T. Guidi and O. Waldmann, Magnetochemistry, 2016, 2, 45 CrossRef.
- M. A. Dunstan, D. S. Brown, L. Sorace, R. A. Mole and C. Boskovic, Chem.– Asian J., 2022, 17, e2022003 CrossRef PubMed.
- A. Caneschi, A. Dei, D. Gatteschi, L. Sorace and K. Vostrikova, Angew. Chem., Int. Ed., 2000, 39, 246–248 CrossRef CAS PubMed.
- J. D. Rinehart, M. Fang, W. J. Evans and J. R. Long, J. Am. Chem. Soc., 2011, 133, 14236–14239 CrossRef CAS PubMed.
- J. D. Rinehart, M. Fang, W. J. Evans and J. R. Long, Nat. Chem., 2011, 3, 538–542 CrossRef CAS PubMed.
- S. Demir, M. I. Gonzalez, L. E. Darago, W. J. Evans and J. R. Long, Nat. Commun., 2017, 8, 2144 CrossRef PubMed.
- F. Liu, D. S. Krylov, L. Spree, S. M. Avdoshenko, N. A. Samoylova, M. Rosenkranz, A. Kostanyan, T. Greber, A. U. B. Wolter, B. Büchner and A. A. Popov, Nat. Commun., 2017, 8, 16098 CrossRef CAS PubMed.
- F. Liu, L. Spree, D. S. Krylov, G. Velkos, S. M. Avdoshenko and A. A. Popov, Acc. Chem. Res., 2019, 52, 2981–2993 CrossRef CAS PubMed.
- F. Liu, G. Velkos, D. S. Krylov, L. Spree, M. Zalibera, R. Ray, N. A. Samoylova, C.-H. Chen, M. Rosenkranz, S. Schiemenz, F. Ziegs, K. Nenkov, A. Kostanyan, T. Greber, A. U. B. Wolter, M. Richter, B. Büchner, S. M. Avdoshenko and A. A. Popov, Nat. Commun., 2019, 10, 571 CrossRef CAS PubMed.
- C. A. Gould, J. Marbey, V. Vieru, D. A. Marchiori, R. David Britt, L. F. Chibotaru, S. Hill and J. R. Long, Nat. Chem., 2021, 13, 1001–1005 CrossRef CAS PubMed.
- Q.-C. Luo and Y.-Z. Zheng, Magnetochemistry, 2021, 7, 107 CrossRef CAS.
- N. Mavragani, A. A. Kitos, A. Mansikkamäki and M. Murugesu, Inorg. Chem. Front., 2023, 10, 259–266 RSC.
- E. Rousset, M. Piccardo, R. W. Gable, M. Massi, L. Sorace, A. Soncini and C. Boskovic, Inorg. Chem., 2022, 61, 14004–14018 CrossRef CAS PubMed.
- F. Liu, D. S. Krylov, L. Spree, S. M. Avdoshenko, N. A. Samoylova, M. Rosenkranz, A. Kostanyan, T. Greber, A. U. B. Wolter, B. Büchner and A. A. Popov, Nat. Commun., 2017, 8, 16098–16106 CrossRef CAS PubMed.
- H. Huang, W. Van den Heuvel and A. Soncini, Quantum Mater.Res., 2020, 1, e200003 Search PubMed.
- A. Dei, D. Gatteschi, J. Pécaut, S. Poussereau, L. Sorace and K. Vostrikova, Comptes Rendus de l'Académie des Sciences – Series IIC – Chemistry, 2001, 4, 135–141 CrossRef CAS.
- A. Caneschi, A. Dei, D. Gatteschi, S. Poussereau and L. Sorace, Dalton Trans., 2004, 24, 1048–1055 RSC.
- P. Llunell, M. Casanova, D. Cirera, J. Bofill, J. M. Alemany, D. Alvarez, S. Pinsky and M. Avnir, SHAPE 2.1, Universitat de Barcelona and The Hebrew University of Jerusalem, Barcelona and Jerusalem, 2003 Search PubMed.
- D. Casanova, M. Llunell, P. Alemany and S. Alvarez, Chem.–Eur. J., 2005, 11, 1479–1494 CrossRef CAS PubMed.
- C. F. Macrae, I. Sovago, S. J. Cottrell, P. T. A. Galek, P. McCabe, E. Pidcock, M. Platings, G. P. Shields, J. S. Stevens, M. Towler and P. A. Wood, J. Appl. Crystallogr., 2020, 53, 226–235 CrossRef CAS PubMed.
- F. Lu, M. M. Ding, J. X. Li, B. L. Wang and Y. Q. Zhang, Dalton Trans., 2020, 49, 14576–14583 RSC.
- S. Da Jiang, B. W. Wang, H. L. Sun, Z. M. Wang and S. Gao, J. Am. Chem. Soc., 2011, 133, 4730–4733 CrossRef PubMed.
- Y.-S. Meng, C.-H. Wang, Y.-Q. Zhang, X.-B. Leng, B.-W. Wang, Y.-F. Chen and S. Gao, Inorg. Chem. Front., 2016, 3, 828–835 RSC.
- M. Brzozowska, G. Handzlik, K. Kurpiewska, M. Zychowicz and D. Pinkowicz, Inorg. Chem. Front., 2021, 8, 2817–2828 RSC.
- O. Waldmann and H. U. Güdel, Phys. Rev. B: Condens. Matter Mater. Phys., 2005, 72, 094422 CrossRef.
- R. A. Mole, K. C. Rule, D. Yu, J. A. Stride, M. A. Nadeem and P. T. Wood, J. Phys.: Condens. Matter, 2016, 28, 126005 CrossRef PubMed.
- H. U. Güdel, Neutron News, 1996, 7, 24–28 CrossRef.
- G. K. Gransbury, M.-E. Boulon, R. A. Mole, R. W. Gable, B. Moubaraki, K. S. Murray, L. Sorace, A. Soncini and C. Boskovic, Chem. Sci., 2019, 10, 8855–8871 RSC.
- M. E. Lines, J. Chem. Phys., 1971, 55, 2977–2984 CrossRef CAS.
- W. W. Lukens and M. D. Walter, Inorg. Chem., 2010, 49, 4458–4465 CrossRef CAS PubMed.
- E. Moreno Pineda, N. F. Chilton, R. Marx, M. Dörfel, D. O. Sells, P. Neugebauer, S.-D. Jiang, D. Collison, J. van Slageren, E. J. L. McInnes and R. E. P. Winpenny, Nat. Commun., 2014, 5, 5243 CrossRef CAS PubMed.
- F. Ortu, J. Liu, M. Burton, J. M. Fowler, A. Formanuik, M.-E. Boulon, N. F. Chilton and D. P. Mills, Inorg. Chem., 2017, 56, 2496–2505 CrossRef CAS PubMed.
- L. Ungur, M. Thewissen, J.-P. Costes, W. Wernsdorfer and L. F. Chibotaru, Inorg. Chem., 2013, 52, 6328–6337 CrossRef CAS PubMed.
- K. C. Mondal, A. Sundt, Y. Lan, G. E. Kostakis, O. Waldmann, L. Ungur, L. F. Chibotaru, C. E. Anson and A. K. Powell, Angew. Chem., Int. Ed., 2012, 51, 7550–7554 CrossRef CAS PubMed.
- W. W. Lukens, N. Magnani and C. H. Booth, Inorg. Chem., 2012, 51, 10105–10110 CrossRef CAS PubMed.
- N. Iwahara and L. F. Chibotaru, Phys. Rev. B, 2015, 91, 174438 CrossRef.
- E. Garlatti, A. Chiesa, T. Guidi, G. Amoretti, P. Santini and S. Carretta, Eur. J. Inorg. Chem., 2019, 2019, 1106–1118 CrossRef CAS.
- M. L. Baker, T. Guidi, S. Carretta, J. Ollivier, H. Mutka, H. U. Güdel, G. A. Timco, E. J. L. McInnes, G. Amoretti, R. E. P. Winpenny and P. Santini, Nat. Phys., 2012, 8, 906–911 Search PubMed.
- A. Chiesa, T. Guidi, S. Carretta, S. Ansbro, G. A. Timco, I. Vitorica-Yrezabal, E. Garlatti, G. Amoretti, R. E. P. Winpenny and P. Santini, Phys. Rev. Lett., 2017, 119, 217202 CrossRef CAS PubMed.
- E. Garlatti, T. Guidi, A. Chiesa, S. Ansbro, M. L. Baker, J. Ollivier, H. Mutka, G. A. Timco, I. Vitorica-Yrezabal, E. Pavarini, P. Santini, G. Amoretti, R. E. P. Winpenny and S. Carretta, Chem. Sci., 2018, 9, 3555–3562 RSC.
- N. F. Chilton, R. P. Anderson, L. D. Turner, A. Soncini and K. S. Murray, J. Comput. Chem., 2013, 34, 1164–1175 CrossRef CAS PubMed.
Footnote |
| † Electronic supplementary information (ESI) available: Experimental details, crystallography details, IR, EPR, magnetometry, INS, ab initio details and calculations and Q-dependence model. CCDC 2287861–2287864. Computational output files are available at https://doi.org/10.26188/25222571. For ESI and crystallographic data in CIF or other electronic format see DOI: https://doi.org/10.1039/d3sc04229d. |
| This journal is © The Royal Society of Chemistry 2024 |