 Open Access Article
Novel polyvinyl alcohol-assisted MnO2–ZnO–CuO nanocomposites as an efficient photocatalyst for methylene blue degradation from wastewater†
Teketel Girma Gindose ab,
Gebrehiwot Gebreslassie
 abe,
Tessema Derbe Hailegebreal
 abd,
Tesfay G. Ashebrab,
Fanyana Mtunzif,
Tsegaye Belege Atismeab and
Enyew Amare Zereffa
 *c
*c
aDepartment of Industrial Chemistry, Addis Ababa Science and Technology University, P. O. Box 16417, Addis Ababa, Ethiopia
bNanotechnology Centre of Excellence, Addis Ababa Science and Technology University, P. O. Box 1647, Addis Ababa, Ethiopia
cDepartment of Applied Chemistry, School of Applied Natural Science, Adama Science and Technology University, P. O. Box 1888, Adama, Ethiopia. E-mail: eneyew.amare@astu.edu.et
dDepartment of Chemistry, Wachemo University, P. O. Box 667, Hossana, Ethiopia
eSchool of Mechanical and Electrical Engineering, University of Electronic Science and Technology of China, Chengdu 611731, China
fDepartment of Biotechnology and Chemistry, Vaal University of Technology, Moshoeshoe Road, Sebokengn 1983, South Africa
First published on 4th December 2024
Abstract
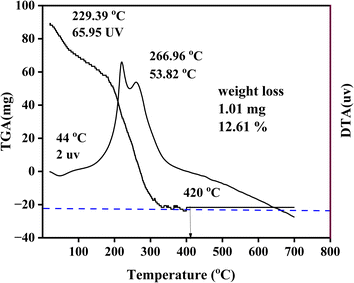
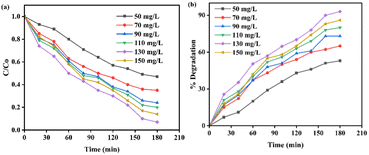
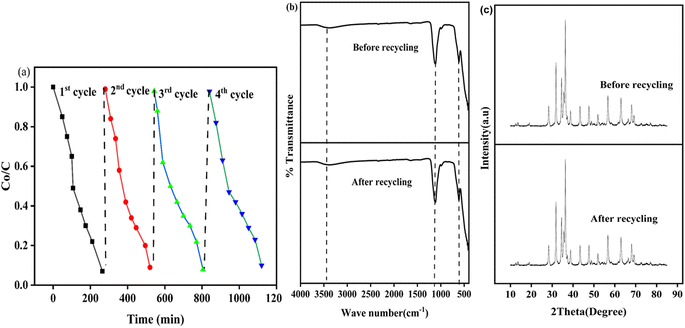
Pristine ZnO (Z), MnO2 (M), CuO (C) photocatalysts and polyvinyl alcohol (PVA)-assisted MnO2–ZnO–CuO (MZC) nanocomposites were synthesized via the sol–gel method. The synthesized samples were characterized using thermal analysis (TGA), X-ray diffraction (XRD), dynamic light scattering (DLS), scanning electron microscopy (SEM), energy dispersive X-ray (EDS), transmission electron microscopy (TEM), and high-resolution transmission electron microscopy (HRTEM) techniques. The thermal analysis results of the prepared nanomaterial confirmed that the suitable calcination temperature for the synthesis of these nanomaterials is 420 °C. In addition to the morphological and elemental composition, the characteristic diffraction peaks of the MZC nanomaterial were found to align with those of the pristine Z, M, and C photocatalysts. The photocatalytic activities of the synthesized nanomaterials for methylene blue (MB) degradation were evaluated under optimized conditions. The degradation efficiencies of Z, M, C, and MZC were found to be 45%, 57%, 66%, and 93%, respectively, for MB in 180 minutes. The MZC nanocomposite exhibited superior photocatalytic activity compared to the pristine materials, which is attributed to the synergetic effect of the Z, M, and C photocatalysts. The effects of pH, initial dye concentration, and catalyst load were also explored to determine the optimum conditions. The best photocatalytic efficiency was observed at pH 8, with a 130 mg L−1 catalyst load, and a 10 mg L−1 initial dye concentration. The efficiency of the MZC nanocomposite in real textile wastewater was also tested, achieving 80% degradation of pollutants within 180 minutes. Recycling experiments were conducted for four consecutive cycles under optimal conditions. The photodegradation efficiency for the first, second, third, and fourth cycles was 93%, 91%, 90%, and 89%, respectively, demonstrating high consistency in photodegradation performance across the four cycles. Moreover, a Z-scheme photocatalytic mechanism was proposed as a potential mechanism for the MZC photocatalytic system.
1. Introduction
Environmental pollution is a major concern due to the extensive use of organic dyes, colorants, and other coloring products in various industries.1,2 Specifically, textile factories consume large quantities of organic dyes.3 Annually, approximately 700![[thin space (1/6-em)]](https://www.rsc.org/images/entities/char_2009.gif) 000 tons of dyes are produced, with around 40% being released into water bodies as wastewater from textile factories.4 This industrial waste contains several hazardous pollutants that pose substantial risks to human health.5 Among the various dyes found in industrial waste, methylene blue (MB) is widely used for coloring materials such as silk, wool, cotton, and paper.3,6 However, it is important to note that MB is toxic, tumorigenic, mutagenic, and non-biodegradable, making it a major environmental pollutant.7,8 Moreover, the presence of MB dye in wastewater is hazardous to aquatic life as it hinders sunlight penetration into the water.9 Therefore, the removal of dyes before they are released into water bodies is a critical concern.4,10 Various methods are being investigated for treating wastewater, including coagulation,9 precipitation,7 reverse osmosis,11 and photodegradation using light exposure.12,13 Among these methods, semiconductor-based photocatalytic degradation has gained attention as an effective approach due to its affordability, simplicity, and environmental benefits.14,15
000 tons of dyes are produced, with around 40% being released into water bodies as wastewater from textile factories.4 This industrial waste contains several hazardous pollutants that pose substantial risks to human health.5 Among the various dyes found in industrial waste, methylene blue (MB) is widely used for coloring materials such as silk, wool, cotton, and paper.3,6 However, it is important to note that MB is toxic, tumorigenic, mutagenic, and non-biodegradable, making it a major environmental pollutant.7,8 Moreover, the presence of MB dye in wastewater is hazardous to aquatic life as it hinders sunlight penetration into the water.9 Therefore, the removal of dyes before they are released into water bodies is a critical concern.4,10 Various methods are being investigated for treating wastewater, including coagulation,9 precipitation,7 reverse osmosis,11 and photodegradation using light exposure.12,13 Among these methods, semiconductor-based photocatalytic degradation has gained attention as an effective approach due to its affordability, simplicity, and environmental benefits.14,15
Recently, many researchers have been interested in exploring the photocatalytic activities of semiconductors for the degradation of MB.15,16 Metal oxide semiconductors, such as MnO2,4 CuO,17 ZnO,4,7 TiO2,18 and Cu2O,19 have been extensively studied. Among these semiconductors, ZnO nanoparticles have gained substantial attention due to their versatile applications.20 However, ZnO has limitations, such as a wide band gap,7,21 quick recombination of electron–hole pairs, low charge migration efficiency to redox sites,4 and limited surface reactions to generate reactive species.20,22 To improve the photocatalytic efficiency of ZnO, it is crucial to enhance the light absorption, optimize the charge separation, increase the surface area, and address the surface mismatch.22,23 One approach is to create heterostructures by doping ZnO with a metal 24 or non-metal,25 and integrating ZnO with narrow band gap semiconductors like MnO2.22,26 Researchers have achieved effective charge separation by studying the multiphase components of ZnO-based heterojunctions.27,28 Thus, CuO and MnO2 semiconductors have been chosen based on their band gap, light absorptivity in the visible region, availability, stability, and non-toxicity for modifying the chemistry of ZnO.29,30
Many researchers have studied various three-phase ZnO-based heterostructures, such as ZnO–ZnS–MnO2,4 Ag3PO4–ZnO–Cu2O,7 Cu2O–ZnO–g-C3N4,31 and ZnO–V2O3–WO3.32 These heterostructures have shown superior efficiency compared to single ZnO. For instance, J. P. Shubha et al.33 found that the ternary Mn3O4–ZnO–Eu2O3 photocatalyst exhibited admirable degradation performances of 98% for MB and 96% for methyl orange (MO) within 150 min under natural sunlight irradiation. Many researchers have also successfully developed binary, ternary, and a few quaternary systems of ZnO-based heterojunction nanocomposites for photocatalytic applications.34,35 However, nanocomposites tend to agglomerate or aggregate, which diminishes their performance in the degradation of dyes.36,37 To overcome this problem, the use of polymers has gained increasing attention. Among several polymers, polyvinyl alcohol (PVA) has been presented as a viable option owing to its biocompatibility, non-toxicity, biodegradability, water solubility, low calcination temperature, and low thermal stability.36,38,39
B. Abebe and coworkers have published a few articles on the use of PVA-assisted ZnO-based binary and ternary nanocomposites to improve the photocatalytic effectiveness of ZnO.37,39 The results showed the superior catalytic ability of the mixed composite compared to its single ZnO photocatalyst. In spite of these experimental works, research studies associated with the use of mixed-phase composites for photocatalytic applications are far from mature. To the best of the researchers' knowledge, no information is available on the synthesis of mixed-phase MZC nanocomposites for the photodegradation of MB. Thus, the aim of this investigation was to assess the photocatalytic activity of the MZC nanocomposite towards the photodegradation of MB. The efficiency of the MZC nanocomposite was also evaluated for industrial wastewater collected from KK textile industry located at Addis Ababa, Ethiopia. The results show the potential application of the MZC nanocomposite for effective textile dye degradation.
2. Experimental part
2.1. Chemicals and materials
Chemicals and reagents, including (C4H6O2)n, 99.9%; KMnO4, 98.5%; MnSO4·H2O, ≥99.00%; and NaOH, 97.00%, were purchased from Merck, India. Zn(CH3COO)2·2H2O, 99.9%; HgSO4, 99.98%; Ag2SO4; AgNO3, 99.5%; K2Cr2O7, 99.5%; NaHCO3, 99%; CH3OH, 99.85%; and Cu(NO3)2·3H2O, ≥99%, were obtained from Sigma-Aldrich. Every chemical was of research-grade. Distilled water (DW) was employed for dissolving and cleaning the impurities in the study.2.2. Preparation of samples
![[thin space (1/6-em)]](https://www.rsc.org/images/entities/char_2009.gif) :
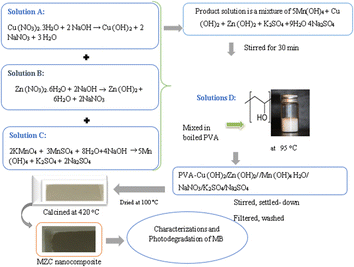
:![[thin space (1/6-em)]](https://www.rsc.org/images/entities/char_2009.gif) 25 mL ratio of DW and CH3CH2OH. Then, 0.2 M solution of NaOH was prepared and added to the solution containing Zn(NO3)2·6H2O until a white precipitate was formed. The subsequent suspensions were settled down after 9 h, and undesired impurities were removed by washing with DW and CH3CH2OH. The sample was dried at 100 °C and then calcined at 420 °C to attain the desired Z nanoparticles. By the same method, the M and C photocatalysts were synthesized using the corresponding metal precursors, except potassium permanganate was added to prevent Mn oxidation during the preparation of the pristine M catalyst.
25 mL ratio of DW and CH3CH2OH. Then, 0.2 M solution of NaOH was prepared and added to the solution containing Zn(NO3)2·6H2O until a white precipitate was formed. The subsequent suspensions were settled down after 9 h, and undesired impurities were removed by washing with DW and CH3CH2OH. The sample was dried at 100 °C and then calcined at 420 °C to attain the desired Z nanoparticles. By the same method, the M and C photocatalysts were synthesized using the corresponding metal precursors, except potassium permanganate was added to prevent Mn oxidation during the preparation of the pristine M catalyst.2.3. Characterizations
The prepared nanocomposites were examined using DTA (DTG, 60 H, and Shimadzu Japanese) to ascertain the thermal stability of the samples. With a scanning rate of 10 min−1 and a Cu Kα radiation (λ = 0.154![[thin space (1/6-em)]](https://www.rsc.org/images/entities/char_2009.gif) 060 nm) source, the phase composition and crystallite size of the prepared samples were evaluated using XRD (XRD-7000, Shimadzu, Japan) in the 2-theta range of 20° to 80°. Diffuse reflectance spectroscopy (DRS) of all composite materials was conducted (JASCO.V-770, Shimadzu, Japan) in the wavelength range between 200 and 800 nm. The morphological shapes of the manufactured nanocomposites were explored via scanning electron microscope (JSM 6390 L V, JEOL, Japan). The surface structure of the triple-phase components was explored through electron microscopy (SEM) equipment, and the elemental composition of the composites was determined with EDS. Likewise, using TEM and HRTEM (JEOL JEM 2100, Japan), the internal structures of the prepared MZC heterojunction were studied.
060 nm) source, the phase composition and crystallite size of the prepared samples were evaluated using XRD (XRD-7000, Shimadzu, Japan) in the 2-theta range of 20° to 80°. Diffuse reflectance spectroscopy (DRS) of all composite materials was conducted (JASCO.V-770, Shimadzu, Japan) in the wavelength range between 200 and 800 nm. The morphological shapes of the manufactured nanocomposites were explored via scanning electron microscope (JSM 6390 L V, JEOL, Japan). The surface structure of the triple-phase components was explored through electron microscopy (SEM) equipment, and the elemental composition of the composites was determined with EDS. Likewise, using TEM and HRTEM (JEOL JEM 2100, Japan), the internal structures of the prepared MZC heterojunction were studied.
| % degradation = (C0 − C)/C0 or (A0 − A)/A0 × 100 | (1) |
| ln(C0/C) = kapt | (2) |
3. Results and discussion
3.1. Characterizations
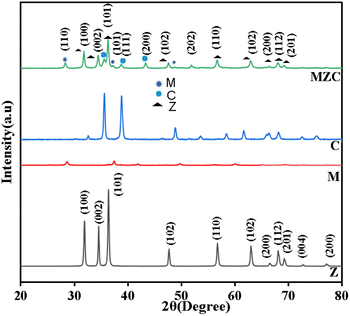
![[1 with combining macron]](https://www.rsc.org/images/entities/char_0031_0304.gif) 11), (111), (200), (020), (202), (
11), (111), (200), (020), (202), (![[1 with combining macron]](https://www.rsc.org/images/entities/char_0031_0304.gif) 13), (311) and (222) were observed. This indicates the presence of a monoclinic shape for C in the synthesized materials. All diffraction peaks located in the MZC nanomaterials are identified as those for the MnO2, CuO, and ZnO photocatalysts. The recorded XRD findings indicate the formation of the heterojunction (coexistence of Zn, Cu, and Mn-oxides in a nanocomposite).
13), (311) and (222) were observed. This indicates the presence of a monoclinic shape for C in the synthesized materials. All diffraction peaks located in the MZC nanomaterials are identified as those for the MnO2, CuO, and ZnO photocatalysts. The recorded XRD findings indicate the formation of the heterojunction (coexistence of Zn, Cu, and Mn-oxides in a nanocomposite).
D = kλ/β![[thin space (1/6-em)]](https://www.rsc.org/images/entities/char_2009.gif) cos cos![[thin space (1/6-em)]](https://www.rsc.org/images/entities/char_2009.gif) θ θ
| (3) |
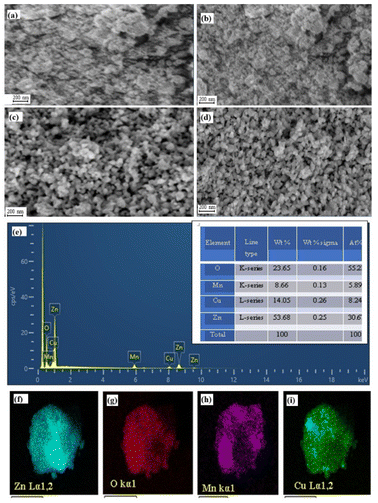 | ||
| Fig. 3 SEM image of (a) Z; (b) M; (c) C; and (d) MZC. (e) EDS elemental composition; and Elemental mapping of (f) Zn; (g) O; (h) Mn; and (i) Cu. | ||
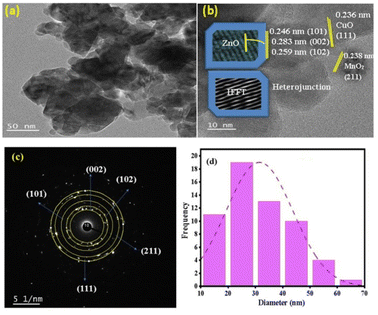
The TEM result shows the presence of spherical C and cubic M photocatalysts loaded on the surface of Z, as shown in Fig. 4a. These photocatalysts are arranged favorably without aggregation (Fig. 4a). For additional evaluation, the internal morphology of the M nanocomposite was studied, as presented in the HRTEM image. The HRTEM image (Fig. 4b) shows that the M composite has a wurtzite, spherical, and cubic structure without any agglomeration. From the histogram, the predicted diameter is 27 nm (Fig. 4d). This result is consistent with the value obtained from XRD. The predicted lattice fringe d-spacing from HRTEM is 0.238, which is ascribed to the M (211) plane. Also, the interplanar spacing values are 0.246, 0.259, and 0.283 nm, and ascribed to Z(101), (100), and (002), respectively. Additionally, a d-spacing of 0.221 nm was estimated and attributed to C (111). The obtained results reveal the effective creation of a heterojunction. The stacking faults on the Inverse Fast Fourier Transform (IFFT) analysis signify the crystalline nature of the material (Fig. 4b inset). The selected area electron diffraction (SAED) revealed the presence of different concentric circles with the same center assigned to the (100), (002), and (101) planes of hexagonal Z, in addition to the (111) and (211) planes of cubic M and spherical C nanoparticles (Fig. 4c).
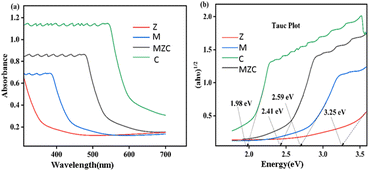
The band gap energy of the synthesized samples was also estimated from the Tauc plot (αhν)n/2 versus hν, where α is the optical absorption coefficient, hν is the energy of a photon, Eg is the band gap, and n is the transition type of a semiconductor (its value is 1 or 4 for direct and indirect, respectively). The direct band gap of the as-prepared materials was estimated from a plot of (αhν)1/2 versus hν (Fig. 5b). Accordingly, the calculated band gaps for Z, M, C, and MZC were found to be 3.25 eV, 2.59 eV, 1.98 eV, and 2.41 eV, respectively. The findings revealed that all as-prepared samples exhibited UV-visible absorption, with the exception of Z. In general, the Z photocatalyst exhibited a shift from hypsochromic to bathochromic when forming a nanocomposite. This enhanced visible light absorption of the MZC nanocomposite photocatalyst suggests the potential for effective photocatalytic degradation reactions under various conditions.
3.2. Photocatalytic activity test
The photocatalytic efficiency of the MB, Z, M, C, and MZC materials versus the MB dye was evaluated under visible light radiation within 180 min (Fig. 6a and b). The mixed aqueous solution of 130 mg catalyst load and 10 mg MB was employed for all samples. Adsorption–desorption processes typically occurred during the investigation in dark (light off) and bright (light on) conditions. In the dark, the % degradation is almost the same and low for all materials because of the slow reaction rate. Moreover, the reaction rate and % degradation for all of the as-synthesized nanomaterials increased after dark (light off) conditions (Fig. 6a and b).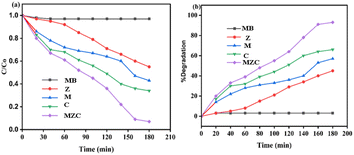 | ||
| Fig. 6 (a) C/C0 versus irradiation time, (b) % degradation versus irradiation time using 10 mg MB and 130 mg of the Z, M, C, and MZC samples. | ||
Each material (such as MB, Z, M, C, and MZC) exhibited a maximum photodegradation efficiency of 3%, 45%, 57%, 66%, and 93%, respectively (Fig. 7b). Conversely, from 0 to 180 min, the MB concentration decreased, which prompted an increment in the degradation rate (Fig. 7b). An insignificant degradation efficiency of MB was observed, as indicated in Fig. 7a and b. The efficiency of Z was lower than those of other materials (Fig. 7b). The increasing order of degradation efficiency may be a result of the lowering band gap in that respective order.21 Furthermore, the MZC composite exhibited outstanding catalytic performance.
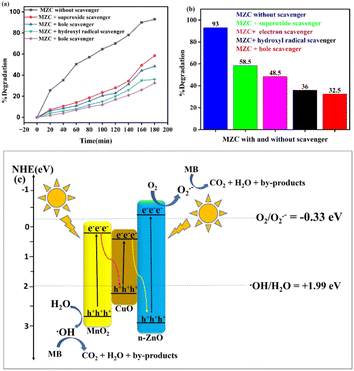
To elucidate the excited charge separation in the MZC nanocomposites, the conduction band (CB) and valence band (VB) edges were calculated for each photocatalyst by employing the equations: ECB = x − E − 0.5Eg and EVB = ECB + Eg,15 where EVB is the valence band edge potential, x is the absolute electronegativity of the semiconductor, E is the energy of free electrons on the hydrogen scale (4.5 eV), Eg is the band gap energy, and ECB is the conduction band edge potential. The calculated Eg values for the ZnO, MnO2, and CuO catalysts are 3.25 eV, 2.59 eV and 1.98 eV, respectively. The EVB and ECB values of ZnO, MnO2, and CuO are also estimated to be 2.90, 2.76, 2.26, and −0.34, 0.165, and 0.34 eV, respectively. The generation of h+/e− occurs in the VB and CB of each component when the MZC heterojunction nanocomposite interacts with visible light. The electron affinity of ZnO is more negative than that of CuO and MnO2. Similarly, the EVB of ZnO is more positive than that of CuO and MnO2. If the migration pathway of charge carriers generated during the photocatalytic processes follows the type-II heterojunction, then electrons generated in the ECB of MnO2 and ZnO can be transferred to CuO, and holes generated in the EVB of MnO2 and ZnO can be transferred to CuO. In this case, the EVB of CuO (+2.26 eV) is more positive than the potential of ˙OH/H2O (E° = +1.99 eV),38 indicating that the holes at the EVB of CuO possess sufficient oxidizing ability to oxidize H2O or OH− to form ˙OH. However, the electrons at the ECB of CuO are unable to reduce O2 to ˙O2− due to the fact that the ECB of CuO (+0.34 eV) is more positive than the O2/˙O2− (E° = −0.33 eV).15 This is in contradiction with the results obtained from the active species trapping experiments (Fig. 10a and b). It became evident that the type-II heterojunction mechanism was not an appropriate fit for the MZC nanocomposite photocatalytic system. Accordingly, the Z-scheme system is a logical representation of the enhanced photocatalytic activity observed in the MZC nanocomposite, as illustrated in Fig. 10c. In this instance, the generated electrons in the ECB of MnO2 are prone to transfer and recombine with the holes in the EVB of CuO, driven by the internal electric field at the junction between these. Similarly, the excited electrons in the ECB of CuO are transferred and recombine with the holes in the EVB of ZnO. These electron–hole transfer and combination processes result in the accumulation of electrons in the ECB of ZnO and holes in the EVB of MnO2. Consequently, the generated electrons in the ECB of ZnO can readily reduce O2 to generate the ˙O2− reactive species. Concurrently, the accumulated holes in the EVB of MnO2 can directly engage in the MB degradation process or oxidize H2O to yield the ˙OH active species. This mechanism aligns with the outcomes of the reactive species detection experiments. Therefore, the Z-scheme photocatalytic system of the MZC nanocomposite facilitates not just the transfer and separation efficiency of the generated electron–hole, but also preserves the robust redox capability in the photodegradation process.
3.3. Industrial wastewater analysis
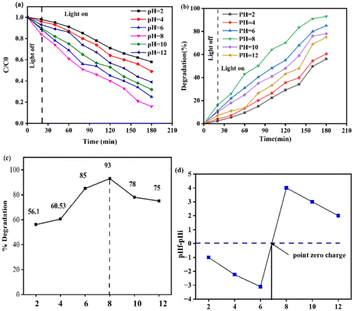
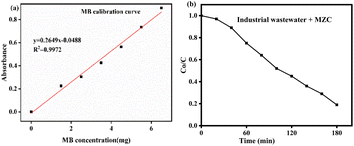
Some significant physicochemical properties, such as the turbidity, pH, and COD, were explored before wastewater treatment from the KK textile factory. According to the World Health Organization (WHO), the suitable pH range was found to be in the range of 6.5 to 8.5 and 6 to 9 for aquatic organisms and human beings, respectively.41 Unfortunately, the pH value of 8 was the optimal condition during the photocatalytic degradation of MB, and we employed pH 8 for our experiment. Another crucial feature of textile wastewater is turbidity, which prevents the penetration of light and oxygen transfer processes in water bodies, and results in the disturbance of living organisms. Hence, textile wastewater needs to be treated before being discharged into the surface water. In our case, 90% to 98% removal was achieved with an average of 94%.The present work was also carried out to determine the concentration of COD in industrial waste collected from KK Textile Factory. The estimated concentration of COD from textile wastewater was in the range of 22–235 mg. This value is similar to the value reported by Hussein and Scholz,42 and Yaseen and Scholz.43 Nevertheless, many researchers reported the presence of a higher concentration of COD in textile factories. For instance, Verma et al.,44 Aouni et al.,45 Aldoury et al.,46 Mountassir et al.,47 and Punzi et al.48 reported 770–790, 450–566, 650–900, 736 mg, and 590 mg of COD concentrations, respectively. This higher COD concentration shows the presence of numerous contaminants in wastewater. Before estimating the efficacy of the MZC composite, it is important to determine the COD value of MB in industrial wastewater using a calibration curve. The curve is a plot of the absorbance of a series of standard solutions with various content of MB, such as 0.00, 1.5, 2.5, 3.5, 4.5, 5.5, and 6.5 mg (Fig. 12a). The absorbance values for the respective concentrations were 0.00, 0.225, 0.305, 0.425, 0.565, 0.735, and 0.9015, respectively. From these data, the unknown COD concentration of MB was estimated to be 13.69 mg. The concentration of reactive dyes in the textile industry has been reported in various studies. M. F. Abid et al.49 reported a concentration range of 10–50 mg. However, N. Koprivanac et al.50 reported an extremely high concentration of 7000 mg, which may be ascribed to the sewage release from a specific textile industry. On the other hand, V. V. A. E. Ghaly et al.18 revealed that the released dye content ranged from 10 to 250 mg.
It is important to note the significant variation in the reported concentrations, which can be attributed to different textile industry practices and effluent treatment processes. The absorbance of the sample was compared to the calibration curve to determine the unknown concentration of MB from the real sample. Afterward, the catalytic efficacy of the prepared composite was investigated under visible light radiation (Fig. 12b). The prepared material degraded 80% of the pollutants from the real sample. This result reveals that the efficiency of MZC on the real sample was good, and it is in good agreement with previous work reported by T. Hail and coworkers21 and A. Tadesse and his research group.7 The degradation efficiency of the MZC heterojunctions using industrial wastewater and synthetic MB was compared. The result indicates that the photodegradation performance of MZC towards the real sample is lower than that of MB. That means the efficiency of the MZC heterojunction nanocomposite in degrading synthetic MB dye was two-fold higher compared to its efficiency in degrading textile wastewater. The decreasing performance of the wastewater condition might be ascribed to the nature of the sewage; it is a mixture of numerous dyes and other chemicals used through coloring. Nonetheless, the MZC heterojunction is an efficient and capable material for the removal of dye from real samples.
4. Conclusion
In this study, single phase Z, M, C photocatalysts, and MZC nanocomposite were synthesized by the sol–gel method. TGA-DTA analysis was used to determine the calcination temperature (420 °C) for the synthesized samples. The crystalline composition or size, band gap energy, and morphological characteristics of the synthesized photocatalysts were also characterized using XRD, DRS, SEM, EDS, TEM, HRTEM, and SAED to confirm the formation of heterojunction photocatalysts. The photocatalytic performance of the synthesized photocatalysts was explored for the photodegradation of the MB dye. The outcomes of the study confirmed that the ternary nanocomposite exhibited superior photocatalytic activity compared to its counterpart. The efficiency of dye removal is influenced by several factors, such as the pH levels, initial dye content, catalyst loads, and different scavengers. The maximum (93%) dye removal was achieved at a pH of 8, 10 mg of initial dye concentration, and 130 mg of catalyst load. Furthermore, the photocatalytic activity of the synthesized nanocomposites using electron, hole, superoxide free radical ion, and hydroxyl ion was carried out. The recyclability of the nanocomposites was also investigated. It was found that they maintained relatively stable photocatalytic activity after four cycles, indicating their potential for practical application in wastewater treatment. The photocatalytic performance of the industrial wastewater was also studied. The synthesized MZC nanocomposite degraded 80% of the industrial wastewater. These findings contribute to the development of efficient and sustainable water treatment technologies, addressing the pressing issue of dye pollution in wastewater. Further research can be explored for optimizing the synthesis parameters, investigating other dye pollutants, and scaling up the nanocomposites for real-world applications.Data availability
The data supporting this article have been included as part of the ESI.†Author contributions
T. G. G.: methodology, data analysis, and writing of the manuscript draft. T. B. A.: supervision, methodology, resources. G. G.: revision, software, editing. T. D. H.: methodology, analysis, revision. T. G. A.: methodology, analysis, revision. F. M.: revision, software, editing. E. A. Z.: supervision, conceptualization, analysis, revision.Conflicts of interest
There are no conflicts to declare.Acknowledgements
The present study is supported by Wolkite University and Addis Ababa Science and Technology University. Our group is also thankful to Addis Ababa and Adama Science and Technology universities for providing support with the microstructure characterization. The authors would also like to thank Scientific Compass (Hangzhou Yanqu Information Technology Co., Ltd) for surface analysis.References
- A. Momeni, M. H. Meshkatalsadat, B. Bakhtiari Shahin and Y. Mousavi, Hybrid Adv., 2023, 3, 100050 CrossRef.
- A. Negash, S. Mohammed, H. D. Weldekirstos, A. D. Ambaye and M. Gashu, Sci. Rep., 2023, 13, 1–12 CrossRef PubMed.
- D. Abdrabou, M. Ahmed, A. Hussein and T. El-Sherbini, Environ. Sci. Pollut. Res., 2023, 30, 99789–99808 CrossRef CAS PubMed.
- M. Abdullah, P. John, Z. Ahmad, M. N. Ashiq, S. Manzoor, M. I. Ghori, M. U. Nisa, A. G. Abid, K. Y. Butt and S. Ahmed, Appl. Nanosci., 2021, 11, 2361–2370 CrossRef CAS.
- O. A. Saputra, M. D. Prameswari, V. T. D. Kinanti, O. D. Mayasari, Y. D. Sutarni, K. Apriany and W. W. Lestari, Mater. Sci. Eng., 2017, 012039 Search PubMed.
- A. M. Taddesse, T. Bekele, I. Diaz and A. Adgo, J. Photochem. Photobiol., A, 2021, 406, 113005 CrossRef CAS.
- T. Taddesse, A. M. Alemu and T. Kebede, J. Environ. Chem. Eng., 2020, 8, 104356 CrossRef.
- W. Mohammed, M. Matalkeh, R. M. Al Soubaihi, A. Elzatahry and K. M. Saoud, ACS Omega, 2023, 8, 40063–40077 CrossRef CAS PubMed.
- K. Zhao, Y., H. Lian, C. Tian, H. Li, W. Xu, S. Phuntsho and F. Shih, Environ. Sci. Eng., 2021, 15, 1–13 Search PubMed.
- D. G. Ayu, S. Gea, N. Andriayani, D. J. Telaumbanua, A. F. R. Piliang, M. Harahap, Z. Yen, R. Goei and A. I. Y. Tok, ACS Omega, 2023, 8, 14965–14984 CrossRef CAS PubMed.
- Z. Yang, Y. Zhou, Z. Feng, X. Rui, T. Zhang and Z. Zhang, Polymers, 2019, 11, 1–22 Search PubMed.
- L. Zhu, H. Li, P. Xia, Z. Liu and D. Xiong, ACS Appl. Mater. Interfaces, 2018, 10, 39679–39687 CrossRef CAS PubMed.
- H. Abdo, K. Namratha, P. Deepalekshmi, Q. A. Drmosh, M. N. S. Adel, C. Chun and K. Byrappa, ACS Omega, 2018, 3, 12260–12269 CrossRef PubMed.
- S. Wang, B. Zhu, M. Liu, L. Zhang, J. Yu and M. Zhou, Appl. Catal., B, 2019, 243, 19–26 CrossRef CAS.
- G. Gebreslassie, P. Bharali, U. Chandra, A. Sergawie, P. K. Baruah, M. R. Das and E. Alemayehu, Appl. Organomet. Chem., 2019, 33, e5002 CrossRef.
- S. Ruan, W. Huang, M. Zhao, H. Song and Z. Gao, Mater. Sci. Semicond. Process., 2020, 107, 104835 CrossRef CAS.
- R. Saravanan, S. Karthikeyan, V. K. Gupta, G. Sekaran, V. Narayanan and A. Stephen, Mater. Sci. Eng., C, 2013, 33, 91–98 CrossRef CAS PubMed.
- V. V. A. E. Ghaly, R. R Ananthashankar, M. Alhattab and J. Ramakrishnan, Chem. Eng. Process Technol., 2013, 05, 1–19 Search PubMed.
- Y. Wang, J. Gao, X. Wang, L. Jin, L. Fang, M. Zhang, G. He and J. Sun, J. Sol-Gel Sci. Technol., 2018, 88, 172–180 CrossRef CAS.
- C. Wang, H. Ni, J. Dai, T. Liu, Z. Wu and X. Chen, Chem. Phys. Lett., 2022, 803, 139815 CrossRef CAS.
- H. Tedla, I. Díaz, T. Kebede and A. M. Taddesse, J. Environ. Chem. Eng., 2015, 3, 1586–1591 CrossRef CAS.
- A. Taufik, A. Albert and R. Saleh, J. Photochem. Photobiol., A, 2017, 344, 149–162 CrossRef CAS.
- L. T. Nguyen, L. T. Nguyen, A. T. Duong, B. D. Nguyen, N. Quang Hai, V. H. Chu, T. D. Nguyen and L. G. Bach, Materials, 2019, 12, 1–11 CAS.
- R. Singh, P. B. Barman and D. Sharma, J. Mater. Sci.: Mater. Electron., 2017, 28, 5705–5717 CrossRef CAS.
- W. Yu, J. Zhang and T. Peng, Appl. Catal., B, 2016, 181, 220–227 CrossRef CAS.
- Z. Shao, Y. Wang, Y. Zhang, G. Zhu, X. Yang and M. Zhong, J. Photochem. Photobiol., A, 2018, 364, 657–670 CrossRef CAS.
- J. P. Shubha, S. F. Adil, M. Khan, M. R. Hatshan and A. Khan, ACS Omega, 2021, 6, 3866–3874 CrossRef CAS PubMed.
- A. Hezam, K. Namratha, Q. A. Drmosh, Z. H. Yamani and K. Byrappa, Ceram. Int., 2017, 43, 5292–5301 CrossRef CAS.
- D. C. Ashiegbu, N. Moloto and H. Potgieter, Environ. Sci.: Adv., 2023, 2, 1–26 Search PubMed.
- B. Li and Y. Wang, Superlattices Microstruct., 2010, 47, 615–623 CrossRef CAS.
- R. Renji, V. Shanmugam, S. Asokan, P. Palanisamy, S. Sanjeevamuthu, R. Vairamuthu, K. S. Jeyaperumal, S. Manickam, S. Mohd and S. AlFaify, Colloids Interface Sci. Commun., 2021, 44, 100480 CrossRef.
- F. Mukhtar, T. Munawar, M. S. Nadeem, M. N. ur Rehman, M. Riaz and F. Iqbal, Mater. Chem. Phys., 2021, 263, 124372 CrossRef CAS.
- J. P. Shubha, H. S. Savitha, S. F. Adil, M. Khan, M. R. Hatshan, K. Kavalli and B. Shaik, Molecules, 2021, 26, 4661 CrossRef CAS PubMed.
- S. Balachandran and M. Swaminathan, J. Phys. Chem. C, 2012, 116, 26306–26312 CrossRef CAS.
- A. Habibi-Yangjeh and M. Shekofteh-Gohari, Sep. Purif. Technol., 2016, 166, 63–72 CrossRef CAS.
- B. Abebe, A. C. H. Murthy, Z. Enyew and A. Yeshaneh, Mater. Res. Express, 2020, 7, 045011 CrossRef CAS.
- B. Abebe, C. H. M. Ananda, E. Zerefa and E. Abdisa, Mater. Res. Express, 2020, 7, 1–16 Search PubMed.
- T. G. Gindose, T. B. Atisme, G. Gebreslassie, A. B. Gebresilassie and E. A. Zereffa, Mater. Adv., 2024, 5, 8017–8033 RSC.
- B. Abebe, H. C. A. Murthy and E. A. Zereffa, Res. Express, 2020, 2020, 1–14 Search PubMed.
- G. Gebreslassie, P. Bharali, U. Chandra and A. Sergawie, J. Photochem. Photobiol., A, 2019, 382, 111960 CrossRef CAS.
- D. Tibebe, A. Negash, M. Mulugeta, Y. Kassa, Z. Moges and D. Yenealem, BMC Chem., 2022, 16, 1–9 CrossRef PubMed.
- A. Hussein and M. Scholz, Ecol. Eng., 2017, 101, 28–38 CrossRef.
- D. A. Yaseen and M. Scholz, Environ. Sci. Pollut. Res., 2018, 25, 1980–1997 CrossRef CAS PubMed.
- A. K. Verma, B. Puspendu and R. R. Dash, Int. J. Chem. Nucl. Metall. Mater. Eng., 2012, 6, 15–22 Search PubMed.
- A. Aouni, C. Fersi, B. Cuartas-Uribe, A. Bes-Pía, M. I. Alcaina-Miranda and M. Dhahbi, Desalination, 2012, 297, 87–96 CrossRef CAS.
- M. M. Aldoury, W. M. S. Alabdraba, M. B. Al-bayati and J. Selçuk, J. Selçuk Univ. Nat. Appl. Sci., 2014, 234–248 Search PubMed.
- Y. Mountassir, A. Benyaich, P. Berçot and M. Rezrazi, J. Environ. Chem. Eng., 2015, 3, 2900–2908 CrossRef CAS.
- M. Punzi, F. Nilsson, A. Anbalagan, B. M. Svensson, K. Jönsson, B. Mattiasson and J. Jonstrup, Hazard. Mater., 2015, 292, 52–60 CrossRef CAS PubMed.
- M. F. Abid, M. A. Zablouk and A. M. Abid-Alameer, J. Environ. Health Sci. Eng., 2012, 9, 1–9 Search PubMed.
- N. Koprivanac, G. Bosanac, Z. Grabaric and S. Papic, Environ. Technol., 1993, 14, 385–390 CrossRef CAS.
Footnote |
| † Electronic supplementary information (ESI) available. See DOI: https://doi.org/10.1039/d4ra06476c |
| This journal is © The Royal Society of Chemistry 2024 |

