DOI:
10.1039/D4RA05016A
(Paper)
RSC Adv., 2024,
14, 26667-26673
Facile synthesis of N-doped graphene quantum dots as a fluorescent sensor for Cr(VI) and folic acid detection†
Received
11th July 2024
, Accepted 19th August 2024
First published on 22nd August 2024
Abstract
The development of stable fluorescent sensors for toxic pollutants and drugs is meaningful to the environment and public health. In this work, nitrogen-doped graphene quantum dots (N-GQDs) were facially synthesized by a one-step hydrothermal method using soluble starch and L-arginine as carbon and nitrogen sources in pure water at 190 °C for 4 h. The as-synthesized N-GQDs were well characterized and displayed blue fluorescence emission at 445 nm with excellent pH stability, salt tolerance, thermostability, photobleaching resistance and reproducibility. Moreover, N-GQDs could serve as an “on–off” sensor for selective detection of Cr(VI) and folic acid with low detection limit (0.80 and 2.1 μM), good linear correlation over wide linear range (0–50 μM and 0–200 μM) as well as short response time (<10 s). The practical applications of N-GQDs for Cr(VI) and folic acid detection in actual samples were further investigated and showed acceptable recoveries (92–105%) with relative standard deviations less than 5%. These results indicated that this N-GQDs-based sensor could be a potential alternative for Cr(VI) and folic acid detection in the fields of environmental monitoring and drug analysis.
Introduction
With the rapid development of industries, uncontrolled emission of industrial waste, especially heavy metal ions,1 poses a severe threat to the environment and human health.2 Among them, hexavalent chromium (Cr(VI)) ions have attracted increased attention due to their wide use in chemical industries (electroplating, metallurgy, paint and leather tanning)3 and dangerous nature (carcinogenicity, mutagenicity, non-biodegradability and high toxicity even at low concentrations).4 The ecological and biological threats have made the sensitive detection of Cr(VI) a top priority. However, traditional Cr(VI) detection methods, such as atomic absorption spectrometry,5 inductively coupled plasma mass spectrometry (ICP-MS),6 colorimetric7 and electrochemical analysis,8 are usually costly, time-consuming and suffer from tedious operation.
Folic acid (FA), also known as vitamin B9, is a water-soluble B-group vitamin and plays a major role in many physiological processes as a coenzyme and substrate.9 FA supplementation for pregnant women is important to reduce birth defects and congenital heart disease.10 Besides, the deficiency of FA has been proven to be connected with Alzheimer's disease, cardiovascular disease and mental illnesses.11 Abnormal FA also leads to vomiting, nausea, zinc deficiency and intestinal problems etc.12 Therefore, the detection of FA is of great practical importance. Various techniques, such as high-performance liquid chromatography (HPLC),13 electrochemical assays14 and enzyme-linked immunosorbent assay (ELISA)15 have been used for the quantitative determination of FA. However, these methods also suffer from requiring an expensive instrumental setup, professional operators and from prolonged time consumption.
To meet the urgent need for simple, fast and sensitive detection methods, fluorescence strategies stand out for their low cost, high sensitivity and selectivity, simple operation and rapid response time, etc.16 Among them, carbon dots-based fluorescence methods have drawn enormous attention due to their further advantages of low toxicity, easy preparation and good water solubility.17 In the past decades, numerous carbon dots-based fluorescence sensors have been explored for the detection of Cr(VI)18 and FA19 (for more details see Tables S1 and S2†). However, these sensors still face some obvious disadvantages, such as easy deterioration, poor reproducibility and stability.18–20 Therefore, the development of stable and multi-functional carbon dots-based sensors for the dual detection of Cr(VI) and FA is meaningful.
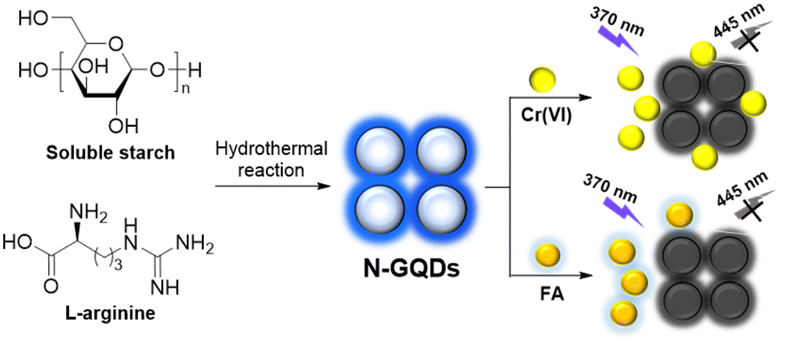
Graphene quantum dots (GQDs) are a relatively stable material,21 belonging to the carbon dots with one or several layers in thickness. The present investigations have demonstrated that the doping of non-metal atoms (N, S, P and F) would greatly alter the chemical, optical and electrical properties of GQDs.22 Based on this, we would like to demonstrate a facile synthesis of nitrogen-doped GQDs (N-GQDs) using soluble starch23 as carbon source and L-arginine24 as nitrogen source by a one-step hydrothermal method (Scheme 1). The as-synthesized N-GQDs emitted blue fluorescence at 445 nm under hand-held 365 nm UV light with a fluorescence quantum yield of 10.9%. The compositional and morphological properties of N-GQDs were well characterized and showed the successful synthesis of nitrogen-doped graphene quantum dots with particle sizes ranging from 1.0 to 1.5 nm (2–3 graphene layers). Further investigations showed that N-GQDs in this work exhibited excellent pH stability, salt tolerance, thermostability, photobleaching resistance and reproducibility. More importantly, the fluorescence of N-GQDs can be selectively and instantly quenched by Cr(VI) and FA with high sensitivity (LoD = 0.80 and 2.1 μM) and good linear correlation over wide linear range (0–50 μM and 0–200 μM). Besides, the detection of Cr(VI) and FA in actual samples was also investigated and showed acceptable recoveries (92–105%) with relative standard deviations less than 5%.
 |
| | Scheme 1 Synthesis of N-GQDs and their applications in the detection of Cr(VI) and FA. | |
Results and discussion
Synthesis and characterization of N-GQDs
Initially, the hydrothermal reaction conditions (carbon sources, amount of L-arginine, reaction temperature and time) for the preparation of N-GQDs were optimized. As shown in Table S3 and Fig. S1,† the highest fluorescence intensity was obtained with soluble starch (0.15 g) and L-arginine (0.9 g) as precursors at 190 °C for 4 h.
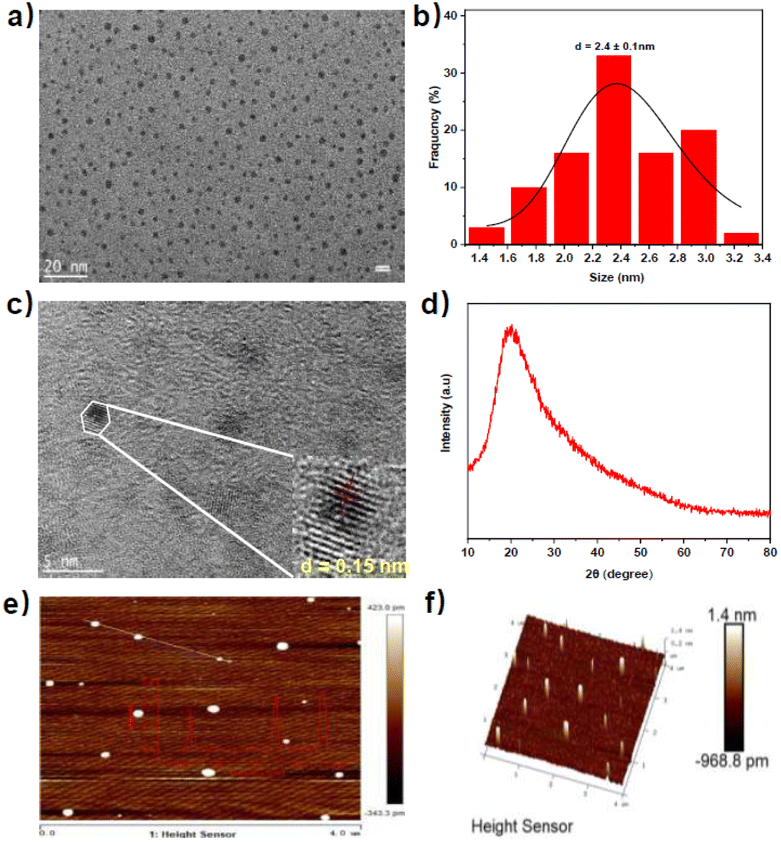
Following that, the morphological properties of N-GQDs were characterized. As depicted in Fig. 1, transmission electron microscopy (TEM) image showed that N-GQDs presented a nearly spherical shape with an average particle diameter of 2.4 nm (Fig. 1a and b). High-resolution TEM image (Fig. 1c) exhibited N-GQDs with a graphene structure of lattice fringes of about 0.15 nm. Typical X-ray diffraction (XRD) pattern (Fig. 1d) of N-GQDs showed a broad peak at about 20° corresponding to the (002) peak of graphite, which preliminary indicated that the graphene structure of N-GQDs.25 Furthermore, the atomic force microscope (AFM) topographic and 3D images demonstrated that N-GQDs had good monodispersity with a thickness in the range of 1.0–1.5 nm (2–3 graphene layers) (Fig. 1e and f).26 These results indicated the successful synthesis of graphene quantum dots rather than carbon quantum dots.27
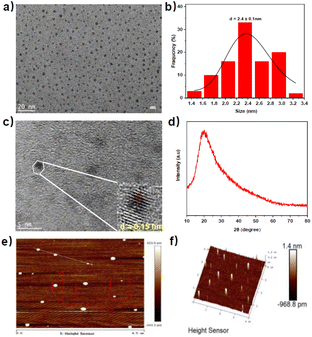 |
| | Fig. 1 (a) TEM image of N-GQDs; (b) size distribution histogram of N-GQDs; (c) high-resolution TEM image of N-GQDs; (d) XRD patterns of N-GQDs; (e) AFM topographic image of N-GQDs; (f) AFM 3D image of N-GQDs. | |
The surface functional groups of N-GQDs were analyzed by Fourier transform infrared (FTIR) spectroscopy (Fig. S2†). The broad absorption peak at 3204 cm−1 corresponded to N–H/O–H bonds stretching vibration.28 The bands at 2938, 1490 and 1448 cm−1 were attributed to the stretching and bending vibration of C–H bonds.29 Two peaks at 1637 and 1569 cm−1 were derived from the stretching vibration of conjugated C![[double bond, length as m-dash]](https://www.rsc.org/images/entities/char_e001.gif) O, CC and CN bonds.30 The absorption bands at 1326 and 1025 cm−1 corresponded to the stretching vibration of C–N and C–O bonds.31 Thus, it could be inferred that N-GQDs had hydrophilic groups, which would be helpful in enhancing the stability and chemical sensing ability in aqueous solution.
O, CC and CN bonds.30 The absorption bands at 1326 and 1025 cm−1 corresponded to the stretching vibration of C–N and C–O bonds.31 Thus, it could be inferred that N-GQDs had hydrophilic groups, which would be helpful in enhancing the stability and chemical sensing ability in aqueous solution.
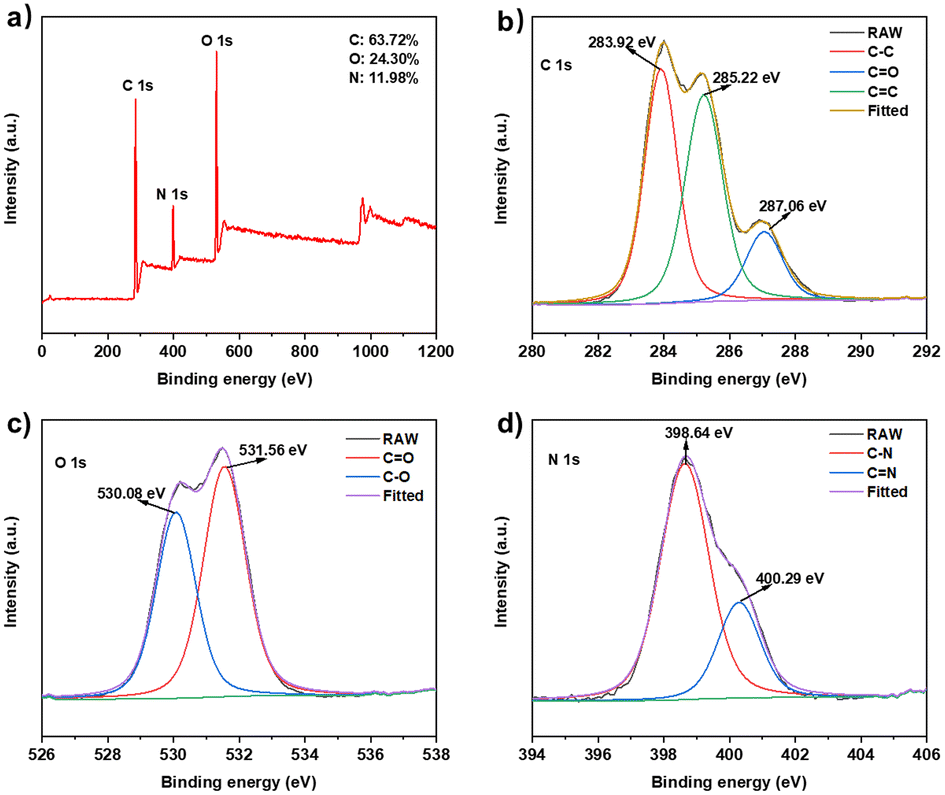
The elemental states and composition of N-GQDs were confirmed by X-ray photoelectron (XPS) spectroscopy (Fig. 2). The full-scan XPS spectrum (Fig. 2a) revealed distinct peaks at 284.72, 398.96 and 530.81 eV, representing the presence of C 1s (63.72%), N 1s (11.98%) and O 1s (24.30%) electrons, respectively. The high-resolution C 1s spectrum (Fig. 2b) showed three fitted peaks at 283.92, 285.22 and 287.06 eV, which corresponded to C–C, CC and CO bonds.30 Two peaks appeared at 530.08 and 531.56 eV on the high-resolution O 1s spectrum (Fig. 2c), representing the C–O and CO bonds.32 Two peaks at 398.64 and 400.29 eV on the high-resolution N 1s spectrum (Fig. 2d) inferred the C–N and CN bonds.33 These results show that the nitrogen element in L-arginine has been doped. The presence of nitrogen-containing and oxygen-containing groups indicated the surface defects of N-GQDs, which might improve the properties of N-GQDs such as water solubility and stability.
 |
| | Fig. 2 XPS spectra of N-GQDs: (a) full scan; (b–d) high-resolution spectrum of C 1s, O 1s and N 1s. | |
Optical properties of N-GQDs
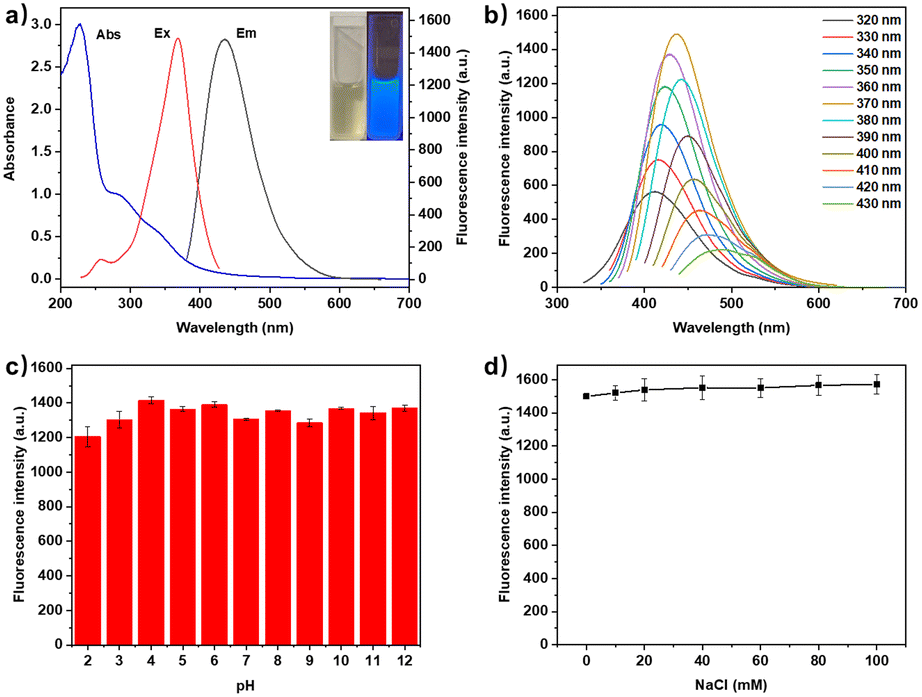
The optical properties of N-GQDs were investigated by UV-vis absorption and fluorescence spectroscopy. As shown in Fig. 3a, The UV-vis absorption spectrum of N-GQDs exhibited a strong absorption peak at 228 nm, which would be attributed to the π–π* transition of the conjugated CC bonds.30 The weak shoulder absorption peak at 275 nm and 331 nm could be attributed to the n–π* transition of the CO and CN bonds.34 Fluorescence excitation and emission spectra showed that the maximum excitation/emission of N-GQDs was 370/445 nm. As a result, the aqueous N-GQDs solution appeared pale yellow under sunlight and blue fluorescence under hand-held 365 nm UV light (insets of Fig. 3a). When the excitation wavelength increased from 320 to 430 nm, the fluorescence emission peak of N-GQDs gradually red-shifted from 412 to 491 nm. This excitation-wavelength-dependent emission suggested that the fluorescence process might be related to the graphene structure, surface defects and oxygen/nitrogen-rich content of N-GQDs (Fig. 3b).35 The fluorescence quantum yield (QY) of N-GQDs was 10.9% using quinine sulphate as a reference (Fig. S3†). Following that, the optical stability of N-GQDs was investigated to evaluate the feasibility of N-GQDs in natural environments. As shown in Fig. 3c, d and S4,† there were no significant changes in the fluorescence intensity of N-GQDs under different pH values (2–12), NaCl concentrations (0–100 mM), incubation temperatures (5–85 °C) and continuous excitation irradiation at 370 nm for 90 min as well as between 8 different batches, demonstrating excellent pH stability, salt tolerance, thermostability, photobleaching resistance and reproducibility.
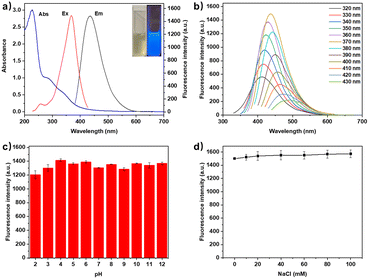 |
| | Fig. 3 (a) UV-vis absorption, fluorescence excitation and emission spectra of N-GQDs (insets: photographs of N-GQDs under sunlight (left) and 365 nm UV light (right)); (b) fluorescence emission spectra of N-GQDs under different excitation wavelengths; (c and d) fluorescence intensities of N-CQDs at different pH values and NaCl concentrations (n = 3). | |
Fluorescence detection of Cr(VI)
The recognition capability of N-GQDs was investigated by adding 18 common cations (Ag+, Al3+, Ba2+, Ca2+, Cd2+, Co2+, Cr3+, Cu2+, Fe3+, Hg2+, K+, Mn2+, Na+, NH4+, Ni2+, Pb2+, Sn2+ and Zn2+) and 11 common anions (Br−, Cl−, ClO4−, CO32−, Cr2O72−, F−, I−, NO3−, PO43−, SCN− and SO42−) in the N-GQDs solutions. As shown in Fig. S5,† the fluorescence of N-GQDs was noticeably quenched by Cr(VI) compared to other cations or anions. Anti-interference ability was also explored by adding Cr(VI) to N-GQDs solutions in the presence of other cations or anions. The results showed that the selectivity of N-GQDs for Cr(VI) was not affected by the presence of other metal cations or anions (Fig. 4a and b). The investigation of response time showed that the fluorescence intensity of N-GQDs was instantly (<10 s) quenched by Cr(VI) (Fig. S6†). To study the sensitivity, the fluorescence intensities of N-GQDs with different amounts of Cr(VI) were measured. As shown in Fig. 4c, the intensity of N-GQDs gradually decreased with the increase of Cr(VI). The quenching efficiency was determined by F/F0, where F0 is the fluorescence intensity of blank N-GQDs solution and F is the fluorescence intensity of N-GQDs with different amounts of Cr(VI). A linear plot was obtained by plotting the quenching efficiency versus Cr(VI) concentration (0–50 μM). As shown in Fig. 4d, the linear equation is F/F0 = −0.0097C(Cr(VI)) + 0.9699, and the correlation coefficient is R2 = 0.9971. The detection limit (LoD) is 0.80 μM (41.7 μg L−1), calculated by the (3σ/k) method, where σ is the standard deviation of the blank sample (n = 10) (Table S4†) and k is the slope of the linear calibration curve. A comparison of this work with published works related to carbon dots-based fluorescence detection of Cr(VI) is listed in Table S1.† It can be seen that N-GQDs in this work showed a fast response to Cr(VI) with wide linear range and acceptable detection limit (<50 μg L−1 by WHO).36 This result indicated that N-GQDs could be potentially used for fast and quantitative analysis of Cr(VI) in aqueous solution.
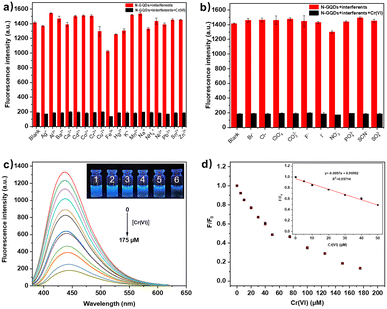 |
| | Fig. 4 (a and b) Fluorescence intensities of N-GQDs with different cations or anions in the absence/presence of Cr(VI) (n = 3); (c) fluorescence emission spectra of N-GQDs with different concentrations of Cr(VI) (inset: photographs of N-GQDs solution with Cr(VI) (1–6: 0, 20, 40, 60, 80 and 100 μM)) under 365 nm UV light; (d) the relationship between F/F0 and the concentration of Cr(VI) (n = 3). | |
Fluorescence detection of folic acid
In this experiment, 17 compounds (glutathione (GSH), glucose, serine (Ser), glycine (Gly), alanine (Ala), L-arginine (L-Arg), L-threonine (L-Thr), L-cysteine (L-Cys), L-lysine (L-Lys), L-glutamic acid (L-Glu), L-histidine (L-His), folic acid (FA), ascorbic acid (AA), vitamin B6 (VB6), nicotinamide, citric acid (CA) and urea) were selected to explore the selectivity of N-GQDs. As shown in Fig. S8†, 5a and b, the fluorescence intensity of N-GQDs was remarkably quenched by FA and the presence of other compounds did not affect the detection of FA. The investigation of response time showed that the fluorescence intensity of N-GQDs was also instantly (<10 s) quenched by FA (Fig. S9†). The sensitivity for FA was studied by adding different amounts of FA (0–200 μM) to N-GQDs aqueous solution. As seen from Fig. 5c, the fluorescence intensity of the solution gradually decreased with the increase of FA. The quenching efficiency F/F0 versus FA concentration was plotted as shown in Fig. 5d. The linear equation is F/F0 = −0.0037C(FA) + 0.9444, and the correlation coefficient is R2 = 0.9967. The detection limit is 2.1 μM, calculated by the (3σ/k) method. These results indicated that N-GQDs could be potentially employed as a probe for the quantitative detection of FA.
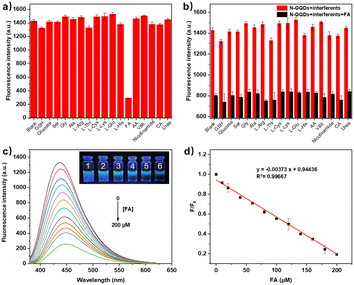 |
| | Fig. 5 (a) Fluorescence intensities of N-GQDs with different compounds (200 μM) (n = 3); (b) fluorescence intensities of N-GQDs with different compounds in the absence/presence of FA (100 μM) (n = 3); (c) fluorescence spectra of N-GQDs with different concentrations of FA (inset: photographs of N-GQDs solution with FA (1–6: 0, 20, 40, 60, 80 and 100 μM)) under 365 nm UV light; (d) the relationship between F/F0 and the concentration of FA (n = 3). | |
Testing of actual samples
In order to investigate the reliability of this method, the detection of Cr(VI) and folic acid in actual samples was further investigated. As shown in Tables 1 and 2, the recoveries of Cr(VI) in tap water, bottled drinking water and lake water and FA in FA tablet and orange juice were 92–105% with relative standard deviations (RSD) less than 5%. Therefore, N-GQDs could be potentially employed as dual-functional sensors for the detection of Cr(VI) and folic acid in the fields of environmental monitoring and drug analysis.
Table 1 Detection of Cr(VI) in actual water samples (n = 3)
| Samples |
Spiked (μM) |
Found (μM) |
Recovery (%) |
RSD (%) |
| Tap water |
10 |
9.94 |
99.42 |
0.56 |
| 20 |
18.51 |
92.55 |
0.52 |
| 40 |
40.82 |
102.06 |
4.44 |
| Bottled drinking water |
10 |
9.76 |
97.58 |
3.07 |
| 20 |
20.66 |
103.29 |
1.14 |
| 40 |
39.95 |
99.89 |
3.53 |
| Lake water |
10 |
10.15 |
101.54 |
1.17 |
| 20 |
20.36 |
101.79 |
2.92 |
| 40 |
38.93 |
97.33 |
1.07 |
Table 2 Detection of FA in actual samples (n = 3)
| Samples |
Spiked (μM) |
Found (μM) |
Recovery (%) |
RSD (%) |
| FA tablet |
0 |
23.91 |
|
1.16 |
| 20 |
43.32 |
98.66 |
2.17 |
| 80 |
105.94 |
101.95 |
4.25 |
| 120 |
144.39 |
100.98 |
1.38 |
| Orange juice |
0 |
4.04 |
|
0.71 |
| 40 |
46.01 |
104.47 |
0.80 |
| 100 |
99.58 |
95.71 |
3.29 |
| 140 |
148.81 |
103.31 |
1.04 |
Exploration of quenching mechanism
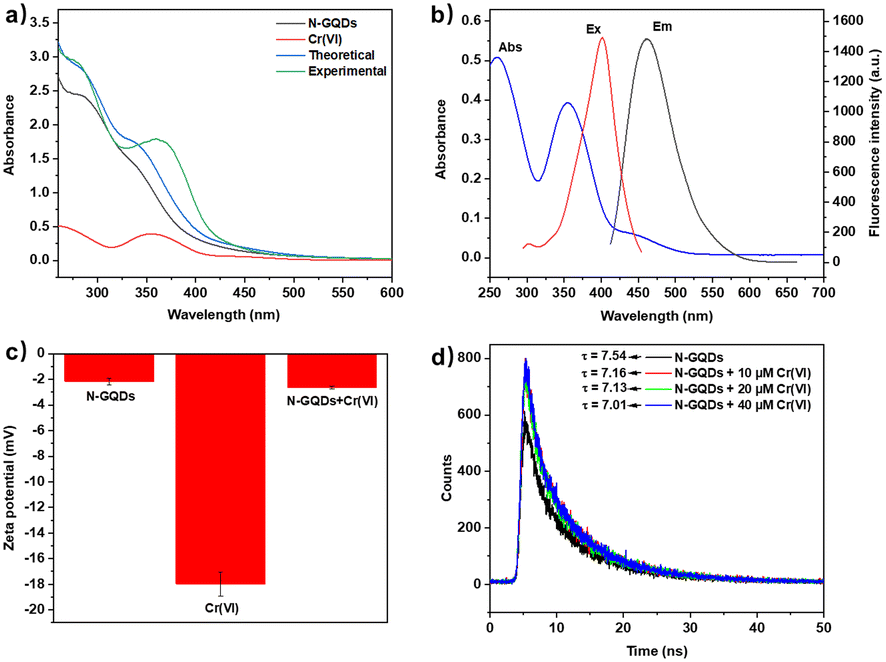
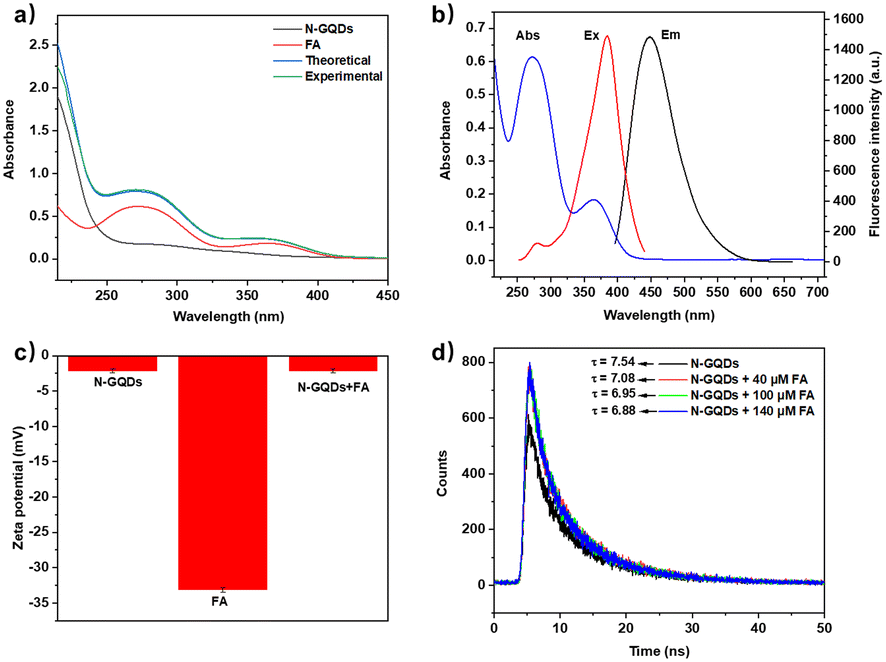
To explore the fluorescence quenching mechanisms of N-GQDs for sensing Cr(VI) and FA, UV-vis and fluorescence spectroscopy, zeta potential and fluorescence lifetime measurement were used. As illustrated in Fig. 6a, a new absorption peak was formed at around 360 nm in the experimental UV-vis absorption spectrum of the N-GQDs/Cr(VI) mixture, which did not agree with the theoretical absorption spectrum. This result indicated the formation of non-fluorescent ground state complexes and a static quenching mechanism.37 Additionally, Fig. 6b showed that the UV-vis absorption spectrum of Cr(VI) overlapped with both the excitation and emission spectra of N-GQDs, which indicated that the fluorescence quenching mechanism might be inner-filter effect (IFE) and fluorescence resonance energy transfer (FRET).38 To further study the quenching mechanism, the zeta potential and fluorescence lifetimes of N-GQDs without/with Cr(VI) were measured. The negative zeta potential (−2.15 and −17.97 mV) indicated no electrostatic attraction between N-GQDs and Cr(VI) (Fig. 6c) and essentially unchanged fluorescence lifetime (7.54, 7.16, 7.13, and 7.01 ns) ruled out FRET (Fig. 6d).39 Besides, the presence of static quenching effect was verified by Stern–Volmer equation and the IFE ratio was calculated to be 79.74% (Table S5 and Fig. S12b†).40 Therefore, a combination of IFE and static quenching mechanism was proposed for sensing Cr(VI).41 Subsequently, the possible mechanism for sensing FA was investigated using the same methods. As shown in Fig. 7a, the experimental UV-vis absorption spectrum of the N-GQDs/FA mixture agreed with the theoretical absorption spectrum, precluding the formation of non-fluorescent ground state complexes. Fig. 7b indicated the sensing mechanism for FA might be IFE and FRET. Zeta potential measurements indicated no electrostatic attraction between N-GQDs and FA (Fig. 7c), while lifetime measurements indicated the occurrence of FRET in the quenching process (Fig. 7d). Thus, it could be concluded that the possible mechanism for sensing FA might be a combination of IFE (90.11%) and FRET,42 which were also supported by calculation methods (Table S6 and Fig. S12d†).40
 |
| | Fig. 6 (a) UV-vis absorption spectra of N-GQDs, Cr(VI), theoretical and experimental spectra of N-GQDs/Cr(VI); (b) UV-vis absorption spectrum of Cr(VI), fluorescence excitation and emission spectra of N-GQDs; (c) zeta potentials of N-GQDs, Cr(VI) and N-GQDs/Cr(VI) under same conditions; (d) fluorescence lifetime of N-GQDs (without/with Cr(VI)). | |
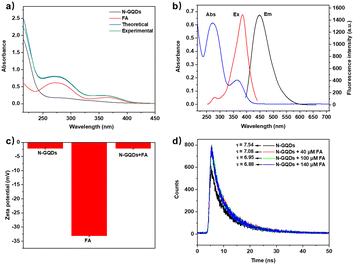 |
| | Fig. 7 (a) UV-vis absorption spectra of N-GQDs, FA, theoretical and experimental spectra of N-GQDs/FA; (b) UV-vis absorption spectrum of FA, fluorescence excitation and emission spectra of N-GQDs; (c) zeta potentials of N-GQDs, FA and N-GQDs/FA under same conditions; (d) fluorescence lifetime of N-GQDs (without/with FA). | |
Conclusions
In summary, blue fluorescent N-GQDs were facially synthesized by a one-pot hydrothermal method using soluble starch and L-arginine as precursors. The compositional and morphological characterization of N-GQDs showed that the nitrogen atom was successfully doped into the GQDs and the particle sizes ranged from 1.0 to 1.5 nm (2–3 graphene layers). At the same time, N-GQDs exhibited excellent pH stability, salt tolerance, thermostability, photobleaching resistance and reproducibility. Moreover, an N-GQDs-based fluorescent platform was developed for “on–off” detection of Cr(VI) and FA in aqueous solution and actual samples. This method showed high selectivity and sensitivity (LoD = 0.80 and 2.1 μM), short response time (<10 s) as well as acceptable recoveries (92–105%). The significant fluorescence quenching mechanisms of N-GQDs were putatively identified as IFE (79.74%)/static quenching for Cr(VI) and IFE (90.11%)/FRET for FA. The prominent advantages of N-GQDs, such as facial synthesis, stable optical properties, excellent reproducibility and rapid responsiveness, make this fluorescent platform a potential alternative for sensing Cr(VI) and folic acid in the fields of environmental monitoring and drug analysis. Further explorations of the synthesis of heteroatom-doped GQDs and their applications are ongoing in our laboratory.
Data availability
The data supporting this article have been included as part of the ESI.†
Author contributions
Chu-Sen Ni and Wen-Jie Zhang: methodology, formal analysis, investigation, and visualization. Wen-Zhu Bi, Ming-Xia Wu, and Su-Xiang Feng: conceptualization, analysis, and writing – review & editing. Xiao-Lan Chen and Ling-Bo Qu: validation and supervision.
Conflicts of interest
There are no conflicts to declare.
Acknowledgements
This work was supported by the Zhongjing Scholars Research Funding of Henan University of Chinese Medicine (No. 00104311-2023-21), and Research Nursery Project of Henan University of Chinese Medicine (MP2023-11).
Notes and references
-
(a) M. Mokarram, A. Saber and V. Sheykh, J. Cleaner Prod., 2020, 277, 123380 CrossRef CAS;
(b) C. Sun, Z. Zhang, H. Cao, M. Xu and L. Xu, Chemosphere, 2019, 219, 538 CrossRef CAS PubMed.
- D. Zheng, W. Yao, C. Sun, X. Chen, J. Zhou, B. Wang, H. Tan, Y. Zhang and Y. Wang, Environ. Sci.: Nano, 2021, 8, 3331 RSC.
-
(a) T. Santonen, S. P. Porras, B. Bocca, R. Bousoumah, R. C. Duca, K. S. Galea, L. Godderis, T. Göen, E. Hardy, I. lavicoli, B. Janasik, K. Jones, E. Leese, V. Leso, H. Louro, N. Majery, S. Ndaw, H. Pinhal, F. Ruggieri, M. J. Silva, A. Nieuwenhuyse, J. Verdonck, S. Viegas, W. Wasowicz, O. Sepai and P. T. J. Scheepers, Environ. Res., 2022, 204, 111984 CrossRef CAS PubMed;
(b) A. Ayele and Y. G. Godeto, J. Chem., 2021, 2021, 1 Search PubMed;
(c) Z. Ma, Y. Ma, M. Gu, X. Huo, S. Ma, Y. Lu, Y. Ning, X. Zhang, B. Tian and Z. Feng, Nanomaterials, 2020, 10, 1924 CrossRef CAS PubMed.
-
(a) J. Yoo, U. Ryu, W. Kwon and K. M. Choi, Sens. Actuators, B, 2019, 283, 426 CrossRef CAS;
(b) V. I. Mikhaylov, E. F. Krivoshapkina, A. L. Trigub, V. V. Stalugin and P. V. Krivoshapkin, ACS Sustain. Chem. Eng., 2018, 6, 9283 CrossRef CAS.
-
(a) J. Chwastowska, W. Skwara, E. Sterlinska and L. Pszonicki, Talanta, 2005, 66, 1345 CrossRef CAS PubMed;
(b) Y. Yang, X. Chen, Y. Wang, M. Wu, Y. Ma and X. Yang, Front. Chem., 2020, 8, 595628 CrossRef CAS PubMed.
-
(a) D. Spanu, D. Monticelli, G. Binda, C. Dossi, L. Rampazzi and S. Recchia, J. Hazard. Mater., 2021, 412, 125280 CrossRef CAS PubMed;
(b) Q. Huang, Q. Bao, C. Wu, M. Hu, Y. Chen, L. Wang and W. Chen, J. Pharm. Anal., 2022, 12, 104 CrossRef PubMed.
-
(a) A. Ravindran, M. Elavarasi, T. C. Prathna, A. M. Raichur, N. Chandrasekaran and A. Mukherjee, Sens. Actuators, B, 2012, 166–167, 365 CrossRef CAS;
(b) M. Liu, T. Li, C. Zhang, Y. Zheng, C. Wu, J. Zhang, K. Zhang and Z. Zhang, J. Hazard. Mater., 2021, 415, 125699 CrossRef CAS PubMed.
-
(a) S. Abbasi and A. Bahiraei, Food Chem., 2012, 133, 1075 CrossRef CAS;
(b) D. Zheng, W. Yao, C. Sun, X. Chen, J. Zhou, B. Wang, H. Tan, Y. Zhang and Y. Wang, Environ. Sci.: Nano, 2021, 8, 3331 RSC.
- S. Guo, L. Zheng, W. He, C. Chai, X. Chen, S. Ma, N. Wang, M. Choi and W. Bian, Arabian J. Chem., 2023, 16, 104520 CrossRef CAS.
-
(a) T. K. Krishnapriya, S. Prasanth, A. Deepti, P. S. Baby Chakrapani, A. S. Asha and M. K. Jayaraj, Microchem. J., 2023, 188, 108470 CrossRef CAS;
(b) Y. Shulpekova, V. Nechaev, S. Kardasheva, A. Sedova, A. Kurbatova, E. Bueverova, A. Kopylov, K. Malsagova, J. C. Dlamini and V. lvashkin, Molecules, 2021, 26, 3731 CrossRef CAS PubMed.
-
(a) M. Ortbauer, D. Ripper, T. Fuhrmann, M. Lassi, S. Auernigg-Haselmaier, C. Stiegler and J. König, Mol. Nutr. Food Res., 2016, 60, 949 CrossRef CAS PubMed;
(b) W. Dong, L. Wang, R. Zhang, C. Wen, R. Su, X. Gong and W. Liang, Dalton Trans., 2023, 52, 6551 RSC;
(c) M. Yang, C. Wang, Y. Yan, E. Liu, X. Hu, H. Hao and J. Fan, Mater. Res. Bull., 2021, 144, 111509 CrossRef CAS.
- X. Y. Zhan, B. Wang and L. P. Yu, J. Chin. Chem. Soc., 2022, 69, 486 CrossRef CAS.
-
(a) S. Guo, L. Zheng, W. He, C. Chai, X. Chen, S. Ma, N. Wang, M. Choi and W. Bian, Arabian J. Chem., 2023, 16, 104520 CrossRef CAS;
(b) F. Wang, M. Cao, N. Wang, N. Muhammad, S. Wu and Y. Zhu, Food Chem., 2018, 239, 62 CrossRef CAS PubMed.
-
(a) S. Alexander, A. Prasantha Sudhakaran and T. S. Anirudhan, Int. J. Polym. Mater. Polym. Biomater., 2023, 73, 523 CrossRef;
(b) A. Sreekumar, L. Durai and S. Badhulika, New J. Chem., 2023, 47, 8845 RSC.
-
(a) D. Kong, L. Liu, S. Song, H. Kuang and C. Xu, Food Agric. Immunol., 2016, 27, 841 CrossRef CAS;
(b) Y. He, S. Wang and J. Wang, Food Anal. Methods, 2021, 14, 1637 CrossRef.
-
(a) B. Batra, V. Narwal, V. Kalra, M. Sharma and J. S. Rana, Process Biochem., 2020, 92, 343 CrossRef;
(b) L. Lai, F. Yan, G. Chen, Y. Huang, L. Huang and D. Li, Molecules, 2023, 28, 5689 CrossRef CAS PubMed;
(c) Y. Yang, F. Gao, Y. Wang, H. Li, J. Zhang, Z. Sun and Y. Jiang, Molecules, 2022, 27, 8421 CrossRef CAS PubMed.
-
(a) M. Batool, H. M. Junaid, S. Tabassum, F. Kanwal, K. Abid, Z. Fatima and A. T. Shah, Crit. Rev. Anal. Chem., 2022, 52, 756 CrossRef CAS PubMed;
(b) Y. Guo, R. Wang, C. Wei, Y. Li, T. Fang and T. Tao, Food Chem., 2023, 415, 135749 CrossRef CAS PubMed;
(c) S. Rajendran, V. UshaVipinachandran, K. H. B. Haroon, I. Ashokan and S. K. Bhunia, Anal. Methods, 2022, 14, 4263 RSC.
- For selected examples, see:
(a) S. Roy, S. Bardhan, D. Mondal, I. Saha, J. Roy, S. Das, D. K. Chanda, P. Karmakar and S. Das, Sens. Actuators, B, 2021, 348, 130662 CrossRef CAS;
(b) H. Tian, G. Ju, M. Li, W. Fu, Y. Dai, Z. Liang, Y. Qin and X. Yin, RSC Adv., 2021, 11, 35946 RSC;
(c) J. Hu, X. Wang, H. Wei, L. Zhao, B. Yao, C. Zhang, J. Zhou, J. Liu and S. Yang, Biosensors, 2022, 12, 432 CrossRef CAS PubMed;
(d) Y. Jia, S. Wu, Z. Duan, S. Song, S. Shuang, X. Gong and C. Dong, Spectrochim. Acta, Part A, 2022, 278, 121343 CrossRef CAS PubMed;
(e) X. Mei, D. Wang, S. Wang, J. Li and C. Dong, Anal. Bioanal. Chem., 2022, 414, 7253 CrossRef CAS PubMed;
(f) G. Wang, S. Zhang, J. Cui, W. Gao, X. Rong, Y. Lu and C. Gao, Anal. Chim. Acta, 2022, 1195, 339478 CrossRef CAS PubMed;
(g) E. K. Adotey, M. A. Torkmahalleh, P. K. Hopke and M. P. Balanay, Sensors, 2023, 23, 1632 CrossRef CAS PubMed;
(h) Q. Chen, N. Li, Y. Tian, Q. Liu, X. Zou and M. Fan, Analyst, 2023, 148, 2818 RSC;
(i) M. Rangel, S. Saluja, V. Barba, J. S. Pérez-Huerta and V. Agarwal, J. Environ. Chem. Eng., 2023, 11, 109438 CrossRef CAS.
- For selected examples, see:
(a) Z. Mu, J. Hua and Y. Yang, Spectrochim. Acta, Part A, 2020, 224, 117444 CrossRef CAS PubMed;
(b) W. Zhang, B. Wu, Z. Li, Y. Wang, J. Zhou and Y. Li, Spectrochim. Acta, Part A, 2020, 229, 117931 CrossRef CAS PubMed;
(c) L. Liu, M. Qian, Z. Q. Yang, L. Xiao, X. Gong and Q. Hu, Dyes Pigm., 2023, 209, 110877 CrossRef CAS;
(d) D. Kurniawan, R. C. Jhang, K. K. Ostrikov and W. H. Chiang, ACS Appl. Mater. Interfaces, 2021, 13, 34572 CrossRef CAS PubMed;
(e) B. Liu, S. Wei, E. Liu, H. Zhang, P. Lu, J. Wang and G. Sun, Spectrochim. Acta, Part A, 2022, 268, 120661 CrossRef CAS PubMed;
(f) W. Li, X. Zhang, C. Miao, R. Li and Y. Ji, Anal. Bioanal. Chem., 2020, 412, 2805 CrossRef CAS PubMed;
(g) B. Wang, L. Guo, X. Yan, F. Hou, L. Zhong and H. Xu, Spectrochim. Acta, Part A, 2023, 285, 121891 CrossRef CAS PubMed.
- P. Kadyan, R. Malik, S. Bhatia, A. Al Harrasi, S. Mohan, M. Yadav, S. Dalal, S. Ramniwas, S. K. Kataria and T. Arasu, J. Nanomater., 2023, 2023, 1 CrossRef.
-
(a) K. Li, X. Zhao, G. Wei and Z. Su, Curr. Med. Chem., 2018, 25, 2876 CrossRef CAS PubMed;
(b) A. Ghaffarkhah, E. Hosseini, M. Kamkar, A. A. Sehat, S. Dordanihaghighi, A. Allahbakhsh, C. Kuur and M. Arjmand, Small, 2021, 18, 2102683 CrossRef PubMed;
(c) V. Kansara, R. Shukla, S. J. S. Flora, P. Bahadur and S. Tiwari, Mater. Today Commun., 2022, 31, 103359 CrossRef CAS.
-
(a) M. J. Im, J. I. Kim, S. K. Hyeong, B. J. Moon and S. Bae, Small, 2023, 19, 2304497 CrossRef CAS PubMed;
(b) R. Rabeya, S. Mahalingam, A. Manap, M. Satgunam, M. Akhtaruzzaman and C. H. Chia, Int. J. Quantum Chem., 2022, 122, e26900 CrossRef CAS;
(c) B. Li, Y. Wang, L. Huang, H. Qu, Z. Han, Y. Wang, M. J. Kipper, L. A. Belfiore and J. Tang, Synth. Met., 2021, 276, 116758 CrossRef CAS.
- Y. Hu, W. Ji, J. Qiao, H. Li, Y. Zhang and J. Luo, J. Fluoresc., 2021, 31, 1379 CrossRef CAS PubMed.
- F. Nemati, R. Zare-Dorabei, M. Hosseini and M. R. Ganjali, Sens. Actuators, B, 2018, 255, 2078 CrossRef CAS.
-
(a) J. Nag, K. Rawat, K. Asokan, D. Kanjilal and H. B. Bohidar, Phys. E, 2018, 104, 36 CrossRef CAS;
(b) S. Kadian and G. Manik, Food Chem., 2020, 317, 126457 CrossRef CAS PubMed.
- W. Chen, D. Li, L. Tian, W. Xiang, T. Wang, W. Hu, Y. Hu, S. Chen, J. Chen and Z. Dai, Green Chem., 2018, 20, 4438 RSC.
- S. Tao, T. Feng, C. Zheng, S. Zhu and B. Yang, J. Phys. Chem. Lett., 2019, 10, 5182 CrossRef CAS PubMed.
- X. Jin, L. Tan, Z. Zhao, M. Li, Q. Zhou, J. Zhang, T. Lv, Q. Deng, J. Wang, Z. Zeng, S. Deng and G. Dai, New J. Chem., 2023, 47, 2221 RSC.
-
(a) S. Gu, C. T. Hsieh, Y. Y. Tsai, Y. A. Gandomi, S. Yeom, K. D. Kihm, C. C. Fu and R. S. Juang, ACS Appl. Energy Mater., 2019, 2, 790 CAS;
(b) L. Chen, J. Zheng, Q. Du, Y. Yang, X. Liu and B. Xu, Opt. Mater., 2020, 109, 110346 CrossRef CAS.
- Q. Xie, R. Li and Z. Li, Anal. Chim. Acta, 2024, 1292, 342224 CrossRef CAS PubMed.
-
(a) P. R. Kharangarh, S. Umapathy and G. Singh, J. Appl. Phys., 2017, 122, 145107 CrossRef;
(b) A. P. d. M. Rocha, M. I. Alayo and D. M. da Silva, Appl. Sci., 2022, 12, 8686 CrossRef CAS.
- L. Sheng, B. Huangfu, Q. Xu, W. Tian, Z. Li, A. Meng and S. Tan, J. Alloys Compd., 2020, 820, 153191 CrossRef CAS.
- R. Zhang and W. Chen, Biosens. Bioelectron., 2014, 55, 83 CrossRef CAS PubMed.
- Q. Mei, J. Chen, J. Zhao, L. Yang, B. Liu, R. Liu and Z. Zhang, ACS Appl. Mater. Interfaces, 2016, 8, 7390 CrossRef CAS PubMed.
-
(a) S. K. Cushing, M. Li, F. Huang and N. Wu, ACS Nano, 2014, 8, 1002 CrossRef CAS PubMed;
(b) F. Liu, M. H. Jang, H. D. Ha, J. H. Kim, Y. H. Cho and T. S. Seo, Adv. Mater., 2013, 25, 3657 CrossRef CAS PubMed.
- M. Hahn, M. Jang, Y. Cho, M. Bae, M. Y. Han and Y. Piao, Opt. Mater., 2024, 147, 114642 CrossRef CAS.
- Y. Luo, C. Cui, X. Zhang, Y. Jiang, Z. Xiang, C. Ji and Z. Peng, Molecules, 2023, 28, 1566 CrossRef CAS PubMed.
-
(a) X. Y. Sun, M. J. Yuan, B. Liu and J. S. Shen, RSC Adv., 2018, 8, 19786 RSC;
(b) B. Al-Hashimi, K. M. Omer and H. S. Rahman, Arabian J. Chem., 2020, 13, 5151 CrossRef CAS.
- L. Yang, J. Wen, K. Li, L. Liu and W. Wang, Sens. Actuators, B, 2021, 333, 129557 CrossRef CAS.
- M. C. Lu, C. J. Pan, X. Z. Qin and M. X. Wu, ACS Omega, 2023, 8, 14499 CrossRef CAS PubMed.
- W. Chen, H. Lin, Y. Wu, M. Yang, X. Zhang, S. Zhu, M. He, J. Xie and Z. Shi, Adv. Compos. Hybrid Mater., 2022, 5, 2378 CrossRef CAS.
- X. Liu, W. Yu, X. Mu, W. Zhang, X. Wang and Q. Gu, Spectrochim. Acta, Part A, 2023, 287, 122112 CrossRef CAS PubMed.
Footnotes |
| † Electronic supplementary information (ESI) available. See DOI: https://doi.org/10.1039/d4ra05016a |
| ‡ These authors contributed equally to this work and should be considered as co-first authors. |
|
| This journal is © The Royal Society of Chemistry 2024 |
Click here to see how this site uses Cookies. View our privacy policy here. 
 Open Access Article
 This Open Access Article is licensed under a Creative Commons Attribution-Non Commercial 3.0 Unported Licence
 *ab,
Ming-Xia Wu*ab,
Su-Xiang Feng*bcd,
Xiao-Lan Chen
*ab,
Ming-Xia Wu*ab,
Su-Xiang Feng*bcd,
Xiao-Lan Chen