 Open Access Article
Development and characterization of a biodegradable film based on guar gum-gelatin@sodium alginate for a sustainable environment
Syed Kashif Hussain Shah Bukharya,
Faheem Khalid Choudharya,
Dure Najaf Iqbal*a,
Zahid Alia,
Ayesha Sadiqaa,
Shoomaila Latifb,
Khairia Mohammed Al-Ahmaryc,
Sehar Basheerd,
Ijaz Alie and
Mahmood Ahmed *d
*d
aDepartment of Chemistry, The University of Lahore, Lahore, Pakistan. E-mail: dure_najaf80@yahoo.com
bSchool of Physical Sciences, University of the Punjab, Lahore, 54590, Pakistan
cDepartment of Chemistry, College of Science, University of Jeddah, Jeddah, Saudi Arabia
dDepartment of Chemistry, Division of Science and Technology, University of Education, Lahore, 54770, Pakistan. E-mail: mahmood.ahmed@ue.edu.pk; mahmoodresearchscholar@gmail.com
eCentre for Applied Mathematics and Bioinformatics (CAMB), Gulf University for Science and Technology, Hawally, Kuwait
First published on 17th June 2024
Abstract
A significant amount of plastic trash has been dumped into the environment across the world, contributing to the present white pollution crisis. Therefore, plastic manufacturing and disposal must be examined. Biodegradable plastics (BPs) have recently become the subject of study due to their beneficial biodegradability and harmlessness, and they have been the most efficient method for addressing the issue of plastic pollution. This study aims to enhance the synthesis of biodegradable polymers from sodium alginate (Na-Alg) with the addition of guar gum, corn starch, and gelatin using the solution-casting method, followed by mixing in suitable proportions and drying at a certain temperature, resulting in thin film formation. To enhance qualities of the already produced polymer, additional substances such as glycerol, PVA, and latex were added as plasticizers. Characterization techniques such as scanning electron microscopy (SEM), tensile strength, thermogravimetric analysis (TGA), energy dispersive spectroscopy (EDS), X-ray diffraction (XRD), differential scanning calorimetry (DSC), UV-vis spectroscopy, and Fourier transform infrared (FTIR) spectroscopy were used to study structural characteristics, surface morphology, polymeric linkages, water absorption capabilities, chemical conductivity, and light transmittance of the newly formed films. These characterization results depict a remarkable achievement in the sense of the high degradability and impressive tensile strength of the newly formed films. In addition, SEM images indicated a porous structure with interconnected pores. FT-IR confirms the occurrence of molecular interactions between separate components. Consequently, different films showed different behavior of degradability, and it is suggested from interpreting the results that the polymeric films may be a viable biodegradable option.
1 Introduction
Nobody can deny the importance of synthetic polymers especially plastics and polythene bags, which dominate all the fields of human life. For not more than the past 40–50 years, the plastic and polythene industry has shown gigantic growth because of its high adaptability and flexibility and is manufactured from core non-renewable raw components such as petrochemicals. Over 1000 million tons of plastic were dumped as garbage, and its decomposition may take hundreds of years. The use of plastic is growing by a consistent percentage in municipal solid waste.1–3 Long-term exposure of synthetic non-biodegradable polymers to air, water, and sunlight causes the release of profoundly toxic pollutants that can drain into water supplies. These toxins are cancer-causing and can cause serious damage to the metabolism of living organisms after they are absorbed.4,5 The growing use of plastics has drawn the attention of researchers towards the use and preparation of safe plastics that have no harmful impact on the environment and mankind. Due to the problems created by non-biodegradable plastics because of their low disposal rate and harmful effects on the environment, many researchers have put forward their best for the synthesis of biodegradable plastic. Problems associated with the usage of these types of non-biodegradable plastics have attracted the attention of different waste management companies and industries to take steps toward the disposal of such plastic waste. Despite the considerable efforts made by waste management companies, there is still a question that arises about the degradation of such types of non-biodegradable plastics. Therefore, the best alternative to this problem is using biodegradable plastics that can be easily biodegraded by microorganisms into biomass and other products that have no harmful effect on the environment.6–8Blends of different biodegradable plastics, such as polylactic acid/polybutyric acid (PLA/PBA), polycaprolactone/thermoplastic starch (PCL/TPS), polylactic acid/thermoplastic starch (PLA/TPS), polyvinyl alcohol/cellulose nano crystals (PVA/CNC) and many others, were formulated for the packaging industries.9 Biodegradable plastic can be synthesized by different methods, for example, plastic made from fossil resources and renewable resources. Biodegradable plastics made from fossil fuels are mainly used in addition to different blends, such as starch. Examples of such biodegradable plastics are polycaprolactone (PCL) and polybutylene succinate (PBS). Biodegradable plastics made from renewable resources, such as biomass feed stock, are very good for commercial purposes. Examples of such biodegradable plastics are polylactic acid (PLA) and polyhydroxyalkanoates (PHA).10–13 The starch-based semi-synthetic bio bags are those that include a combination of chemical and natural components and may be manufactured from the most readily accessible materials. Plant-based materials have attracted much attention and have started to become dominant.14 Although both natural and synthetic polymers have been identified, natural polymers are preferred because they are less expensive and non-toxic. Natural polymers are far more bio-compatible and biodegradable than synthetic polymers. Starch is an excellent natural polymer and a polysaccharide because of its propensity to be biodegradable.15,16 Polysaccharides are made up of monosaccharide molecules, resulting in a dense polymeric network; they are widely known in nature owing to their abundance of resources. They are stable, safe to use, degraded by microorganisms, nontoxic, and have a hydrophilic nature.9,17–19 Starch is a form of a polysaccharide and provides an outstanding low-cost foundation for novel biodegradable polymers.14,19,20 Starch-based bioplastic bags are simple to produce and have a wide range of applications in packaging. These bio bags decompose over 10–40 days depending on environmental factors, such as temperature. Starch's tensile properties allow it to be used as packing material, and glycerol is added to starch as a plasticizer.21,22
Implementing sustainable practices aids in lowering our environmental effects and conserving the environment for future generations. This suggests that improvements in the packing industry will favor a new breed of biomaterials in the near future. To this end, maintaining the strong environmental sustainability and conservation culture that has evolved in recent years is important. Although certain starch-based items and other biopolymers are not yet expensive with oil polymers, this might change as costs increase. By mixing starch with other polymers, utilizing starch in composite materials, and using starch as a biodegradable feedstock to produce other biopolymers, starch-based plastics have proven effective in producing alternative solutions to petroleum-based polymers. As the market for sustainable plastics drives additional investment and creativity, starch's possibilities in the packaging industry are now becoming better.8,23–25
The main objective of this research is to make clear discrimination between non-biodegradable and biodegradable polymers or biopolymers and replace these synthetic polymers, such as plastics, with cost-effective and environmentally friendly degradable polymers. In this research, an attempt is made to discover possibilities to produce biodegradable polymers in the form of films that may be commercially available on the market and may then be cast in the form of bags. Thus, this study presents the preparation and characterization of a novel biodegradable film. The biodegradable film was synthesized by applying the solution-casting method using guar gum with the addition of sodium alginate (Na-alginate), corn starch, latex, polyvinyl alcohol (PVA), glycerol, and gelatin. All the biodegradable forming film contents were mixed in suitable proportions and dried at a certain temperature. Glycerol is the most starch-compatible plasticizing agent that can endow polymers with flexibility and resilience. Moreover, gelatin, a protein of animal origin, exhibits excellent thermoreversible capability and thermal stability, presenting a possible barrier performance. The optimized films were further characterized by scanning SEM, TGA, EDS, XRD, DSC, UV-Vis spectroscopy, and FTIR.
2 Materials and methods
2.1. Reagents and chemicals
Guar gum (thickness of 5000 cps), glycerol, latex, polyvinyl alcohol, gelatin, and sodium alginate were purchased from Sigma Aldrich-USA and a local supplier (Falcon Scientific, Lahore-Pakistan). All the chemicals of AR grade were used as such, and commercially available corn starch was used in all the formulations of the biodegradable films.2.2. Preparation of films
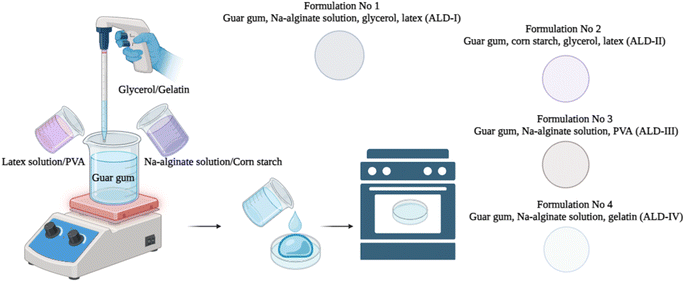
Four different formulations of biodegradable films were developed, and the % ratio of each content used is presented in Table 1. The primary goal of our study is to develop and characterize biodegradable films using guar gum and sodium alginate as the main polymers. To enhance and optimize the properties of these films, we incorporated various additives, such as latex, polyvinyl alcohol (PVA), and glycerol. Multiple trials of each combination were conducted, and the best-performing films were selected for the final product. Gelatin enhances the flexibility of the film, thus reducing its brittleness and increasing its pliability. This is essential for applications that require the film to bend or stretch without breaking. Corn starch exhibits a high level of biodegradability, and its incorporation substantially enhances the total biodegradability of the film. Environmental sustainability is greatly emphasized to ensure that the film decomposes organically over time without leaving behind any detrimental remnants.| Sample ID | % content of each item by ratio | ||||||
|---|---|---|---|---|---|---|---|
| Guar gum | Sodium alginate | Latex | Gelatin | Corn starch | Glycerol | Polyvinyl alcohol | |
| ALD-I | 20 | 60 | 10 | — | — | 10 | — |
| ALD-II | 20 | — | 10 | — | 60 | 10 | — |
| ALD-III | 20 | 60 | — | — | — | — | 20 |
| ALD-IV | 20 | 60 | — | 20 | — | — | — |
2.3. Characterisation
Agilent Cary 630 FT-IR, USA microscope detector type DTGS with a resolution of 16, a wavenumber of 4000–650 cm−1, and 96 background scans were used to identify various functional groups present in the films. Morphological studies of films were examined using a JEOL 6700F Ultra High-Resolution Scanning Electron Microscope, Japan. The Energy Dispersive Spectrograph (EDS) of all the formulated films was examined using a machine Eo LS 10, Zeiss, Germany, at a magnification of 10![[thin space (1/6-em)]](https://www.rsc.org/images/entities/char_2009.gif) 000×. TGA-250 (Bruker International, USA) was used to check the thermal stability of the films in a temperature range of 0–800 °C with a heating rate of 10 °C min−1. XRD (D2 PHASER XRD Analyzer, Bruker-USA) analysis of film samples was performed to determine the crystal structure with a useable angular range of 3–160° 2-Theta. A UV-vis spectrophotometer (Shimadzu Co. UV-2550, Tokyo, Japan) was used to assess the transmittance of light across a wavelength range of 250–800 nm. An SDT (Q600) thermal analyzer (TA Instruments, USA) under a nitrogen atmosphere at a heating rate of 20 °C min−1 was employed for differential scanning calorimetry (DSC) analysis of films. To determine the thickness of the films, a digital micrometer (Mitutoyo 2046F, Micrometer, Japan) was utilized, with an accuracy of 0.001 mm. For every film, readings were taken at ten different random positions, and the mean value was calculated in mm.
000×. TGA-250 (Bruker International, USA) was used to check the thermal stability of the films in a temperature range of 0–800 °C with a heating rate of 10 °C min−1. XRD (D2 PHASER XRD Analyzer, Bruker-USA) analysis of film samples was performed to determine the crystal structure with a useable angular range of 3–160° 2-Theta. A UV-vis spectrophotometer (Shimadzu Co. UV-2550, Tokyo, Japan) was used to assess the transmittance of light across a wavelength range of 250–800 nm. An SDT (Q600) thermal analyzer (TA Instruments, USA) under a nitrogen atmosphere at a heating rate of 20 °C min−1 was employed for differential scanning calorimetry (DSC) analysis of films. To determine the thickness of the films, a digital micrometer (Mitutoyo 2046F, Micrometer, Japan) was utilized, with an accuracy of 0.001 mm. For every film, readings were taken at ten different random positions, and the mean value was calculated in mm.
2.4. Biodegradability test
A soil burial test was used to determine the biodegradability of the hydrogel samples. For this purpose, natural soil was taken from the University of Lahore-Pakistan campus, and the weighed amount (Wi) of the sample was buried in the soil at a depth of 10 cm. The incubation temperature for the samples was maintained at 25 °C. The degraded samples of films were taken out of the soil at time intervals of 10, 20, 30, 40, and 50 days and weighed each time (Wf). The degradation of the samples was then calculated using eqn (1):
 | (1) |
3 Results and discussion
The biodegradable films were successfully developed by applying a solution-casting method using guar gum with the addition of Na-alginate, corn starch, latex, polyvinyl alcohol (PVA), glycerol, and gelatin.3.1. FTIR and XRD analysis
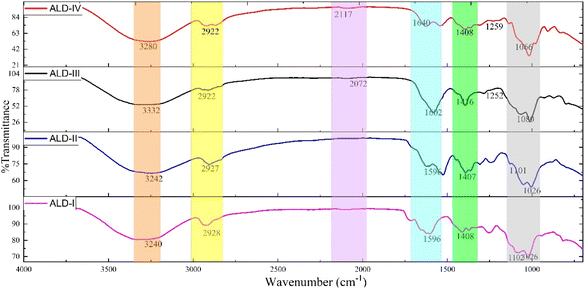
The FTIR spectra of the formulated film samples (ALD-I, ALD-II, ALD-III, and ALD-IV) are presented in Fig. 2. For ALD-I, the characteristic peaks observed around 3240 cm−1 belong to the free alcohol of guar gum and peak at 2928 cm−1 –CH stretching for –CH2 of glycerol. A sharp peak around 1596 cm−1 indicates –NH stretching of Na-alginate, and a sharp peak at 1408 cm−1 belongs to the bending of the –CH2 group present in all blended molecules. An intense peak at 1102 cm−1 belongs to –C–N stretching and a strong peak at 1026 cm−1 belongs to –CO stretching of latex. For ALD-II, the characteristic peaks observed around 3242 cm−1 belong to the free alcohol of cornstarch and peak at 2927 cm−1 –CH stretching for –CH2 of glycerol. A sharp peak around 1596 cm−1 indicates –NH stretching of gelatin, and a sharp peak at 1407 cm−1 belongs to the bending of the –CH2 group present in all blended molecules. An intense peak at 1101 cm−1 belongs to –C–N stretching, and a strong peak at 1026 cm−1 belongs to –CO stretching of latex. For ALD-III, the characteristic peaks are observed as follows: O–H stretching at 3332 cm−1 broad peaks, C–H stretching for CH2 at 2922 cm−1, –C![[triple bond, length as m-dash]](https://www.rsc.org/images/entities/char_e002.gif) C- stretching for asymmetrical alkynes at 2072 cm−1, an exact peak originating at 1602 cm−1 indicating N–H stretching, a sharp peak for C–H bending of CH2 appearing at 1416 cm−1, a characteristic peak at 1252 cm−1 of C–N stretching, and strong absorption of C–O stretching at 1080 cm−1. For ALD-IV, the characteristic peaks were observed as follows: O–H stretching at 3280 cm−1 broad peaks, C–H stretching for CH2 at 2922 cm−1, –C
C- stretching for asymmetrical alkynes at 2072 cm−1, an exact peak originating at 1602 cm−1 indicating N–H stretching, a sharp peak for C–H bending of CH2 appearing at 1416 cm−1, a characteristic peak at 1252 cm−1 of C–N stretching, and strong absorption of C–O stretching at 1080 cm−1. For ALD-IV, the characteristic peaks were observed as follows: O–H stretching at 3280 cm−1 broad peaks, C–H stretching for CH2 at 2922 cm−1, –C![[triple bond, length as m-dash]](https://www.rsc.org/images/entities/char_e002.gif) C– stretching of asymmetrical alkynes at 2117 cm−1, an exact peak originating at 1640 cm−1 indicating N–H stretching, a sharp peak for C–H bending for CH2 appearing at 1408 cm−1, C–N stretching appearing at 1259 cm−1, and a characteristic peak at 1066 cm−1 of C–O–H bending. The presence of the chief functional groups of all the blended molecules confirmed the formation of all the developed composite matrix films.
C– stretching of asymmetrical alkynes at 2117 cm−1, an exact peak originating at 1640 cm−1 indicating N–H stretching, a sharp peak for C–H bending for CH2 appearing at 1408 cm−1, C–N stretching appearing at 1259 cm−1, and a characteristic peak at 1066 cm−1 of C–O–H bending. The presence of the chief functional groups of all the blended molecules confirmed the formation of all the developed composite matrix films.
XRD is a non-destructive method used to characterize the structure, phases, crystallinity, and strain of crystalline materials. XRD is constructed on the brag's phenomenon (eqn (1)), and XRD patterns are unique to the substance under consideration.
nλ = 2d![[thin space (1/6-em)]](https://www.rsc.org/images/entities/char_2009.gif) sin sin![[thin space (1/6-em)]](https://www.rsc.org/images/entities/char_2009.gif) θ θ
| (2) |
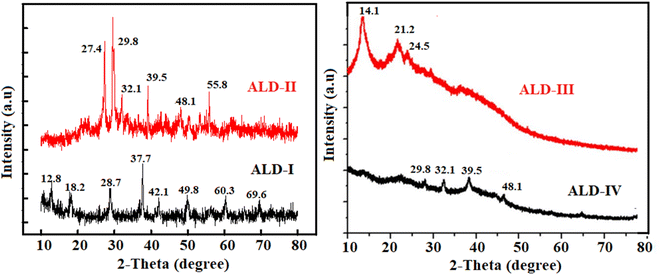
The XRD pattern (Fig. 3) indicated blending between Na-alginate, guar-gum, latex, and glycerol by representing a minimal shift in the 2-theta values. The presence of more guar-gum contents in ALD-I created more compactness, causing more favorable H-bonding and consequently increasing semi-crystalline behavior. The diffractogram of ALD-II shows a trivial shifting of peaks that specified the formation of new bonds between –OH of gelatin, C![[double bond, length as m-dash]](https://www.rsc.org/images/entities/char_e001.gif) O, and –NH2 of corn-starch to exhibit successful bonding of individual constituents of the blended film. XRD diffractogram demonstrates that the ALD-I and II film is more crystalline than ALD-III and IV, resulting in enough bonding of constituents.
O, and –NH2 of corn-starch to exhibit successful bonding of individual constituents of the blended film. XRD diffractogram demonstrates that the ALD-I and II film is more crystalline than ALD-III and IV, resulting in enough bonding of constituents.
3.2. TGA and DSC analyses
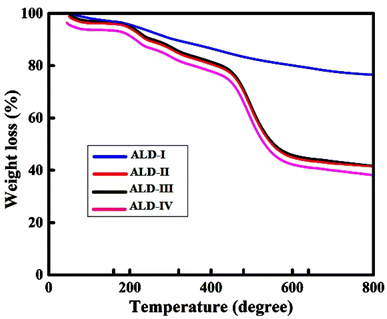
In the first deterioration regime (0–200 °C), a minor weight loss (about 6%) is observed. The first stage's weight reduction is related to volatile organic compounds (VOCs).26 In the initial degradation phase (0–200 °C), the observed decrease in weight of around 6% is mainly attributed to the vaporization of water, moisture, and volatile organic compounds (VOCs). Every film composition consists of components that contribute to the first decrease in weight. In the samples, ALD-I and ALD-II, the glycerol, which is present at a concentration of 10%, evaporates and causes a decrease in weight. Furthermore, all samples, including water and moisture, are absorbed by the polysaccharides (such as guar gum, sodium alginate, and maize starch) and other additives (such as latex, gelatin, and PVA), which are released when heated. In ALD-I, the moisture is released via a mixture of guar gum, sodium alginate, and latex. The moisture loss in ALD-II is mostly caused by the high concentration of maize starch (60%), as well as the presence of guar gum and latex. The inclusion of PVA, in addition to guar gum and sodium alginate, in ALD-III leads to the liberation of any remaining water. In ALD-IV, the gelatin, when mixed with guar gum and sodium alginate, releases water that is bonded to it when heated. In the second degradation regime (200–600 °C), almost 20% weight loss was perceived. During the second stage, a major breakdown of the alginate skeleton occurred. The breakdown of guar gum and Na-alginate caused significant weight loss in the temperature range of 600–800 °C. At 627 °C, almost 20% of the weight was lost (Fig. 4). Consequently, it was concluded that the as-casted films could be used as stable matrices at high temperatures. Initially, the weight loss was due to the release of water or moisture to 7–8%, which occurred at 0–200 °C. Extremely light volatile components are also lost at this stage, and the initial phase of the thermal breakdown process begins owing to VOC evaporation. The process of releasing volatile substances occurring in the range of 200–600 °C is referred to as stage 2. Because corn starch includes amylose particles, which may produce carbon, hydrogen, and oxygen in the volatile corn starch, the process of this step causes rapid heat breakdown with a significant mass loss (22%). The breakdown of gelatin and starch caused a 44% weight loss at 578 °C in the 400–600 °C range. Stage 3 is the stage after the release of volatile materials in the samples at temperatures ranging from 600 to 800 °C.TGA data depict that the ALD-II film withstands high temperatures with the lowest weight loss of around 40% at 800 °C, while the ALD-I film shows comparatively double weight loss i.e., around 80% weight loss at the same temperature of 800 °C. Thus, the ALD-II film is better in the sense of thermal stability. The comparative TGA data of all ALD films emphasize that the ALD-IV withstands high temperatures with respect to all other films. At 800 °C, ALD-IV shows less than 40% weight loss, while ALD-I shows the highest weight loss of more than 80%. The ALD-II and ALD-III films represent almost the same behavior of around 40% weight loss at 800 °C. Hence, it may be concluded that the ALD-IV wins the race in thermal stability.
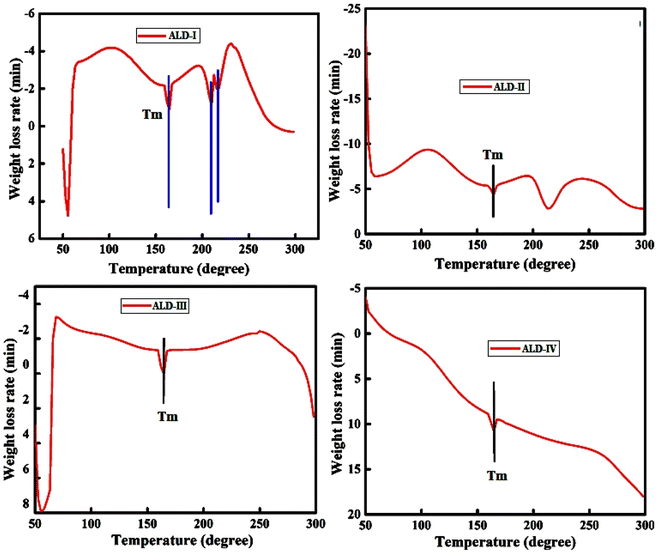
In the DSC thermograms of ALD-I and ALD-III, a phase transition in the endothermic peak at 65.9 °C and 71.9 °C, respectively, represents the removal of loosely bonded water molecules in the Na-alginate due to pyrolysis and rearrangement of the monomer units. The entropy release at 164.6 °C is also attributed to the melting temperature of the films, showing the higher crystallinity and thermal absorbance capabilities. The Tg of sodium alginate was reported to be 158 °C,27,28 and the Tg of guar gum was reported to be 108.25 °C.29 The results are in good agreement with the reported data. The melting point of ALD-II was 164.6 °C, indicating that the thermal absorbance capacity of the film ceased, and first order decay of the polymer began. At 68.6 °C, the evaporation of volatile compounds occurs. The ionic contact and hydrogen bonding between the gelatin's COOH and –NH2 groups of corn starch resulted in acceptable miscibility, which was attributed to electrostatic interactions and intermolecular hydrogen bonds. The DSC curve revealed substantial endothermic absorption at 298 °C, where almost all the weight of the films was lost.
The thermogram of ALD-IV shows the physiochemical transformations, such as “gelatinization”, which clearly indicates that changes in the heat flow with the increase in temperature associated with the first and second order transition of the polymeric material along with zero order decay with the cleavage of any hydrogen bond. This explicitly explains the amorphous or less ordered structural behavior of the samples because of the lower crystallinity.
The DSC thermogram of ALD-I revealed an endothermic peak at 65.9 °C, which might be attributed to the removal of loosely bound water in Na-alginate (Fig. 5a). The thermogram revealed two exothermic peaks at 164.6 °C and 209 °C, which were caused by the pyrolysis reaction in Na-alginate. The exothermic peak at 164.6 °C is also attributed to the melting temperature of the ALD-I. The DSC graph of the samples exhibited a maximum thermal decomposition temperature at 298 °C. Fig. 5b shows a DSC thermogram for ALD-II, which indicates that volatile compounds start evaporating at 68.6 °C. The ionic contact and hydrogen bonding between gelatin's –COOH group and corn starch's –NH2 group result in acceptable miscibility, which is connected to electrostatic interactions and intermolecular hydrogen bonds. The melting point of ALD-II is 164.6 °C, indicating that the sample's thermal absorbance capability has ceased and degradation has begun. The DSC curve indicated substantial endothermic absorption at 298 °C, where nearly all film weights are lost. The DSC thermogram of ALD-III (Fig. 5c) indicates an endothermic peak at 71.9 °C which shows the detachment of loosely bound water in Na-alginate. The thermogram also depicts a sharp exothermic peak at 164.6 °C caused by the pyrolysis reaction in Na-alginate and also exhibited the melting point of the sample.
The DSC graph of the ALD-III shows the maximum thermal decomposition temperature at 298 °C. The DSC thermogram of ALD-IV (Fig. 5d) shows the most different behavior of heat flow with the gradually increased temperature in the calorimeter. The thermogram of ALD-IV shows the amorphous behavior, and this represents that with the increase in temperature, the endothermic heat flow increases until it crosses the melting temperature of the film i.e., 164.6 °C and reaches the decomposition temperature of 298 °C with a maximum weight loss rate. Hence, the DSC thermograms of all ALD films emphasize that the ALD-I and ALD-II samples show maximum crystallinity and thermal absorbance capabilities compared to the other samples and seem to be good alternatives for synthetic polymers.
3.3. SEM and EDS analysis
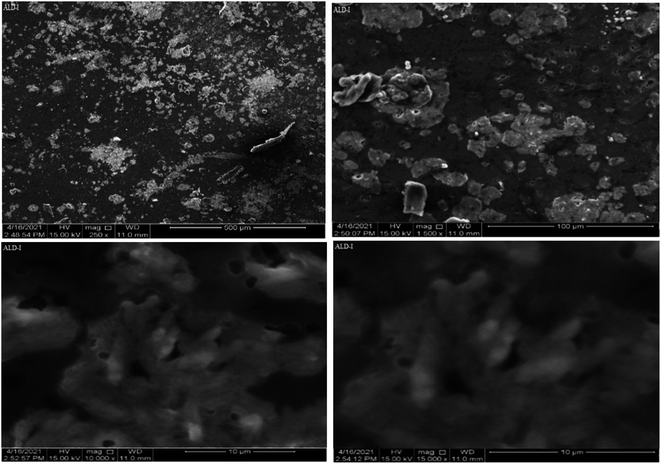
SEM was used to observe the morphology of the newly synthesized biodegradable films. The SEM picture of the flat surface of the newly produced film clearly demonstrated the exquisite merging of polymers.30,31 For blended films, increased porosity and roughness have been reported. Certain characteristics, such as mechanical potency and H2O holding capacities, are influenced by increasing porosity. Consequently, the blended films absorb exudates readily and facilitate cell adhesion, growth, and movement in porous architecture. Images of the samples (Fig. 6–9) were depicted at different magnification levels in the experiment.For ALD-I, the front aspect of the sample reveals hierarchical channels and the tubular form of films at 250×, with tube lengths of 500 μm. The geometry of the particles was random. The length of the tubes was 300 μm after being magnified at 1500×, and the geometry of the sample was cylindrical due to Na-alginate dispersion, as Na-alginate was crystalline. A deeper examination and a closer look at 10![[thin space (1/6-em)]](https://www.rsc.org/images/entities/char_2009.gif) 000× magnification revealed a tubular structure with tube lengths of 10 μm. A further magnification of 15
000× magnification revealed a tubular structure with tube lengths of 10 μm. A further magnification of 15![[thin space (1/6-em)]](https://www.rsc.org/images/entities/char_2009.gif) 000× reveals the length of the tubes to be 10 μm and the diameter to be 2 μm.
000× reveals the length of the tubes to be 10 μm and the diameter to be 2 μm.
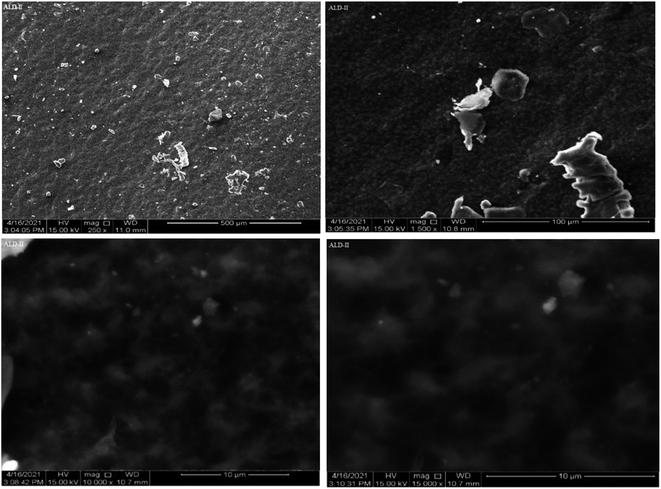
For ALD-II, the sample at 250× magnification reveals hierarchical channels and the tubular form of films with tube lengths of 500 μm. The geometry of the particles was random. A further magnification of 1500× showed a length of particles of 100 μm, while a closer look at 10![[thin space (1/6-em)]](https://www.rsc.org/images/entities/char_2009.gif) 000× magnification revealed a tubular structure with tube lengths of 10 μm. A further magnification of 15
000× magnification revealed a tubular structure with tube lengths of 10 μm. A further magnification of 15![[thin space (1/6-em)]](https://www.rsc.org/images/entities/char_2009.gif) 000× reveals the length of the tubes to be 10 μm and the diameter to be 2 μm.
000× reveals the length of the tubes to be 10 μm and the diameter to be 2 μm.
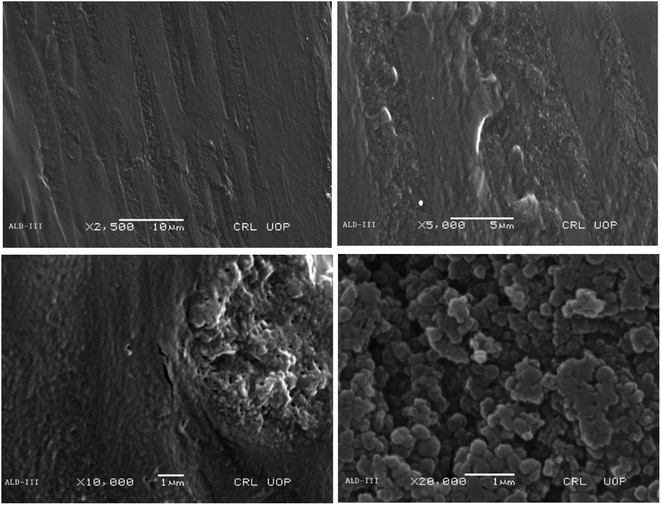
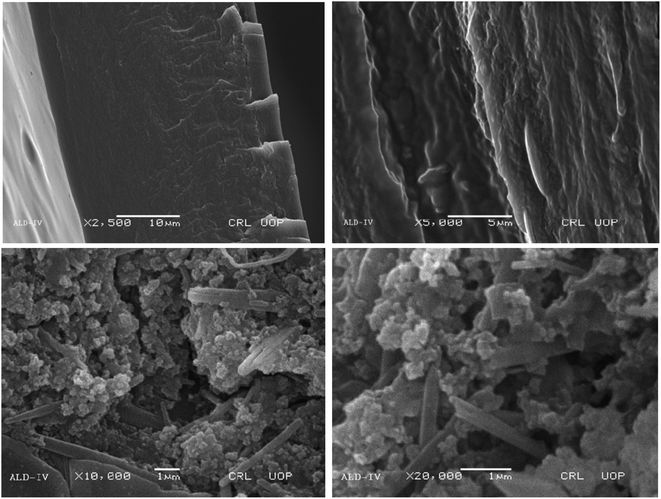
The porous nature of the films, which is essential for enabling quick swelling and, consequently, improving their biodegradability, was revealed by the SEM examination. Because of its porous character, which facilitates effective fluid or environmental element absorption and speeds up degradation processes, it is desirable. The SEM images of ALD-III are shown in Fig. 8 at magnifying powers of 2500× at a distance of 10 μm, 5000× at a distance of 5 μm, 10![[thin space (1/6-em)]](https://www.rsc.org/images/entities/char_2009.gif) 000× at a distance of 1 μm and 20
000× at a distance of 1 μm and 20![[thin space (1/6-em)]](https://www.rsc.org/images/entities/char_2009.gif) 000× at a distance of 1 μm.
000× at a distance of 1 μm.
The SEM images for ALD-IV revealed that the geometry of particles in the sample was random and cylindrical due to the presence of crystalline Na-alginate and was uniformly distributed. The deep magnification of the sample shows the macroporous on the surface. The SEM images of ALD-IV are shown in Fig. 9 at magnifying powers of 2500× at a distance of 10 μm, 5000× at a distance of 5 μm, 100![[thin space (1/6-em)]](https://www.rsc.org/images/entities/char_2009.gif) 00× at a distance of 1 μm and 200
00× at a distance of 1 μm and 200![[thin space (1/6-em)]](https://www.rsc.org/images/entities/char_2009.gif) 00× at a distance of 1 μm.
00× at a distance of 1 μm.
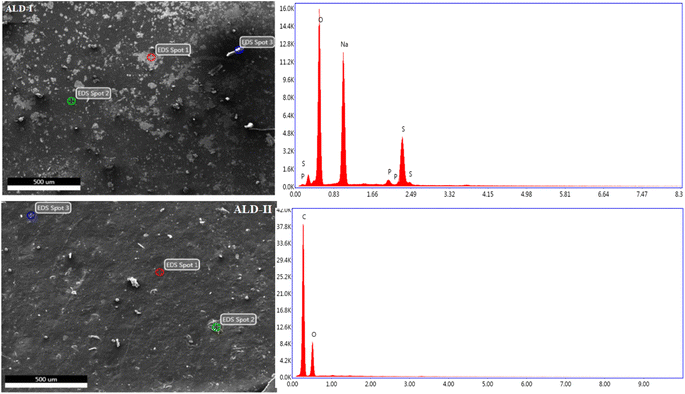
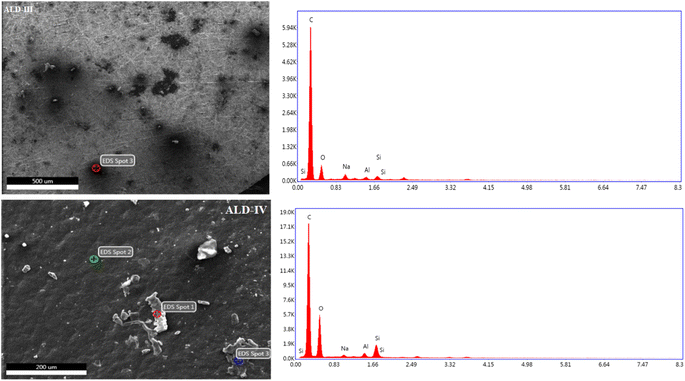
EDS is based on X-rays produced by a sample during electron bombardment. EDS microanalysis is a technique of elemental analysis that is based on the generation of characteristic X-rays in the atoms of the specimen by the incident beam electrons.32,33 To confirm the formation of the films, EDS was performed. During the EDS measurement, different areas were focused on, and the corresponding peaks were observed (Fig. 10 and 11). In the EDS spectrum, both guar gum and Na-alginate can be observed in the produced composite nanostructure. The EDS graphs of all the produced polymeric films revealed peaks for sodium, oxygen, and sulfur, which are the most prevalent components in natural polymers. In the first spot (ALD-I, Fig. 10), the percentage weights of oxygen, sodium, and sulfur were 39.7%, 39.1%, and 19.3%, respectively. In the second spot, the weights of carbon, oxygen, and sodium were 49.1%, 30.2%, and 17.7%, respectively. Similarly, in the third spot, the weights of carbon and oxygen were 62.7% and 30.2%, respectively. The EDS graphs of the ALD-II-manufactured polymeric films showed peaks for carbon and oxygen only, as shown in Fig. 10. At the first spot, the percentage weights of oxygen and carbon were 54.2%, and 45.3%, respectively. In the second spot, the weights of carbon and oxygen were 71.3% and 28.7%, respectively. Similarly, in the third spot, the weights of carbon and oxygen were 70.4% and 28.6%, respectively.
The EDS graphs of the ALD-III-manufactured polymeric film showed peaks for carbon, oxygen, and sodium only, as shown in Fig. 11. In the spot that appeared in the spectrograph, the percentage weights of carbon, oxygen, and sodium were 15.4%, 81.4%, and 1.8%, respectively. EDS graphs of the ALD-IV polymeric sample showed that peaks for oxygen, carbon, and sodium were 33.5%, 55.0%, and 5.5%, respectively, as shown in Fig. 11. At the first spot, the percentage weights of carbon and oxygen were 72.2%, and 27.3%, respectively. In the second spot, the weights of carbon and oxygen were 71.3% and 28.7%, respectively. Similarly, in the third spot, the weights of carbon and oxygen were 70.4% and 28.6%, respectively.
3.4. UV-vis analysis
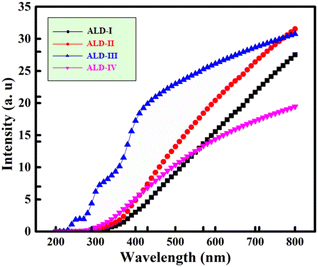
The UV spectra of the newly formed ALD films are shown in Fig. 12. This indicates that the development of a new absorption band around 270 nm in ALD-II was not present in ALD-I. The new absorption band of ALD-II starts at 300 nm. The production of carbonyl (C![[double bond, length as m-dash]](https://www.rsc.org/images/entities/char_e001.gif) O) groups following the main chain scission of alginate and hydrogen abstraction, followed by ring opening in the radiation-induced degradation process, may be ascribed to the development of a new peak. Certain active components of glycerol, guar gum, gelatin, and latex, including the C–O–C, C–H, and O–H groups, are responsible for UV absorption. The spectra of ALD-I, ALD-II, and ALD-III point out that the typical absorbance peaks are in the range of 330–800, 300–800 nm, and 270–800 nm, respectively. The spectra of ALD-I, ALD-II, and ALD-III point out 19%, 27%, and 43% absorbance, respectively, indicating that these samples are the best UV reflector. The lower UV absorption in the samples indicates that these materials are a superior choice for food packaging because they reflect more solar energy. Crucially, lower UV absorption percentages in ALD-II and ALD-III indicate their proficiency as UV reflectors, thus making them favorable choices for food packaging applications. Maintaining the freshness, quality, and safety of the packaged goods depends critically on the materials used for food packaging. These materials should reflect solar energy. These materials lessen the chance of food spoiling more quickly due to high temperatures by reducing the absorption of solar radiation, which helps to control temperature changes inside the package. Maintaining this temperature is essential to avoid enzymatic reactions, bacterial growth, and other processes that could damage the integrity of the food products. Additionally, by lessening the damaging effects of heat and light exposure, reflecting solar energy helps to preserve the sensory qualities and nutritional values of packed goods. The sustained flavour, colour, and nutritional profile of the products are guaranteed by this defence against oxidation reactions. Furthering energy efficiency is the use of solar-reflecting packaging materials, which reduce the need for refrigeration systems, thereby cutting energy use and operating expenses along the food supply chain. In addition to improving economic viability, this minimizes greenhouse gas emissions related to cooling processes, which is in line with sustainability aims. Thus, the food industry's ability of food packaging materials to reflect solar light has various implications for maintaining product quality, encouraging energy efficiency, and increasing environmental sustainability.
O) groups following the main chain scission of alginate and hydrogen abstraction, followed by ring opening in the radiation-induced degradation process, may be ascribed to the development of a new peak. Certain active components of glycerol, guar gum, gelatin, and latex, including the C–O–C, C–H, and O–H groups, are responsible for UV absorption. The spectra of ALD-I, ALD-II, and ALD-III point out that the typical absorbance peaks are in the range of 330–800, 300–800 nm, and 270–800 nm, respectively. The spectra of ALD-I, ALD-II, and ALD-III point out 19%, 27%, and 43% absorbance, respectively, indicating that these samples are the best UV reflector. The lower UV absorption in the samples indicates that these materials are a superior choice for food packaging because they reflect more solar energy. Crucially, lower UV absorption percentages in ALD-II and ALD-III indicate their proficiency as UV reflectors, thus making them favorable choices for food packaging applications. Maintaining the freshness, quality, and safety of the packaged goods depends critically on the materials used for food packaging. These materials should reflect solar energy. These materials lessen the chance of food spoiling more quickly due to high temperatures by reducing the absorption of solar radiation, which helps to control temperature changes inside the package. Maintaining this temperature is essential to avoid enzymatic reactions, bacterial growth, and other processes that could damage the integrity of the food products. Additionally, by lessening the damaging effects of heat and light exposure, reflecting solar energy helps to preserve the sensory qualities and nutritional values of packed goods. The sustained flavour, colour, and nutritional profile of the products are guaranteed by this defence against oxidation reactions. Furthering energy efficiency is the use of solar-reflecting packaging materials, which reduce the need for refrigeration systems, thereby cutting energy use and operating expenses along the food supply chain. In addition to improving economic viability, this minimizes greenhouse gas emissions related to cooling processes, which is in line with sustainability aims. Thus, the food industry's ability of food packaging materials to reflect solar light has various implications for maintaining product quality, encouraging energy efficiency, and increasing environmental sustainability.
3.5. Measurement of film thickness
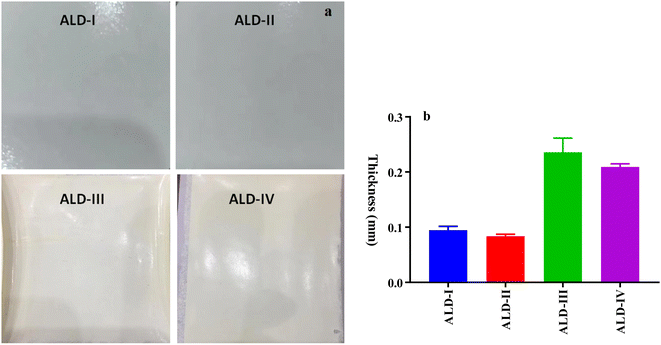
Film thickness is a critical factor in determining production costs, with thinner films being preferred due to their reduced cost, provided that they maintain the necessary mechanical properties. Several factors, such as the composition of the film, the method of preparation, and the intended application, can influence the anticipated film thickness. Film thickness is typically influenced by the concentration of polymers and additives in the film-forming solution, as well as the process parameters during film formation, including the casting method, drying conditions, and film dispersal. The anticipated film thickness (Fig. 13a) for the compositions in question (ALD-I, ALD-II, ALD-III, and ALD-IV) is based on the unique characteristics of each formulation. In general, films that contain a larger number of polymers and additives tend to be thicker.34 Nevertheless, the thickness of the film can also be influenced by other factors, such as the presence of plasticizers (such as glycerol) and the interaction between various components. When comparing the film thickness of biopolymer composites, including guar gum, sodium alginate, latex, gelatin, corn starch, glycerol, and polyvinyl alcohol, to commercially available films, various significant differences and similarities become apparent. Micrometer measurements yield accurate thickness information for these biopolymer films, allowing for a straight-forward comparison with commercial substitutes. Each biopolymer composite film exhibits unique features and performance parameters, as determined by its measured thickness.A micrometer with a precision of 0.001 mm was employed to measure the film thickness. The average thickness of the sample was determined by taking measurements at three different locations. The thicknesses of the films examined varied from 0.0830 to 0.2087 mm, with specific values of the examined films ranging in thickness from 0.0940, 0.0833, and 0.234 to 0.2087 mm for ALD-I, ALD-11, ALD-III, and ALD-IV (Fig. 13b), respectively. The films developed in this study comply with the Japanese Industrial Standard (JIS), which stipulates that plastic films for food packaging should not exceed a maximum thickness of 0.25 mm. To ascertain which film is denser, it is necessary to examine the compositions of the films. The films with higher percentages of sodium alginate (ALD-I, ALD-III, and ALD-IV) are likely to be thicker, as sodium alginate contributes to film thickness due to its hydrophilic nature and innate ability to form robust gels. The maximum sodium alginate content is found in ALD-III and ALD-IV, which may lead to thicker films than ALD-I. Furthermore, the film-forming properties of polyvinyl alcohol in ALD-III and gelatin in ALD-IV could further increase the thickness of the film. Consequently, it is anticipated that ALD-III and ALD-IV will have thicker films than ALD-I and ALD-II. ALD-III has a slight advantage in thickness due to the absence of additional components in ALD-IV, such as gelatin, which could potentially influence film thickness in a different manner.35 Biopolymer composite films possess unique thicknesses and qualities that make them well-suited for various applications, including the packaging and biomedical industries, where particular mechanical and barrier properties are necessary.
3.6. Biodegradation studies
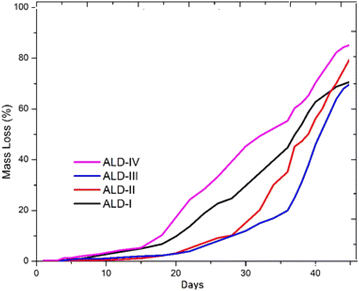
The soil breakdown test was also carried out manually, with the item being dug into the soil to determine its biocompatibility. A tiny part of the film was removed and weighed using a digital weighing scale before burying it in soil and measuring it constantly after a specific day's interval. A quantitative scheme was applied to approach the mass loss of the sheath material so that the biodegradation of the newly synthesized film could be detected. This is estimated by the counter-balance of the mass of the newly prepared film before and after the occurrence of the biodegradation process. A high degradation rate is detected with greater mass loss. Mass loss increases with greater quantity loss by plasticizers. The hydrophilic nature of the polymer increases with the high percentage composition of the plasticizer because of the presence of hydrogen bonding due to the –OH group attached to the plasticizer. There is a lower mass loss in newly synthesized polymers containing a high concentration of alginate and guar gum. This means that the biodegradability of synthesized polymers can be enhanced using lower amounts of guar gum and alginate, which, in turn, require more enzymes to degrade the complex structure of a polymer. It can be considered that melting temperature, transition temperature, and crystallinity affect polymer degradation. Fig. 14 shows the biodegradation results of the newly synthesized films. It is clear from the results that ALD-IV represents the maximum mass loss in the given time and ALD-III shows the least mass loss in the given time. This graph emphasizes that ALD-IV and ALD-I are the most biodegradable films and undergo a degradation process easily, while ALD-II and ALD-III are less degradable. Hence, in the sense of degradation, ALD-IV and ALD-II prove to be good biodegradable films.4 Conclusion
Na-alginate, guar-gum, corn starch, glycerol, latex, PVA, and gelatin were used to create new blended films. TGA and UV absorption are significantly affected by the amounts of guar-gum, NA-alginate, corn starch, and gelatin used. Morphological analysis revealed that the particles in both samples have a microporous morphology, which offers the expanded surfaces required for physiological responses and remodeling to merge with the surroundings. XRD examination confirmed the precise semi-crystalline structure of all the films. The FTIR spectrum of the cross-linked composite reveals the development of new chemical bonds between gelatin and corn starch in the ALD-II. The deterioration temperature of the samples was close to 300 °C. Because of their lower UV absorption, ALD-I, ALD-II, and ALD-III were determined to be the best, demonstrating good binding between constituents and hydrophilic nature, making them more suitable for food packaging materials with an excellent bio-degradable nature. The varying amounts of guar gum, Na-alginate, and PVA in ALD-III significantly affect tensile strength and show good inferences in the biodegradation behavior of the films. PVA is modified and upholds the properties of natural polymers. Therefore, the results for the sample with a natural plasticizer, i.e., gelatin, are negligible compared to those of the other films. Owing to their good tensile strength and tremendous degradation behavior, ALD-I, ALD-II, and ALD-III were appraised the best amongst all, demonstrating good binding between constituents and hydrophilic nature, which made them more susceptible to making packaging material, and also had great importance for its use in other biodegradable purposes. A diversity of other applications can be designed due to the novelty and properties of synthesized blended films in the near future.Informed consent statement
This study was not performed on humans.Data availability
This study did not report any data.Conflicts of interest
The authors declare no conflict of interest.Acknowledgements
The authors received no specific funding for this work.References
- J. R. Westlake, M. W. Tran, Y. Jiang, X. Zhang, A. D. Burrows and M. Xie, Sustainable Food Technol., 2023, 1, 50–72 RSC.
- L. E. Nita, A. Ghilan, A. G. Rusu, I. Neamtu and A. P. Chiriac, Pharmaceutics, 2020, 12, 449 CrossRef CAS PubMed.
- K. J. Falua, A. Pokharel, A. Babaei-Ghazvini, Y. Ai and B. Acharya, Polymers, 2022, 14, 2215 CrossRef CAS PubMed.
- X. Gao, C. Fu, M. Li, X. Qi and X. Jia, Int. J. Environ. Res. Public Health, 2022, 19, 8631 CrossRef CAS PubMed.
- G. Coppola, M. T. Gaudio, C. G. Lopresto, V. Calabro, S. Curcio and S. Chakraborty, Earth Syst. Environ., 2021, 5, 231–251 CrossRef.
- I. Kyrikou and D. Briassoulis, J. Polym. Environ., 2007, 15, 125–150 CrossRef CAS.
- A. Mohammed, A. Gaduan, P. Chaitram, A. Pooran, K.-Y. Lee and K. Ward, Food Hydrocolloids, 2023, 135, 108192 CrossRef CAS.
- S. Latif, M. Ahmed, M. Ahmed, M. Ahmad, K. M. Al-Ahmary and I. Ali, Int. J. Biol. Macromol., 2024, 266, 131262 CrossRef CAS PubMed.
- M. I. Din, T. Ghaffar, J. Najeeb, Z. Hussain, R. Khalid and H. Zahid, Food Addit. Contam.: Part A, 2020, 37, 665–680 CrossRef CAS PubMed.
- C. Zhang, A. P. Awasthi, J. Sung, P. H. Geubelle and N. R. Sottos, Int. J. Fract., 2017, 208, 131–143 CrossRef CAS.
- C. Zhang, A. P. Awasthi, P. H. Geubelle, M. E. Grady and N. R. Sottos, Appl. Surf. Sci., 2017, 397, 192–198 CrossRef CAS.
- M. Rujnić-Sokele and A. Pilipović, Waste Manage. Res., 2017, 35, 132–140 CrossRef PubMed.
- Y. Wang, W. Zhai, J. Li, H. Liu, C. Li and J. Li, Tribol. Int., 2023, 188, 108891 CrossRef CAS.
- A. K. Singh, Curr. Res. Green Sustainable Chem., 2022, 100270 CrossRef CAS.
- X. Niu, Q. Ma, S. Li, W. Wang, Y. Ma, H. Zhao, J. Sun and J. Wang, J. Food Qual., 2021, 2021, 1–11 CrossRef.
- S. K. Mary, R. R. Koshy, R. Arunima, S. Thomas and L. A. Pothen, Carbohydr. Polym. Technol. Appl., 2022, 3, 100190 CAS.
- Z. Tariq, D. N. Iqbal, M. Rizwan, M. Ahmad, M. Faheem and M. Ahmed, RSC Adv., 2023, 13, 24731–24754 RSC.
- D. N. Iqbal, Z. Tariq, B. Philips, A. Sadiqa, M. Ahmad, K. M. Al-Ahmary, I. Ali and M. Ahmed, RSC Adv., 2024, 14, 8652–8664 RSC.
- M. Imran Din, M. Ahmed, M. Ahmad, T. Ghaffar, Z. Hussain, R. Khalid and A. Samad, J. Chem., 2022, 2022, 5697099 CrossRef.
- J.-H. Kim, Y.-R. Oh, J. Hwang, J. Kang, H. Kim, Y.-A. Jang, S.-S. Lee, S. Y. Hwang, J. Park and G. T. Eom, Waste Manage., 2021, 124, 195–202 CrossRef CAS PubMed.
- A. A. Shah, F. Hasan, A. Hameed and S. Ahmed, Biotechnol. Adv., 2008, 26, 246–265 CrossRef CAS PubMed.
- W. Janik, M. Nowotarski, D. Y. Shyntum, A. Banaś, K. Krukiewicz, S. Kudła and G. Dudek, Materials, 2022, 15, 3236 CrossRef CAS PubMed.
- S. Rogovina, Polym. Sci., Ser. C, 2016, 58, 62–73 CrossRef CAS.
- K. V. Aleksanyan, Polymers, 2023, 15, 451 CrossRef CAS PubMed.
- Y. Wang, Y. Xu, W. Zhai, Z. Zhang, Y. Liu, S. Cheng and H. Zhang, Nat. Commun., 2022, 13, 5056 CrossRef CAS PubMed.
- N. E. Wahyuningtiyas and H. Suryanto, J. Mechanical Eng. Sci. Technol., 2017, 1, 24–31 Search PubMed.
- S. Roger, A. Bee, E. Balnois, A. Bourmaud, H. Le Deit and Y. Grohens, In 5th International Conference on Polymer-Solvent Complexes & Intercalates, 2003 Search PubMed.
- N. Shaari and S. Kamarudin, Polym. Test.s, 2020, 81, 106183 CrossRef CAS.
- A. Kumar, A. De and S. Mozumdar, Bull. Mater. Sci., 2015, 38, 1025–1032 CrossRef CAS.
- H. Gong, M. Liu, J. Chen, F. Han, C. Gao and B. Zhang, Carbohydr. Polym., 2012, 88, 1015–1022 CrossRef CAS.
- I. Boukhouya, H. Bakouri, I. Abdelmalek, M. Amrane and K. Guemra, Chem Int, 2018, 4, 120–129 CAS.
- A. V. Girão, in Handbook of Microplastics in the Environment, Springer, 2022, pp. 57–78 Search PubMed.
- T. Luo, Y. Guo, Z. Deng, X. Liu, Z. Sun, Y. Qi and M. Yang, J. Wuhan Univ. Technol., Mater. Sci. Ed., 2023, 38, 1304–1310 CrossRef CAS.
- M. Erben, A. A. Pérez, C. A. Osella, V. A. Alvarez and L. G. Santiago, Int. J. Biol. Macromol., 2019, 125, 999–1007 CrossRef CAS PubMed.
- N. Rahman, N. C. Dafader and P. Banu, J. Polym. Sci. Technol., 2017, 2, 20–35 Search PubMed.
| This journal is © The Royal Society of Chemistry 2024 |

