 Open Access Article
Enhanced electrical properties of BNKT–BMN lead-free ceramics by CaSnO3 doping and their bioactive properties†
Lalita Taweea,
Narongdetch Boothrawonga,
Suwanan Thammarongb,
Phanrawee Sripraphaa,
Waraporn Boontakama,
Denis Russell Sweatmanacd,
Nopakarn Chandete,
Chamnan Randornde and
Gobwute Rujijanagul *acdf
*acdf
aDepartment of Physics and Materials Science, Faculty of Science, Chiang Mai University, Chiang Mai 50200, Thailand. E-mail: rujijanagul@yahoo.com
bState Key Laboratory of Structure Analysis for Industrial Equipment, Department of Engineering Mechanics, Dalian University of Technology, Dalian 116024, China
cOffice of Research Administration, Chiang Mai University, Chiang Mai 50200, Thailand
dMaterials Science Research Center, Faculty of Science, Chiang Mai University, Chiang Mai 50200, Thailand
eDepartment of Chemistry, Faculty of Science, Chiang Mai University, Chiang Mai 50200, Thailand
fMultidisciplinary and Interdisciplinary School, Chiang Mai University, Chiang Mai 50200, Thailand
First published on 22nd July 2024
Abstract
There is an increasing interest in using piezoelectric materials, including lead-free piezoceramics for medical applications. As a result, more attention has been placed on investigating the biological properties of these materials. In this research experiment, electrical, mechanical, and biological properties of lead-free 0.99Bi0.5(Na0.8K0.2)0.5TiO3–0.01Bi(Mg2/3Nb1/3)O3 or 0.99BNKT–0.01BMN doped with CaSnO3 (CSO) were investigated. The samples were synthesized by a modified solid-state reaction technique. X-ray diffraction (XRD) analysis showed that the samples presented a single perovskite phase. After adding CSO, electrical properties such as energy storage density (maximum Wrec = 781 mJ cm−3) and electro-strain properties (maximum Smax = 0.3%) were improved at room temperature. Mechanical properties were also enhanced for the modified samples with maximum values for Vickers hardness (HV) and elastic modulus (Em) of 6.11 GPa and 135 GPa, respectively. Biological assays for cytotoxicity, indicated that the samples had high cell viability, while the simulated body fluid (SBF) test revealed a moderate apatite forming ability. The samples were then coated with hydroxyapatite to improve their apatite-forming ability. The SBF testing for the coated samples showed that the coated samples had high apatite-forming ability. The obtained results pointed to the possibility of ceramics being used for multifunction electrical devices at room temperature and biomaterial applications.
1 Introduction
Recently, many reports have concentrated on the development of lead-free piezoelectric materials due to the environmental concern about serious lead pollution caused by the high toxicity of lead oxide and its high volatility during processing. Many lead-free ceramics systems such as BaTiO3 (BT), Bi0.5Na0.5TiO3 (BNT), (Bi0.5K0.5)TiO3 (BKT), and K0.5Na0.5NbO3 (KNN) based materials, have been widely investigated due to their good electrical properties.1,2 Among these lead-free systems, the solid solution between BNT and BKT (BNKT) is of interest since it presents large spontaneous polarization, high permittivity, low dielectric loss, and a wide working temperature range.3 Normally, the BNKT solid solutions exhibited higher dielectric and piezoelectric properties near the morphotropic phase boundary (MPB) of the rhombohedral and tetragonal phases, at compositions ranging from x = 0.16 to 0.20 (for [Bi0.5(Na1−xKx)0.5]TiO3).4 Furthermore, the BNKT ceramics have a lower coercive field (Ec) as compared with the pure BNT which favors a poling process.2,5 The BNKT-based materials thus have a potential for many electronic device applications.1,2,6To achieve the high performance of BNK-based ceramics, many modified BNKT-based materials or their complex solid solutions have been synthesized and scrutinized. For example, the BNKT solid solution can be modified by modifier substances such as Sr(Hf0.5Zr0.5)O3 (improved the electro-strain),7 Bi(Mg0.5Ti0.5)O3 (enhanced normalized strain),8 Bi(Zn0.5Ti0.5)O3 (bettered both electro-strain and normalized strain),9 Ba(Zr0.04Ti0.96)O3 (enhanced piezoelectric properties),10 BiAlO3 (improved electro-strain),11 (Bi0.5La0.5)AlO3 (enhanced the electro-strain),12 BiFeO3 (bettered piezoelectric properties),13,14 Ag2O (improved dielectric and piezoelectric properties),15 SrTiO3 (improved the electro-strain),16 K0.5Na0.5NbO3 (bettered electro-strain and normalized strain),17 and Bi(Mg2/3Nb1/3)O3 (BMN) (exhibited good piezoelectric and electromechanical properties).3
However, it should be noted that BMN can be used as a modifier for several Bi-based piezoelectric ceramic systems such as BNKT–BMT (improved electro-strain),18 BT–BMN (exhibited good dielectric/temperature/frequency dependent stability and good energy storage density),19 BNT–BMN (presented good energy storage properties),20 Bi1.05FeO3–BT–BMN (showed large strain with low hysteresis strain),21 and Ba0.55Sr0.45TiO3–BMN (improved breakdown strength and energy storage behavior).22
Lately, CaSnO3 (CSO) has attracted a growing interest because of its various applications in objects, such as gas sensors,23 capacitor components,24 anode materials for lithium-ion batteries,25 and catalysts.26–28 Moreover, CSO has been used as a modifier for some lead-free piezoelectric ceramics such as BT–CSO (improved dielectric and piezoelectric behaviours),29 NaNbO3–CSO (improved antiferroelectric behaviour),30 and BiFeO3–CSO (enhanced ferroelectric and piezoelectric properties).31 Since BNKT ceramics present many good properties and BMN as well as CSO modifiers, have positive effects on many properties of lead-free piezoelectric materials, it is interesting to synthesize the BNKT-based ceramics modified with BMN and CSO.
As of lately, there has been a higher appeal in the investigation of using piezoelectric materials in medical applications.32,33 Some lead-free piezoceramics have been proposed to combine with some bio-ceramics to search for a potential biocompatible material and their applications.34,35 Therefore, the property investigation of the biological properties of lead-free piezoceramics is essential, especially for medical purposes. In the present work, BNKT–BMN ceramics modified with CSO were synthesized and their mechanical and electrical properties were investigated. Furthermore, bio-properties of the researched ceramics were also explored to determine their potential for use in biomedical applications.
2 Experimental
A solid solution (1 − x)[0.99BNKT–0.01BMN]−xCSO ceramics (with x = 0.00, 0.02 and 0.04) were fabricated via a modified conventional solid-state reaction method, using high-purity raw materials of Bi2O3, Na2CO3, K2CO3, TiO2, MgO, Nb2O5, CaCO3 and SnO2. The BNKT, BMN, and CSO were calcined separately by stoichiometrically weighing the metal oxides for their composition and then mixed by a ball-milled technique for 24 h in an ethanol solution. The obtained products were dried at 120 °C in an oven overnight. The dried (and mixed) raw powders for BNKT, BMN, and CSO were separately calcined at 900 °C, 700 °C and 1200 °C for 2 h, respectively. After that, the BNKT, BMN and CaSnO3 calcined powders were then weighed, mixed, and dried again to produce the mixed powders of (1 − x)[0.99BNKT–0.01BMN]–xCSO (x = 0.00, 0.02 and 0.04). The calcined powders were crushed and sieved to which polyvinyl alcohol (PVA) binder was afterward added. Next, the powders were uniaxially pressed into discs 10 mm in diameter. The binder removal process was carried out by heating the green pellets to 500 °C for 1 h and then sintering them at 1125 °C for 2 h dwell time with a heating/cooling rate of 5 °C min−1 in closed alumina crucibles. To minimize the loss of the volatile elements, the green pellets were embedded in the powder of the same composition. The bulk density and apparent porosity of sintered pellets were measured using the Archimedes' method.The crystal structure and phase formation of powders and ceramics were investigated by X-ray diffraction technique (XRD, PANalytical, X'Pert Pro MPD). A Raman scattering technique (T6400 JY, Horiba Jobin Yvon) was utilized to confirm the XRD result. A scanning electron microscope (FE-SEM, JEOL JSM-6335F) was used to determine the microstructure of the samples. The grain size of the ceramics was measured by using the linear intercept method. For electrical property measurements, the silver paste was applied on both sides of sintered pellets and then fired at 600 °C for 20 min. Dielectric constant and dielectric loss were measured in the temperature range 30–500 °C at different frequencies from 1 kHz to 1 MHz using a 4192A LCR meter connected to a high temperature furnace. The ferroelectric properties were carried out using a ferroelectric tester (Radiant Technologies, Inc. with Precision 10 kV HVI-SC). Remnant polarization (Pr), maximum polarization (Pmax), and coercive field (Ec) values were determined from the hysteresis loops. The mechanical properties, including hardness, elasticity modulus (Em), and fracture toughness (KIC) of the material were measured using a hardness tester (SMV-1000).
To check the cell viability, the ceramics powder was tested by a MTT assay by using a model of the primary dermal fibroblast PCS-201-012 cell line (Manose Health and Beauty Research Center). Dulbecco's Modified Eagle Medium (DMEM) with 10% fetal bovine serum (FBS) and 1% penicillin/streptomycin was used to culture the suspended PCS-201-012 cell line in a 96-well plate (5000 cells per well). All cells well plates were retained at 37 ± 0.1 °C in a CO2 incubator with 5% CO2, and 100% relative humidity. The cultures and mediums were switched every week and twice a week, respectively. The cells were treated with fine sterilized ceramics powder with 190 ml of 0.1, 1, 10, 100, and 1000 μg ml−1 of concentrations for 24 h. The positive control was served by sodium lauryl sulfate (SLS). The optical density (OD) of the MTT assay was calculated by a microplate reader at the wavelength of 510 nm, and the average of three readings was counted. The bioactivity of a sample was determined utilizing a simulated body fluid (SBF) test. The samples were ultrasonically cleaned in ethyl alcohol for 30 minutes before drying overnight. The samples were immersed in a pH 7.4 SBF solution and kept in a temperature-controlled chamber (37 ± 0.5 °C). The apatite layers that developed on the material were investigated using an SEM.
3 Results and discussion
3.1 Phase formation
The X-ray diffraction patterns of the (1 − x)[0.99BNKT–0.01BMN]–xCSO are shown in Fig. 1(a). All ceramics exhibited a single phase of perovskite structure without secondary phase, within the resolution limit of the XRD technique. This suggests the formation of the solid solution occurred after the processing. The tolerance factor (t) of the ceramics system was calculated, as presented in Fig. S1 (in the ESI†) and the obtained values were in the range 0.9742–0.9762. Normally, the perovskite structure is stable within the range of 0.880 < t < 1.090.36 Therefore, the t-values for the studied samples lie well within the t-value limit, indicating the materials belong to a stable perovskite structure.37 It should be noted that the positions of all peaks tend to shift toward lower 2θ angles when compared to the x = 0.00 samples. For example, the (110) peak exhibited a shift to a lower angle when the CSO content was increased. This corresponds with the change in the t value associated with the CSO content. Therefore, the lattice distortion in the modified samples occurred, which may be due to the diffusion of Ca2+ and Sn4+ ions into the lattices of the base ceramics. Similar evidence for peak shifting behaviour was also observed in a previous work.38 For the x = 0.0 samples, there was a peak splitting at 2θ ∼ 40° ((111)/(1![[1 with combining macron]](https://www.rsc.org/images/entities/char_0031_0304.gif) 1) peaks) and broad ambiguity at 46° ((002)/(200) peaks), which indicated a mixture phase of rhombohedral and tetragonal phases. It should be noted that, a slight splitting of (002)/(200) tetragonal peaks was observed with increasing CSO content.39–43 Furthermore, the peak splitting of (111)/(1
1) peaks) and broad ambiguity at 46° ((002)/(200) peaks), which indicated a mixture phase of rhombohedral and tetragonal phases. It should be noted that, a slight splitting of (002)/(200) tetragonal peaks was observed with increasing CSO content.39–43 Furthermore, the peak splitting of (111)/(1![[1 with combining macron]](https://www.rsc.org/images/entities/char_0031_0304.gif) 1) peaks slightly merged into a single peak (Fig. 1(b) and (c)). This behaviour matches the trend of calculated tetragonality (c/a) of the samples slightly increasing with increasing CSO content, which indicated more tetragonality (Fig. S1(a) in the ESI†) with increasing CSO content. This result agrees with the previous studies for the phase transformation.44
1) peaks slightly merged into a single peak (Fig. 1(b) and (c)). This behaviour matches the trend of calculated tetragonality (c/a) of the samples slightly increasing with increasing CSO content, which indicated more tetragonality (Fig. S1(a) in the ESI†) with increasing CSO content. This result agrees with the previous studies for the phase transformation.44
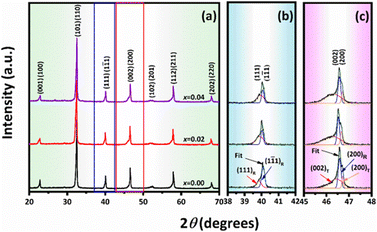 | ||
| Fig. 1 X-ray diffraction patterns of (1 − x)[0.99BNKT–0.01BMN]–xCSO ceramics: (a) 2θ = 20°–70°, (b) 2θ = 38°–42°, and (c) 2θ = 45°–48°. | ||
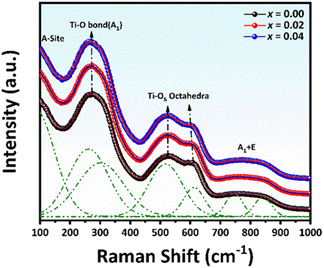
The Raman spectra of (1 − x)[0.99BNKT–0.01BMN]–xCSO ceramics measured at room temperature (RT) over the range of 100–1000 cm−1 are shown in Fig. 2. There are four main regions of Raman spectra identified by: (1) a vibration mode at ∼120 cm−1, (2) ∼270 cm−1, (3) ∼450–650 cm−1, and (4) peak at >700 cm−1, respectively. Based on the reports from previous studies, the first mode observed between 100 and 150 cm−1 is related to the vibration of A-site cations in the perovskite structure, influenced by A-site doping.45,46 The peak around 270 cm−1 is associated with Ti–O vibrations at the B-site.46 The peak at 450–620 cm−1 can be related to the vibration of TiO6 octahedra mode.47,48 It has been suggested from previous experiments for the work done on BNKT-based ceramics that the splitting peak in the vibration mode of Ti–O and TiO6 octahedra mode indicates a coexistence of rhombohedral (R3c) and tetragonal (P4bm) phases.48,49 In this work, there was a shoulder for the peak around 270 cm−1 and a splitting peak TiO6 octahedra mode, which indicated the coexistence of the two phases. Finally, the broad peak observed in the fourth region was assigned to be the A1 (longitudinal optical) and E (longitudinal optical) overlapping bands.48 However, the presence of these broader peaks was related to the presence of oxygen vacancy.50 Thus, the obtained Raman data in the current study is consistent with the XRD result, which confirms the coexistence of the phases for all compositions.
3.2 Structural analysis
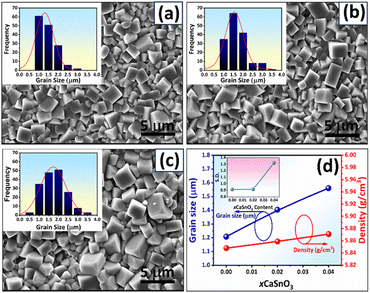
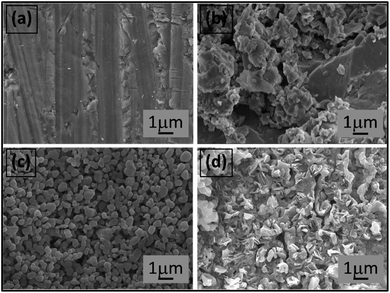
Figs. 3(a)–(d) shows the SEM images of the surface samples. The SEM image illustrates that all ceramics were densely sintered and contained closely compacted grains with low surface porosity. This corresponds with the density value (5.85–5.87 g cm−3), where the density slightly increased with CSO content (Fig. 3(d)). Furthermore, all samples exhibited equiaxed grain shape and uniform grain morphology with well-defined grain boundaries. For the x = 0.00–0.02 samples, a cubic-like shape with a sharp edge was observed, while the x = 0.04 samples presented a rounder edge grain. The CSO additive produced a slight increase in the average grain size, i.e., the average grain size increased from 1.21 μm for the x = 0.00 samples to 1.56 μm for the x = 0.04 samples (Fig. 3(d)). To check the degree of uniformity of the grain size, grain size distributions of the samples were plotted and a standard deviation (S.D., μm) of the grain size was determined as presented in the insets of Fig. 3(a)–(d). All grain size distributions presented a monomodal normal distribution, and the S.D. value slightly increased with CSO content (inset of Fig. 3(d)). This confirms that all samples had a uniform grain size, which revealed a good sintering processing.3.3 Dielectric properties
The temperature dependence of dielectric constant (εr) and dielectric loss (tan![[thin space (1/6-em)]](https://www.rsc.org/images/entities/char_2009.gif) δ) measured at different frequencies of poled samples are shown in Fig. 4(a)–(c). The corresponding dielectric properties are also given in Table S1 (in the ESI†). Two dielectric anomaly peaks were observed for the dielectric curves. The first anomaly peak (near 100 °C) indicates the presence of a relaxor ferroelectric characteristic, which is typically caused by thermal evolutions of discrete polar nanoregions.51 The second, denoted as Tm and developing at approximately 300 °C, is associated with the maximum dielectric constant (εr,max). As suggested by many previous studies, the temperature at the peak of tan
δ) measured at different frequencies of poled samples are shown in Fig. 4(a)–(c). The corresponding dielectric properties are also given in Table S1 (in the ESI†). Two dielectric anomaly peaks were observed for the dielectric curves. The first anomaly peak (near 100 °C) indicates the presence of a relaxor ferroelectric characteristic, which is typically caused by thermal evolutions of discrete polar nanoregions.51 The second, denoted as Tm and developing at approximately 300 °C, is associated with the maximum dielectric constant (εr,max). As suggested by many previous studies, the temperature at the peak of tan![[thin space (1/6-em)]](https://www.rsc.org/images/entities/char_2009.gif) δ–T curve of the poled sample at a temperature less than 100 °C can be defined as the ferroelectric to relaxor phase transition temperature (TF–R).52,53 For BNKT-based ceramics, the TF–R has been proposed to be related to an evolution of the initially coexisting R3c and P4bm PNRs, and Tm has a relevance to the P4bm PNRs that entirely transform from the R3c PNRs with increasing the temperature.54,55 In this work, the TF–R could not be observed, because there was no clear sharp peak in the tan
δ–T curve of the poled sample at a temperature less than 100 °C can be defined as the ferroelectric to relaxor phase transition temperature (TF–R).52,53 For BNKT-based ceramics, the TF–R has been proposed to be related to an evolution of the initially coexisting R3c and P4bm PNRs, and Tm has a relevance to the P4bm PNRs that entirely transform from the R3c PNRs with increasing the temperature.54,55 In this work, the TF–R could not be observed, because there was no clear sharp peak in the tan![[thin space (1/6-em)]](https://www.rsc.org/images/entities/char_2009.gif) δ–T curve. However, the broad or hump curve at the temperature around TF–R of tan
δ–T curve. However, the broad or hump curve at the temperature around TF–R of tan![[thin space (1/6-em)]](https://www.rsc.org/images/entities/char_2009.gif) δ–T curve tended to shift to a lower temperature with increasing CSO content.
δ–T curve tended to shift to a lower temperature with increasing CSO content.
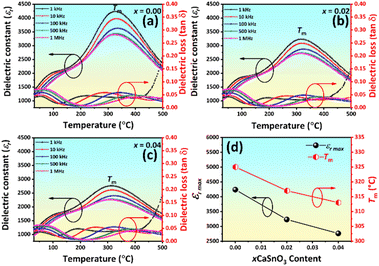 | ||
Fig. 4 (a)–(c) Temperature dependence of dielectric constant (εr) and dielectric loss (tan![[thin space (1/6-em)]](https://www.rsc.org/images/entities/char_2009.gif) δ) of the ceramics as a function of CSO content and (d) plots of εr,max and Tm as a function of CSO content. δ) of the ceramics as a function of CSO content and (d) plots of εr,max and Tm as a function of CSO content. | ||
The Burns temperature (TB), which denotes the temperature from which the dielectric constant starts to deviate from the Curie–Weiss law, was also evaluated and the result is presented in Fig. S2 (in the ESI†). The trend of TB value was similar to the trend of Tm, i.e., it decreased with CSO content. Yet, the ΔT (=TB − Tm) value (Table S1 in the ESI†) increased with the increasing CSO content, indicating the diffused phase transition behaviour was also enhanced.56 In addition, the dielectric peak at Tm became broader, and the dielectric constant value shifted down. This was evident with the decrease in the degree of frequency dispersion of the dielectric constant, and the intensity of frequency dispersion Δεr (=εr,1 kHz − εr,1 MHz) decreased with increasing CSO content (Table S1†).51,57 These results can affect electrical properties such as ferroelectric and piezoelectric properties (next sections). The observed decrease in transition temperatures as the CSO concentration increased revealed that these transition temperatures can be controlled by the CSO content. It should be noted that, the tan![[thin space (1/6-em)]](https://www.rsc.org/images/entities/char_2009.gif) δ value slightly changed with CSO, where its values at RT and Tm were 0.0336–0.0415 and 0.0303–0.0398, respectively. This is beneficial for the development of the ceramics for capacitor applications (Table S1 in the ESI†). Thus, the dielectric properties of the studied system were controlled by the change in their composition.
δ value slightly changed with CSO, where its values at RT and Tm were 0.0336–0.0415 and 0.0303–0.0398, respectively. This is beneficial for the development of the ceramics for capacitor applications (Table S1 in the ESI†). Thus, the dielectric properties of the studied system were controlled by the change in their composition.
3.4 Ferroelectric properties
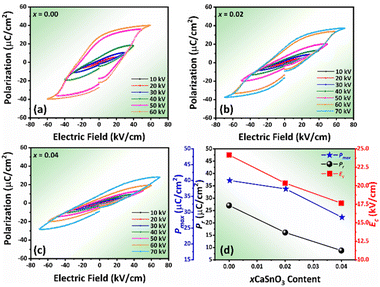
Fig. 5 displays the P–E hysteresis loops of the samples at different CSO contents and applied electric fields. Plots of Pmax, Pr, and Ec as a function of CSO content are also presented in Fig. 5(d). The corresponding ferroelectric properties are listed in Table S2 (in the ESI†). For the x = 0.00 ceramics, the shape of the P–E loop indicated a ferroelectric order behaviour. However, the shape of the P–E loop transformed into a constriction loop that became slimmer with increasing CSO content. The Pmax, Pr and Ec values also tended to decrease with CSO content. This indicates that the long-range ferroelectric order in the unmodified ceramics was disturbed by the CSO and transformed to be into the ergodic relaxor (ER) phase, where the ER phase can transform into a ferroelectric (FE) phase by an external electric field.48 In the current experiment, the energy storage density (Wrec) and energy storage efficiency (η), were calculated from the P–E loop data by using the following equations:38
 | (1) |
 | (2) |
 | (3) |
In addition, this improvement can be related to the formation of the constrictive P–E loop for this composition, which indicated the formation of the mixed FE and ER phases.48 It should be remarked that the Wrec value for the 0.02 samples at RT is higher than many BNKT based piezoelectric ceramics (at RT, Table 1). To compare the ability of the Wrec value under a low working electric field at RT, a normalized energy density (Wrec/E = energy storage density/applied electric field) was determined. A comparison of Wrec/E value of the current work with other previous works for lead-free ceramics is presented in Table 1.59–68 The Wrec/E value for the 0.02 samples is considered high when compared with many previous studies.
| Materials | W (mJ cm−3) | E (kV mm−1) | W/E (μC mm−2) | η (%) | Ref. |
|---|---|---|---|---|---|
| (1 − x)[0.99BNKT–0.01BMN]–xCaSnO3, x = 0.02 | 781 | 6 | 0.13 | 43.00 | This work |
| Bi0.5(Na0.82K0.18)0.5Ti1−x(Mg1/3Nb2/3)xO3, x = 0.02–0.045 | 650 | 7 | 0.09 | 34.15 | 59 |
| (1 − x)Bi0.50(Na0.80K0.20)0.50TiO3–xBa0.90Ca0.10Ti0.90Zr0.10O3 | 370 | 4 | 0.09 | 50.00 | 60 |
| Bi0.5(Na0.8K0.2)0.5(Ti0.96Sn0.04)O3 | 400 | 5 | 0.08 | 41.70 | 61 |
| Bi0.5(Na0.80K0.20)0.5TiO3–SrZrO3–Eu3+ | 750 | 15 | 0.05 | 80.00 | 62 |
| (1 − x)(0.75Bi0.5Na0.5TiO3–0.25Bi0.5K0.5TiO3)–xBiAlO3, x = 0.06 | 710 | 7 | 0.10 | 71.30 | 63 |
| (1 − x)[Bi0.5(Na0.80K0.20)0.5TiO3–0.03(Ba0.70Sr0.03)TiO3]–xBa(Fe0.5Ta0.5)O3, x = 0.03 | 490 | 5 | 0.10 | 60.70 | 64 |
| (1 − x)[Bi0.5(Na0.8K0.2)0.5TiO3]–x[Ba0.844Ca0.156(Zr0.096Ti0.904)O3], x = 0.075 | 430 | 5 | 0.09 | 50.70 | 65 |
| (1 − x)[Bi0.5(Na0.4K0.1)TiO3]–xBaTiO3, x = 0.04 | 300 | 4.5 | 0.07 | 24.6 | 66 |
| Bi0.485(Na0.388K0.097)Ba0.021Sr0.009TiO3, sintered at 1125 oC | 270 | 4 | 0.07 | 28.10 | 67 |
| (1 − x)[Bi0.5(Na0.4K0.1)TiO3]–xBi4Ti3O12, x = 0.15 | 120 | 4.63 | 0.03 | 0.17 | 68 |
The influence of the applied electric field on the Wrec and η values at RT is depicted in Fig. 6(a) and (b), respectively. The Wrec value tended to increase with the electric field, especially for the modified sample due to ΔP increasing with the electric field (Fig. S3 in the ESI†). This also consists with the work done by Dai et al. for BaSrTiO3–Bi(Zn1/2T1/2)O3 ceramic system.69 However, the η value decreased with the electric field because Wloss increased with applied electric field at a higher rate when compared to the Wrec value (see Fig. S2 in the ESI†). The P–E hysteresis loop at different temperatures of the samples was plotted and results are shown in Fig. S4 (in the ESI†). Plots of Wrec and η values as a function of temperature are shown in Fig. 6(c) and (d), respectively. The related values are also listed in Table S2 (see the ESI†). The trend of constrictive loop formation for each composition at high temperatures, confirmed the trend of TF–R value that shifted down with increasing CSO content, i.e., hump curve of tan![[thin space (1/6-em)]](https://www.rsc.org/images/entities/char_2009.gif) δ–T curve shifted down with CSO. In addition, the W and η values, as calculated from the P–E loop, increased with increasing temperature, and reached the maximum value of 1071 mJ cm−3 and 59.60%, respectively for the x = 0.02 composition at 150 °C.
δ–T curve shifted down with CSO. In addition, the W and η values, as calculated from the P–E loop, increased with increasing temperature, and reached the maximum value of 1071 mJ cm−3 and 59.60%, respectively for the x = 0.02 composition at 150 °C.
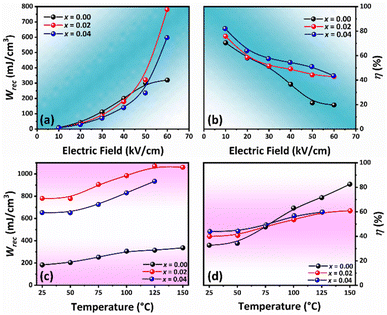 | ||
| Fig. 6 Energy storage properties of the samples: (a) Wrec vs. electric field, (b) η vs. applied electric field, (c) Wrec vs. temperature, and (d) η vs. temperature. | ||
3.5 Electro-strain behaviour
Fig. 7 presents the electro-strain properties of the samples. The maximum strain values (Smax) and the negative strain (Sneg), where Sneg is the difference between zero-field strain and the lowest strain, are displayed in Fig. 7(e), and the normalized strain coefficient 70 are depicted Fig. 7(f). The related data are also presented in Table S3 (in the ESI†). With increasing CSO content, the Sneg value approached zero and the Smax reached its maximum value (0.3%) for the x = 0.02 samples. The
  value increased with CSO content and reached the maximum value for the x = 0.02 sample, then decreased for the x = 0.04 samples (Fig. 7(f)). In the present experiment, the significant enhancement in Smax can be described by the fact that the addition of CSO decreases the FE ordering and finally transformed into an ER state at an optimum between FE (non-ergodic relaxor) and ER portion. However, upon the application of an electric field, the ER at zero field can easily be transformed into a long-range FE phase, and thus a large strain response can be achieved at around the critical phase composition.71–73 This result is consistent with the transformation of the P–E hysteresis-shaped loop from a normal ferroelectric loop for the x = 0.00 samples to a constriction loop for the x = 0.02 samples. However, the decrease of Smax for the x = 0.04 samples may be due to the higher degree of ergodicity for this composition.72
The low field d33 value as a function of CSO content is also shown in Fig. 7(f). The d33 value tended to decrease with CSO, as expected, due to the additive deteriorating the ferroelectric ordering and increasing the degree of ergodicity, which aligns with previous work.74 This evidence can be roughly described by the thermodynamic theory of ferroelectrics, which follows the equation: d33 = 2ε33ε0Q11Pr, where ε33 is the dielectric constant, and Q11 is an electrostrictive coefficient (which is constant for perovskite materials).5
3.6 Mechanical properties
Normally, the practical uses of actuators or other applications such as biomedical applications are significantly influenced by their mechanical performance. In the current study, the mechanical properties of the samples, including Vickers (HV) and Knoop (HK) hardnesses, elastic modulus (Em), and fracture toughness (KIC) were determined. Plots of HV and HK values as a function of CSO content are shown in Fig. 8(a) and their corresponding values are listed in Table S4 (in the ESI†). In the current work, the HV and HK values were calculated via eqn (4) and (5).
 | (4) |
 | (5) |
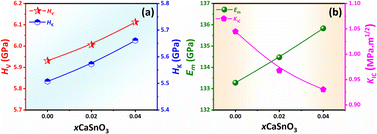 | ||
| Fig. 8 Plots of (a) HV and HK as a function of x content and (b) Em and KIC values as a function of CSO content. | ||
Plots of Em and KIC values as a function of CSO content are shown in Fig. 8(b). The Em and KIC values were also calculated using the following formulas (6) and (7):77,78
 | (6) |
 | (7) |
3.7 Biological properties
Recently, there has been an increasing interest in using piezoelectric materials, including lead free piezo ceramics for medical applications.34,58 Thus, the details of bio-properties of piezoelectric materials have become more important. In this work, some bio-properties of the studied materials were investigated to search for potential uses in medical applications.
 | (8) |
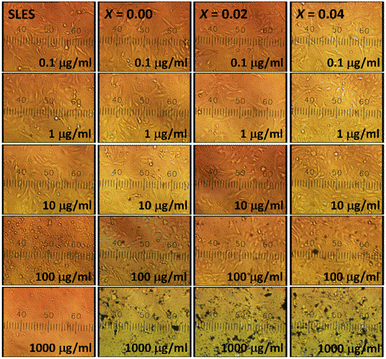
Comparative histogram plots between cell viability and concentration of positive control and treated-ceramics groups are shown in Fig. 10. The percentage cell viability for all samples was higher than 90% of all concentrations despite increasing of the x value.79,80 Thus, there were non-cytotoxic effects to cells compared with percentages shown by cells cultured in the SLS (positive control). These small differences of cell viability of all samples were not statistically significant. This indicates that ceramics were non-cytotoxic and beneficial for cell proliferation at an appropriate dosage. Comparing the obtained results with the standard sample result, the studied samples demonstrate high compatibility with skin fibroblast cells. This may be due to the composition of the samples, which contained elements and/or components that were less or nontoxic to the cells. The result is also favourable when compared with previous studies.81,82 This suggests that the samples have potential roles in uses for biomedical applications.
To increase the ability of apatite formation, the x = 0.02 samples were coated with hydroxyapatite (HAp) by a dip-coating technique, where it is well known that the HAp is a bioactive material which has piezoelectric and pyroelectric properties34 (see additional experimental procedures for the films dip coating in Fig. S5 in the ESI†).
The surface of a sample coated with HAp is illustrated in Fig. 11(c). The coated surface showed uniform microstructure and a round grain shape with an average grain size of 0.6 μm. After the coating process, the samples were immersed in SBF for 15 days. Fig. 11(d) presents the apatite formation after the coated samples were immersed in the SBF. A clear continuous cluster of apatite-like layers was found, as seen in the SEM image in Fig. 11(d). The formation of apatite should be due to negative charge such as PO43− anions from the sample surface attracting Ca2+ cations from the surrounding SBF, and subsequently attracting PO43− to form nucleation sites for apatite development, resulting in the production of apatite layers.83,84 The presence of a clear appetite layer for the coated samples suggests the coated samples are a bioactive material.
4 Conclusions
The lead-free ceramics of (1 − x)[0.99BNKT–0.01BMN]–xCSO (x = 0.00–0.04) were synthesized via a modified solid state reaction technique. The effects of CSO on the electrical, mechanical, and bio-properties were investigated. The following is a summary of this work.(1) All samples exhibited a single perovskite phase, with both density and grain size being increased by the CSO additive.
(2) The addition of CSO notably enhanced the electrical properties, where the x = 0.02 samples exhibited the highest energy storage density and electro-strain values at RT.
(3) The mechanical properties, including HV, HK, and Em, were improved by the CSO additive.
(4) The x = 0.02 samples were selected for bio-property tests. The cytotoxicity test indicated that the samples had high cell viability, while the SBF test revealed a moderate apatite forming ability. The SBF test for the samples that were coated with HAp demonstrated an effective apatite-forming ability.
The obtained results suggested that the studied ceramics have potential uses in multifunction electrical devices at RT. In addition, the samples have the potential for further development in biomedical applications in the future.
Data availability
The data supporting this article have been included as part of the ESI.†Author contributions
Lalita Tawee: methodology-sample preparation and original draft preparation. Narongdetch Boothrawong: help the preparation. Suwanan Thammarong: help the preparation. Phanrawee Sriprapha: help the bio-methodology preparation part. Waraporn Boontakam: help the bio-methodology preparation part. Denis Russell Sweatman: electrical measurement, Nopakarn Chandete: improve the manuscript. Chamnan Randorn: improve the manuscript. Gobwute Rujijanagul: conceptualization writing-original draft preparation improve the manuscript, supervision and coresponding authors.Conflicts of interest
There are no conflicts to declare.Acknowledgements
This research work was supported by Materials Science Research, Department of Physics and Materials Science Faculty of Science, Office of Research Administration, Chiang Mai University and partially supported by Chiang Mai University. Multidisciplinary and Interdisciplinary School, Chiang Mai University is also acknowledged.References
- T. Zheng, J. Wu, D. Xiao and J. Zhu, Prog. Mater. Sci., 2018, 98, 552–624 CrossRef CAS.
- J. Hao, W. Li, J. Zhai and H. Chen, Mater. Sci. Eng., R, 2019, 135, 1–57 CrossRef.
- Z. Peng, J. Wang, M. Niu, X. Nie, S. Xu, F. Zhang, J. Wang, D. Wu, Z. Yang and X. Chao, J. Mater. Sci.: Mater. Electron., 2022, 33, 3053–3064 CrossRef CAS.
- A. Sasaki, T. Chiba, Y. Mamiya and E. Otsuki, Jpn. J. Appl. Phys., 1999, 38, 5564–5567 CrossRef CAS.
- S. Manotham, P. Butnoi, P. Jaita, D. Tantraviwat, N. Boothrawong and G. Rujijanagul, Mater. Res. Bull., 2020, 128, 110859 CrossRef CAS.
- Y. K. Lv, S. F. Duan, Z. H. Zhao, X. Y. Kang, R. F. Ge, H. Wang and Y. Dai, J. Mater. Sci., 2018, 53, 8059–8066 CrossRef CAS.
- S. K. Gupta, R. McQuade, B. Gibbons, P. Mardilovich and D. P. Cann, J. Appl. Phys., 2020, 127, 074104 CrossRef.
- A. Khaliq, M. Sheeraz, A. Ullah, J. S. Lee, C. W. Ahn and I. W. Kim, Sens. Actuators, A, 2017, 258, 174–181 CrossRef CAS.
- N. U. Basar, M. I. Khan, A. Ullah, N. Ullah, I. I. I. W. Kim, N. U. Rehman and J. Khan, Mater. Res. Express, 2019, 6, 095804 CrossRef CAS.
- Z. W. Chen and J. Q. Hu, Adv. Appl. Ceram., 2013, 107, 222–226 CrossRef.
- A. Ullah, C. W. Ahn, A. Hussain, I. W. Kim, H. I. Hwang and N. K. Cho, Solid State Commun., 2010, 150, 1145–1149 CrossRef CAS.
- A. Ullah, C. W. Ahn, S. Y. Lee, J. S. Kim and I. W. Kim, Ceram. Int., 2012, 38, S363–S368 CrossRef CAS.
- M. Zou, H. Fan, L. Chen and W. Yang, J. Alloys Compd., 2010, 495, 280–283 CrossRef CAS.
- K. T. Lee, J. S. Park, J. H. Cho, Y. H. Jeong, J. H. Paik and J. S. Yun, Ceram. Int., 2015, 41, 10298–10303 CrossRef CAS.
- X. Chen and Y. Liao, Materials, 2023, 16, 5342 CrossRef CAS.
- K. Wang, A. Hussain, W. Jo, J. Rödel and D. D. Viehland, J. Am. Ceram. Soc., 2012, 95, 2241–2247 CrossRef CAS.
- A. Hussain, C. W. Ahn, A. Ullah, J. S. Lee and I. W. Kim, Ceram. Int., 2012, 38, 4143–4149 CrossRef CAS.
- G. Dong, H. Fan, Y. Jia, H. Liu, W. Wang and Q. Li, Ceram. Int., 2020, 46, 21211–21215 CrossRef CAS.
- G. Liu, Y. Li, M. Shi, L. Yu, P. Chen, K. Yu, Y. Yan, L. Jin, D. Wang and J. Gao, Ceram. Int., 2019, 45, 19189–19196 CrossRef CAS.
- Z. Li, Z. Wang, Q. Yang, D. Zhang, M. Fang, Z. Li, B. Gao, J. Zhang, N. Lei, L. Zheng, Z. Wang, X. Yan, D. Wang, C. Long and Y. Niu, Ceram. Int., 2023, 49, 9615–9621 CrossRef CAS.
- T. Zheng, C. Zhao, J. Wu, K. Wang and J. F. Li, Scr. Mater., 2018, 155, 11–15 CrossRef CAS.
- W. Huang, Y. Chen, X. Li, G. Wang, N. Liu, S. Li, M. Zhou and X. Dong, Appl. Phys. Lett., 2018, 113, 203902 CrossRef.
- H. Cheng and Z. Lu, Solid State Sci., 2008, 10, 1042–1048 CrossRef CAS.
- A. M. Azad, L. L. W. Shyan and M. A. Alim, J. Mater. Sci., 1999, 34, 1175–1187 CrossRef CAS.
- X. Hu, T. Xiao, W. Huang, W. Tao, B. Heng, X. Chen and Y. Tang, Appl. Surf. Sci., 2012, 258, 6177–6183 CrossRef CAS.
- W. Zhang, J. Tang and J. Ye, J. Mater. Res., 2011, 22, 1859–1871 CrossRef.
- F. Zhong, H. Zhuang, Q. Gu and J. Long, RSC Adv., 2016, 6, 42474–42481 RSC.
- G. L. Lucena, L. C. d. Lima, L. M. C. Honório, A. L. M. d. Oliveira, R. L. Tranquilim, E. Longo, A. G. d. Souza, A. d. S. Maia and I. M. G. d. Santos, Cerâmica, 2017, 63, 536–541 CrossRef CAS.
- Y. Yang, Y. Zhou, J. Ren, Q. Zheng, K. H. Lam and D. Lin, J. Am. Ceram. Soc., 2018, 101, 2594–2605 CrossRef CAS.
- J. Ye, G. Wang, X. Chen, F. Cao and X. Dong, Appl. Phys. Lett., 2019, 114, 122901 CrossRef.
- X. Chen, P. Gao, C. Liu, K. Zhang, X. Huang, H. Zhang, F. Zhang and Y. Pu, Ceram. Int., 2023, 49, 1436–1443 CrossRef CAS.
- A. K. Dubey, R. Kinoshita and K. I. Kakimoto, RSC Adv., 2015, 5, 19638–19646 RSC.
- S. Swain, R. Bhaskar, B. Mishra, M. K. Gupta, A. Sonia, S. Dasgupta and P. Kumar, Ceram. Int., 2022, 48, 24505–24516 CrossRef CAS.
- A. Das and D. Pamu, Mater. Sci. Eng., C, 2019, 101, 539–563 CrossRef CAS PubMed.
- A. K. Dubey, K. Kakimoto, A. Obata and T. Kasuga, RSC Adv., 2014, 4, 24601–24611 RSC.
- J. Wu, H. Zhang, N. Meng, V. Koval, A. Mahajan, Z. Gao, D. Zhang and H. Yan, Mater. Des., 2021, 198, 109344 CrossRef CAS.
- K. S. Rao, K. C. V. Rajulu, B. Tilak and A. Swathi, Natural Science, 2010, 2, 357–367 CrossRef CAS.
- G. Liu, Y. Li, J. Gao, D. Li, L. Yu, J. Dong, Y. Zhang, Y. Yan, B. Fan, X. Liu and L. Jin, J. Alloys Compd., 2020, 826, 154160 CrossRef CAS.
- R. A. Malik, A. Hussain, A. Zaman, A. Maqbool, J. U. Rahman, T. K. Song, W. J. Kim and M. H. Kim, RSC Adv., 2015, 5, 96953–96964 RSC.
- J. S. Lee, K. N. Pham, H. S. Han, H. B. Lee and V. D. N. Tran, J. Korean Phys. Soc., 2012, 60, 212–215 CrossRef CAS.
- K. N. Pham, A. Hussain, C. W. Ahn, W. Kim, S. J. Jeong and J. S. Lee, Mater. Lett., 2010, 64, 2219–2222 CrossRef CAS.
- P. Jaita, A. Watcharapasorn, D. P. Cann and S. Jiansirisomboon, J. Alloys Compd., 2014, 596, 98–106 CrossRef CAS.
- T. H. Dinh, M. R. Bafandeh, J. K. Kang, C. H. Hong, W. Jo and J. S. Lee, Ceram. Int., 2015, 41, S458–S463 CrossRef CAS.
- N. B. Do, H. D. Jang, I. Hong, H. S. Han, D. T. Le, W. P. Tai and J. S. Lee, Ceram. Int., 2012, 38, S359–S362 CrossRef CAS.
- V. Chauhan, S. K. Ghosh, A. Hussain and S. K. Rout, J. Alloys Compd., 2016, 674, 413–424 CrossRef CAS.
- S. Bhandari, N. Sinha and B. Kumar, Ceram. Int., 2016, 42, 4274–4284 CrossRef CAS.
- L. Zhang, Y. Pu and M. Chen, J. Alloys Compd., 2019, 775, 342–347 CrossRef CAS.
- P. Butnoi, S. Manotham, P. Jaita, C. Randorn and G. Rujijanagul, J. Eur. Ceram. Soc., 2018, 38, 3822–3832 CrossRef CAS.
- J. Hao, B. Shen, J. Zhai, C. Liu, X. Li, X. Gao and J. Roedel, J. Am. Ceram. Soc., 2013, 96, 3133–3140 CrossRef CAS.
- G. Hernandez-Cuevas, J. R. Leyva Mendoza, P. E. García-Casillas, C. A. Rodríguez González, J. F. Hernandez-Paz, G. Herrera-Pérez, L. Fuentes-Cobas, S. Díaz de la Torre, O. Raymond-Herrera and H. Camacho-Montes, J. Adv. Ceram., 2019, 8, 278–288 CrossRef CAS.
- X. Qiao, D. Wu, F. Zhang, M. Niu, B. Chen, X. Zhao, P. Liang, L. Wei, X. Chao and Z. Yang, J. Eur. Ceram. Soc., 2019, 39, 4778–4784 CrossRef CAS.
- W. Bai, D. Chen, P. Zheng, B. Shen, J. Zhai and Z. Ji, Dalton Trans., 2016, 45, 8573–8586 RSC.
- A. Deng and J. Wu, J. Materiomics, 2020, 6, 286–292 CrossRef.
- H. Xie, L. Yang, S. Pang, C. Yuan, G. Chen, H. Wang, C. Zhou and J. Xu, J. Phys. Chem. Solids, 2019, 126, 287–293 CrossRef CAS.
- W. Bai, D. Chen, Y. Huang, P. Zheng, J. Zhong, M. Ding, Y. Yuan, B. Shen, J. Zhai and Z. Ji, Ceram. Int., 2016, 42, 7669–7680 CrossRef CAS.
- R. Kang, Z. Wang, X. Lou, W. Liu, P. Shi, X. Zhu, X. Guo, S. Li, H. Sun, L. Zhang and Q. Sun, Chem. Eng. J., 2021, 410, 128376 CrossRef CAS.
- J. Shi, H. Fan, X. Liu, A. J. Bell and J. Roedel, J. Am. Ceram. Soc., 2013, 97, 848–853 CrossRef.
- N. A. Kamel, Biophys. Rev., 2022, 14, 717–733 CrossRef CAS PubMed.
- H. Xie, Y. Zhao, J. Xu, L. Yang, C. Zhou, H. Zhang, X. Zhang, W. Qiu and H. Wang, J. Alloys Compd., 2018, 743, 73–82 CrossRef CAS.
- D. K. Kushvaha, S. K. Rout and B. Tiwari, J. Alloys Compd., 2019, 782, 270–276 CrossRef CAS.
- N. Truong-Tho and L. D. Vuong, J. Electroceram., 2020, 45, 47–55 CrossRef CAS.
- R. N. Perumal and V. Athikesavan, J. Mater. Sci.: Mater. Electron., 2020, 31, 4092–4105 CrossRef CAS.
- Z. Yu, Y. Liu, M. Shen, H. Qian, F. Li and Y. Lyu, Ceram. Int., 2017, 43, 7653–7659 CrossRef CAS.
- P. Jaita, R. Sanjoom, N. Lertcumfu and G. Rujijanagul, RSC Adv., 2019, 9, 11922–11931 RSC.
- L. D. Vuong, D. A. Quang, V. T. Tung, N. H. Chuc and N. N. Trac, J. Mater. Sci.: Mater. Electron., 2020, 31, 18056–18069 CrossRef.
- L. D. Vuong and P. D. Gio, J. Alloys Compd., 2020, 817, 152790 CrossRef CAS.
- P. Jaita, N. Lertcumfu and G. Rujijanagul, Integr. Ferroelectr., 2019, 201, 142–154 CrossRef CAS.
- L. D. Vuong, D. A. Quang, P. Van Quan and N. Truong-Tho, J. Electron. Mater., 2020, 49, 6465–6473 CrossRef CAS.
- Z. Dai, C. Liu, Y. Pan, J. Hou, Y. Pan, X. Zhao, W. Liu, Y. Cong and S. Gu, Int. J. Appl. Ceram. Technol., 2024, 21, 2037–2045 CrossRef CAS.
- Q. Li, L. Ning, C. Wang and H. Fan, Mater. Sci. Eng., B, 2021, 263, 114819 CrossRef CAS.
- T. H. Dinh, J. K. Kang, J. S. Lee, N. H. Khansur, J. Daniels, H. Y. Lee, F. Z. Yao, K. Wang, J. F. Li, H. S. Han and W. Jo, J. Eur. Ceram. Soc., 2016, 36, 3401–3407 CrossRef CAS.
- J. Chen, Y. Wang, Y. Zhang, Y. Yang and R. Jin, J. Eur. Ceram. Soc., 2017, 37, 2365–2371 CrossRef CAS.
- P. Fan, Y. Zhang, B. Xie, Y. Zhu, W. Ma, C. Wang, B. Yang, J. Xu, J. Xiao and H. Zhang, Ceram. Int., 2018, 44, 3211–3217 CrossRef CAS.
- P. Jaita, S. Manotham, P. Butnoi, R. Sanjoom, P. Arkornsakul, D. R. Sweatman, C. Kruea-In and T. Tunkasiri, Integr. Ferroelectr., 2018, 187, 147–155 CrossRef CAS.
- P. Sayan, S. T. Sargut and B. Kıran, Powder Technol., 2010, 197, 254–259 CrossRef CAS.
- H. S. Guder, E. Şahin, O. Şahin, H. Göçmez, C. Duran and H. Ali Çetinkar, Acta Phys. Pol., A, 2011, 120, 1026–1033 CrossRef CAS.
- P. Jaita, N. Boothrawong, N. Lertcumfu, P. Malasri, P. Jarupoom, T. Tunkasiri and G. Rujijanagul, Integr. Ferroelectr., 2021, 214, 2–10 CrossRef CAS.
- V. R. Sivaperumal, R. Mani, M. S. Nachiappan and K. Arumugam, Mater. Charact., 2017, 134, 416–421 CrossRef CAS.
- M. F. Wangler and H. J. Bellen, in Basic Science Methods for Clinical Researchers, 2017 Search PubMed.
- J. Lopez-Garcia, M. Lehocky, P. Humpolicek and P. Saha, J. Funct. Biomater., 2014, 5, 43–57 CrossRef.
- M. Precnerová, K. Bodišová, F. Frajkorová, D. Galusková, Z. Varchulová Nováková, J. Vojtaššák, Z. Lenčéš and P. Šajgalík, Ceram. Int., 2015, 41, 8100–8108 CrossRef.
- D. Lahiri, V. Singh, A. P. Benaduce, S. Seal, L. Kos and A. Agarwal, J. Mech. Behav. Biomed. Mater., 2011, 4, 44–56 CrossRef CAS PubMed.
- H. M. Kim, T. Himeno, T. Kokubo and T. Nakamura, Biomaterials, 2005, 26, 4366–4373 CrossRef CAS PubMed.
- H. M. Kim, T. Himeno, M. Kawashita, T. Kokubo and T. Nakamura, J. R. Soc., Interface, 2004, 1, 17–22 CrossRef CAS PubMed.
Footnote |
| † Electronic supplementary information (ESI) available. See DOI: https://doi.org/10.1039/d4ra03591g |
| This journal is © The Royal Society of Chemistry 2024 |

