
 Open Access Article
 This Open Access Article is licensed under a Creative Commons Attribution-Non Commercial 3.0 Unported Licence
Fabrication of a ternary biocomposite film based on polyvinyl alcohol, cellulose nanocrystals, and silver nanoparticles for food packaging†
Long Hoang Nguyenabd,
Trang Thanh Tranab,
Thanh-My Thi Nguyenab,
Hieu Van Le abc,
Kim-Phung Le Nguyend and
An Nang Vu*ab
abc,
Kim-Phung Le Nguyend and
An Nang Vu*ab
aFaculty of Materials Science and Technology, University of Science, VNU-HCM, 700000, Vietnam. E-mail: vnan@hcmus.edu.vn
bVietnam National University Ho Chi Minh City, 700000, Vietnam
cLaboratory of Multifunctional Materials, University of Science, VNU-HCM, 700000, Vietnam
dInstitute of Science and Technology for Energy and Environment, Vietnam Academy of Science and Technology, 700000, Vietnam
First published on 11th June 2024
Abstract
Silver nanoparticles (AgNPs) were loaded on deprotonated cellulose nanocrystals (CNCd) and incorporated into polyvinyl alcohol (PVA) to develop novel active food packaging films. The AgNPs were fabricated using the liquid phase chemical reduction method using the sodium borohydride reductant of AgNO3. The analysis using X-ray diffraction (XRD), Fourier transform infrared spectroscopy (FT-IR), Thermogravimetric analysis (TGA), Differential scanning calorimetry (DSC), and Ultraviolet-visible spectroscopy (UV-Vis) showed that the CNCd surface had a homogeneous distribution of AgNPs with a diameter of about 100 nm. Additionally, CNCd/Ag was successfully incorporated into the PVA film. The developed PVA/CNCd/Ag film showed significantly improved mechanical properties, thermal stability, and UV barrier properties compared to a neat PVA film. The PVA/CNCd/Ag composite film could significantly preserve bananas for 14 days, preventing deterioration and allowing extended storage periods. This composite film generally shows promise in food packaging and prolongs food's shelf life.
1. Introduction
Food packaging is one of the most significant uses of polymers derived from petroleum, with 19% of all polymers derived from fossil fuels utilized for food packaging.1,2 Polymer packaging materials safeguard food from external influences (microorganisms, chemical interactions, ultraviolet (UV)/visible light, temperature, and humidity), thus preserving food quality and extending its shelf life.3 The consumption of food packaging materials is projected to increase annually at approximately 7.05% (from 2019 to 2026), raising concerns about plastic packaging waste.4 Because conventional food-packaging materials (such as polypropylene and polyethylene terephthalate) are not biodegradable, plastic waste decomposition takes ten to hundreds of years.5 Therefore, increased plastic waste from food packaging has caused grave environmental concerns.3 These worries and the scarcity of petroleum resources have prompted the development of biodegradable food packaging materials.6,7Polyvinyl alcohol (PVA) is one of the most commonly employed biodegradable synthetic polymers. It possesses numerous exceptional physicochemical properties, including a remarkable film-forming ability, good chemical resistance, good sealing ability, outstanding oxygen/aroma barrier properties, biocompatibility, and good thermal stability. Consequently, it is utilized in various industrial applications, including packaging, coatings, textiles, paper, membranes, and medical devices. However, due to the abundance of hydroxyl groups, pure PVA film has significant limitations as a packaging material, including poor water resistance and water vapor barrier properties.8,9 In addition, the mechanical strength of pure PVA film is lower than that of conventional packaging polymers.8 Adding nanofillers, like silica,10 carbon nanotubes,11 and nanoparticles,12 to PVA can enhance its mechanical properties. However, introducing these inorganic nanofillers compromises its biocompatibility and biodegradability. Researchers have shown significant interest in using nanofillers derived from natural materials to preserve PVA's biodegradability.
Cellulose, the most common natural carbohydrate polymer, is used to construct CNC. Through acid hydrolysis, cellulose's amorphous domains are dissolved to produce CNC with predominantly crystalline domains.13 Nanoscale CNC typically has a rod-like shape (3–20 nm in diameter and 100–1000 nm in length). CNC has exceptional mechanical strength, Young's modulus, good oxygen barrier properties, a large surface area, and excellent biodegradability.13,14 CNC is regarded as a superior natural reinforcing fiber that enhances the mechanical properties of polymer matrices.15,16 Moreover, CNC and PVA are compatible because they can form hydrogen bonds.17,18 According to previous research, CNC can considerably improve PVA films' mechanical strength and water vapor barrier properties.19–21
Due to its straightforwardness, the solution casting method is the most frequently employed approach for transferring CNC into a PVA matrix. This method can be implemented by casting a mixture of CNC suspension and PVA solution into Teflon, polypropylene, or glass dishes and allowing water to evaporate at the appropriate temperature.22 An essential factor of this procedure is that the CNC must be uniformly distributed throughout the PVA matrix. As a result, it is necessary to prepare the CNC and PVA matrix in an aqueous solution, ensuring that both components remain stable throughout the combining process of the constituents. Nevertheless, the dispersion of CNC into a suspension in water is exceedingly challenging owing to the formation of hydrogen-bound CNC networks, which consist of numerous hydroxyl groups on their surface.23,24 Introducing anionic groups (carboxyl groups) onto the surface of CNC (carboxylated CNC) can facilitate dispersion in water by increasing electrostatic repulsion and loosening the hydrogen-bound network. Additionally, carboxylated CNC offers greater reactivity than unmodified CNC because the carboxyl group can be functionalized25 and cross-linked,26 broadening the range of refined products that can be improved by CNC incorporation.27,28
One of the primary contributors to food deterioration is bacteria.29 However, CNC is not intrinsically antibacterial, which limits its use in functional packaging.30 Incorporating antimicrobial agents into packaging materials has thus generated considerable interest in antibacterial packaging materials. Recently, food packaging has incorporated metal nanoparticles, including copper, gold, silver, and zinc, due to their exceptional physicochemical characteristics and potent antibacterial activity. The wide-ranging antibacterial activity, exceptional thermostability, and reduced volatility of silver nanoparticles (AgNPs) compared to alternative metals have led to their widespread application.31 Additionally, AgNPs can assimilate and decompose ethylene generated throughout the maturation process of fruits and vegetables, thereby effectively prolonging the perishability of perishable foods.32,33 The addition of AgNPs to composites composed of PVA exhibits notable antibacterial and UV-blocking properties.34 Nevertheless, the limited water resistance and inadequate mechanical strength of PVA-AgNPs composites will prevent their extensive implementation in food packaging.35 Another challenge is that, due to their high surface energy, AgNPs are susceptible to aggregation to reduce their surface area; this can result in a noticeable decline in their antibacterial activity.36 Therefore, developing a method to produce and immobilize AgNPs with potent antibacterial properties is critical. CNC can function as a stabilizer and a template for the synthesis and immobilization of AgNPs. Its favorable dispersion on the CNC surface is attributed to its substantial specific surface area and ample hydroxyl groups, which enable it to form complexes with Ag+ via ion–dipole interactions on the cellulose backbone.37
Most papers describe the coupling of AgNPs with CNC as a two-stage process in which AgNPs are first created by reducing silver salts (i.e., AgNO3) and then introduced into a CNC suspension. Three methods have been devised to make hybrid CNC–Ag composites: (i) adding a reducing agent to the metal precursor in the presence of CNC;38,39 (ii) using CNC as both a reducing agent and immobilization substrate;40,41 and (iii) reduction via surface-functionalized CNC.42 The first way is the simplest, including adding a common reducing agent such as NaBH4, ascorbic acid, or hydrazine to a CNC suspension in the presence of an Ag precursor solution. However, this technique is not selective, and most AgNPs are synthesized in solution, with just a tiny proportion produced on the surface of CNC. The second strategy uses CNC as both a support and a reducer for the nucleation of AgNPs, using the hydroxyl groups' reducing ability. Although this approach is appealing, direct evidence of the involvement of hydroxyl groups in the reduction process has yet to be confirmed, and the presence of functional groups such as carboxylic, sulfate, or amine is suggested to promote the coordination of Ag+ ions to the surface of CNC. In addition, the reduction process must be started at a temperature higher than 80 °C. The third strategy is based on the surface functionalization of CNC with particular groups capable of acting as a reducing agent in silver ionic aqueous solutions.
Others have demonstrated AgNPs production in carboxylated cellulose species. However, a reducing precursor for Ag ions, such as sodium borohydride or ascorbic acid, is required in most situations.43,44 Studies that did not employ additional reducing agents for one-pot AgNPs production on carboxylated cellulose found that either a high-temperature treatment or UV irradiation for different periods was necessary.45,46 The current study describes a one-pot production of AgNPs in cellulose using deprotonated carboxylic groups at room temperature without the necessity for sample postprocessing. We predict Ag NPs will form and grow preferentially on the surface of CNC. This guarantees that the Ag NPs are effectively anchored to the surface of CNC, prevents the generation of free Ag NPs in solution, and allows for greater control of the AgNPs size.
The primary objective of this research was to produce a ternary biocomposite film comprised of PVA, CNC, and Ag NPs that overcomes the shortcomings of prior investigations while retaining their superior properties. Mass-producing the nanocomposites via thermoforming procedures47,48 was advantageous due to the thermoplastic character of the PVA substrate. In addition, the potential interaction between AgNPs and CNC would result in a more uniform distribution of AgNPs and CNC within the prepared PVA matrix, thus improving the material's performance.
2. Experimental
2.1. Chemicals and reagents
PVA beads (Mw 31![[thin space (1/6-em)]](https://www.rsc.org/images/entities/char_2009.gif) 000–50000; 87–89% hydrolyzed), cellulose microcrystalline powder (CMC-Avicel®PH-101, ∼50 μm in particle size), and sodium borohydride (NaBH4, ≥96.0%) were purchased from Sigma-Aldrich. Hydrogen chloride (HCl, 36%), sodium hydroxide (NaOH, 96%), silver nitrate (AgNO3, 99%), and citric acid monohydrate (C6H8O7·H2O, 99%) originated in China. All the materials were used as received, and deionized water was used throughout the experimentation.
000–50000; 87–89% hydrolyzed), cellulose microcrystalline powder (CMC-Avicel®PH-101, ∼50 μm in particle size), and sodium borohydride (NaBH4, ≥96.0%) were purchased from Sigma-Aldrich. Hydrogen chloride (HCl, 36%), sodium hydroxide (NaOH, 96%), silver nitrate (AgNO3, 99%), and citric acid monohydrate (C6H8O7·H2O, 99%) originated in China. All the materials were used as received, and deionized water was used throughout the experimentation.
2.2. Preparation and deprotonation of CNC (CNCd)
CNC was isolated from cellulose microcrystalline (CMC) using a hydrolysis method reported by Yu et al.49 In brief, 8.0 g of CMC was added to 400 mL of a 90% C6H8O7/10% HCl mixed acid solution (400 mL, 3 M C6H8O7, and 6 M HCl). The mixture was heated at 80 °C for 6 hours with constant mechanical agitation. Upon completion, the resultant suspension was quickly cooled to room temperature and centrifuged at 4000 rpm with deionized (DI) water until its pH was approximately 7. CNC was deprotonated in a NaHCO3 solution with a CNC:NaHCO3 ratio of 1:75 (w/v) for 30 minutes at room temperature while agitating continuously. The CNCd obtained was then centrifuged at 4000 rpm with DI and freeze-dried.
2.3. Synthesis of Ag nanoparticles on CNCd (CNCd/Ag)
0.5 g of CNCd was agitated continuously for 15 hours in 0.05 M AgNO3 solution. After obtaining the solid sample by filtration, it was stirred for 15 minutes in 15 mL of DI water with NaOH solution added steadily until the pH reached 10 to 11. After adding 0.4 mL of NaBH4 0.01 M, the mixture was agitated continuously for 24 hours. The obtained product was centrifuged multiple times with DI and then desiccated at 110 °C for 3 hours. It was a greyish-brown substance denoted by the symbol CNCd/Ag.2.4. Preparation of PVA/CNCd/Ag nanocomposite
By dissolving PVA beads in deionized (DI) water at 90 °C for 2 hours with magnetic stirring (500 rpm) and then cooling to room temperature, a PVA solution (12 wt%) was produced. The PVA solution was cast on Petri dishes to create the PVA film. For the preparation of PVA/CNCd film, 0.05 g CNCd was added to a 50 g PVA solution (12 wt%), which was then stirred at 1000 rpm for 12 hours and sonicated in an ultrasonic bath for 30 minutes before being poured into Petri dishes. Like PVA/CNCd film, the PVA/CNCd/Ag nanocomposite was created by adding 0.05 g of CNCd/Ag powder to 50 g of PVA solution (12 wt%). This mixture was agitated at 1000 rpm for 12 hours and then sonicated for 30 minutes to ensure an even distribution of CNCd/Ag throughout the PVA solution. Casting the PVA/CNCd/Ag suspension on Petri dishes produced the PVA/CNCd/Ag film. The PVA, PVA/CNCd, and PVA/CNCd/Ag films with a thickness of 100 μm were obtained after approximately five days of curing at room temperature (23–25 °C).2.5. Preparation of PVA coating solutions and application of coatings on fruit
To demonstrate the potential applications of the PVA/CNCd/Ag film in food packaging, a preservation test of banana at room temperature (23–25 °C) was performed for 14 days. The examined samples of bananas originated from recently harvested gardens that did not use preservatives. Before being stored, every banana should be brilliant green, firm, have green stems, be free from pests, and be undamaged. Subsequently, preservative solutions consisting of PVA, PVA/CNCd, and PVA/CNCd/Ag were applied to the banana samples. Fresh bananas were completely immersed in the PVA coating solutions for 15 seconds to achieve uniform surface coatings. Then, they were drained and dried at room temperature for 30 minutes, and finally, they were observed at room temperature for 14 days.2.6. Characterizations
2.7. Statistical analysis
All measurements were performed at least in triplicate, and the results were expressed as means ± standard deviations. One-way analysis of variance (ANOVA) with Tukey's test using Minitab 19 software was employed to analyze the data. Statistical significance was considered when the p-value was <0.05 in all the analyses.3. Results and discussion
3.1. Characteristics of CNCd/Ag material
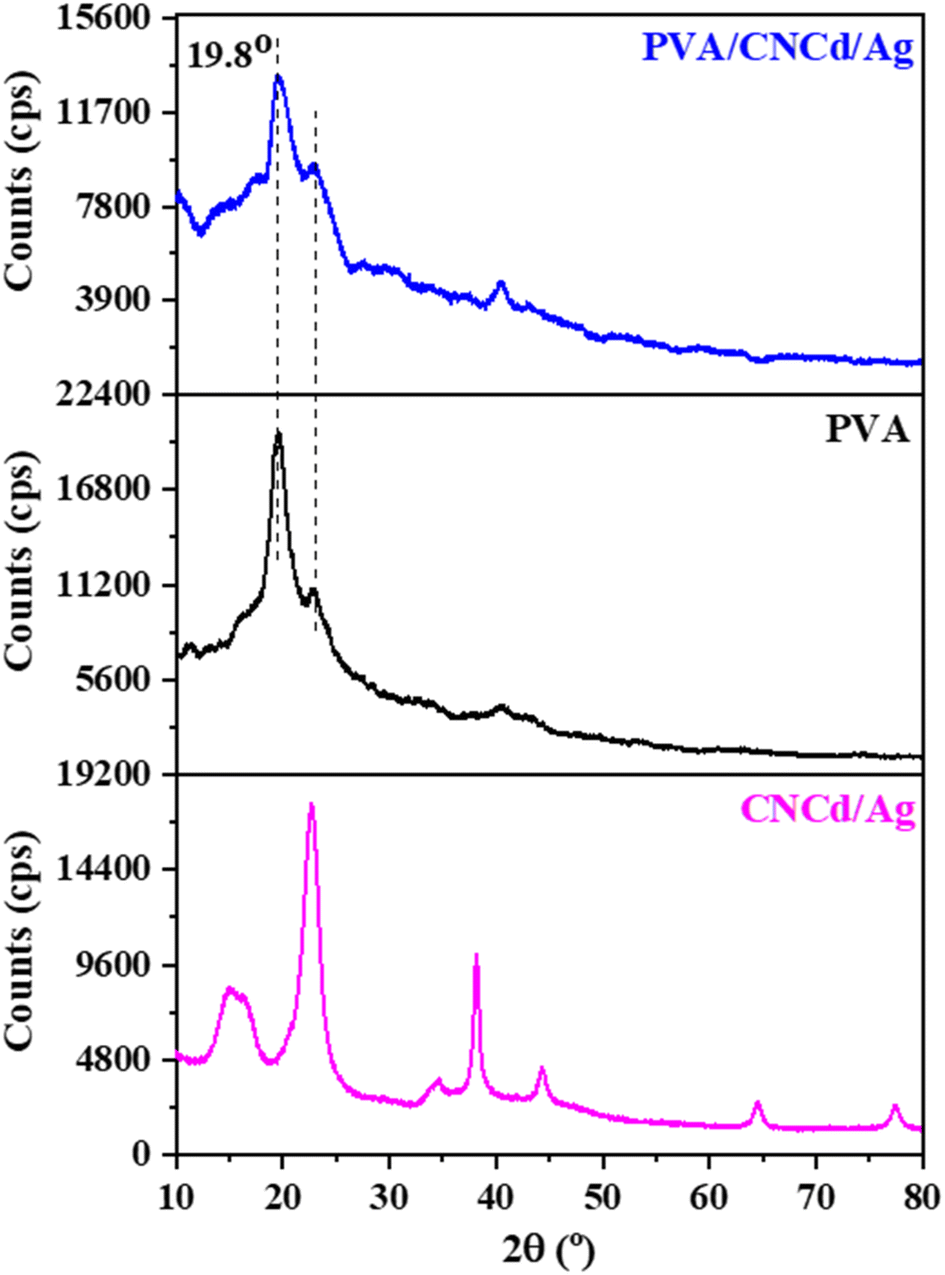
![[1 with combining macron]](https://www.rsc.org/images/entities/char_0031_0304.gif) 0), (110), (200), and (004), respectively.50 The samples' crystallinity was determined using the Segal formula (1).51
0), (110), (200), and (004), respectively.50 The samples' crystallinity was determined using the Segal formula (1).51 | CrI (%) = [(I200 − Iam)/I200] × 100 | (1) |
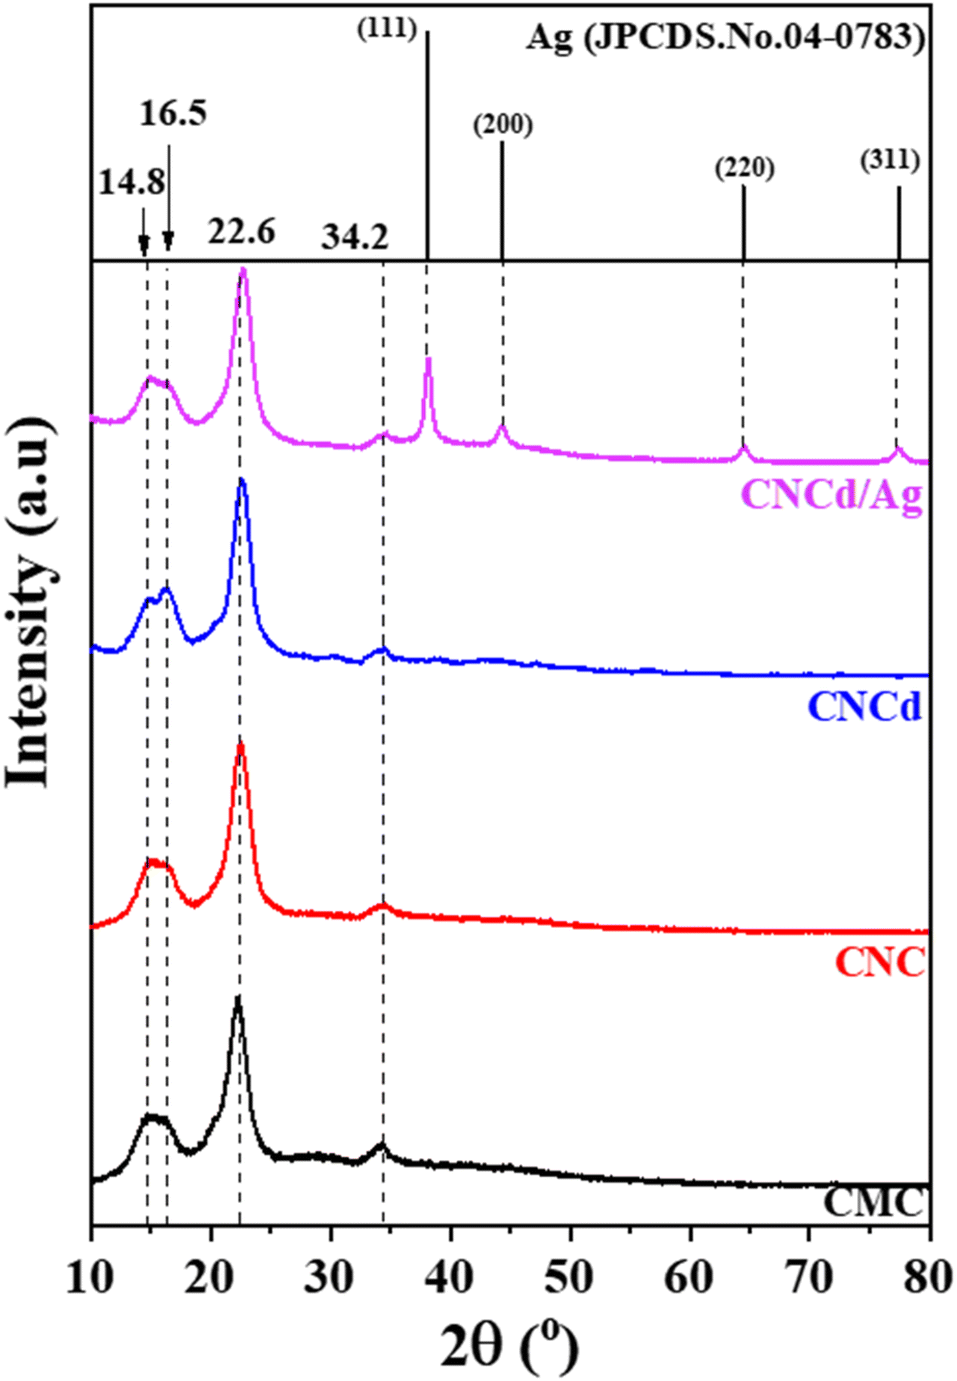 | ||
| Fig. 1 XRD pattern of CMC, CNC, CNCd, and CNCd/Ag. | ||
When CMC was hydrolyzed with a mixture of citric acid and HCl, the crystallinity of CNC was 5.1% greater than that of CMC (CrICNC = 82.3% > CrICMC = 77.5%). In addition, the absence of a shift in the diffraction peaks indicated that hydrolysis only eliminated the amorphous portion of the CMC structure to form CNC and increased crystallinity without altering the crystal structure. After deprotonation of CNC, the resultant CNCd possessed a lower crystallinity than CNC but a higher crystallinity than CMC, as shown in Table 1. This result can be attributed to the fact that COO− groups formed after deprotonation typically repelled each other (due to their identical negative charge) and disrupted some ordered regions of the CNC, resulting in CNCd having a lower crystallinity than CNC.52
| Samples | CrI (%) | Ag's crystalline size (nm) |
|---|---|---|
| CMC | 77.2 | — |
| CNC | 82.3 | — |
| CNCd | 79.5 | — |
| CNCd/Ag | 72.9 | 10.85 |
The XRD pattern of CNCd/Ag revealed four cellulose peaks at 2θ = 14.4°, 16.5°, 26.6°, and 34.6°. In addition, as a result of the synthesis of AgNPs, additional peaks have appeared at 2θ = 38.2°, 44.1°, 64.4°, and 77.5°, corresponding to (111), (200), (220), and (311), respectively (JCPDS#04-0783),53 indicating that AgNPs have a spherical morphology and crystalline structure. These patterns demonstrated the presence of metallic silver face-centered cubic crystals in the CNCd/Ag material.54 Additionally, the crystallinity of the CNCd/Ag sample was less than that of the CNCd sample (Table 1). The infusion of AgNPs may have realigned the CNCd molecules, reducing crystallinity.55 The crystal size D (nm) of Ag NPs decorated on CNCd was determined from the XRD pattern according to the Debye–Scherrer formula (2):
|
D = (K × λ)/(β1/2 × cosθ)
| (2) |
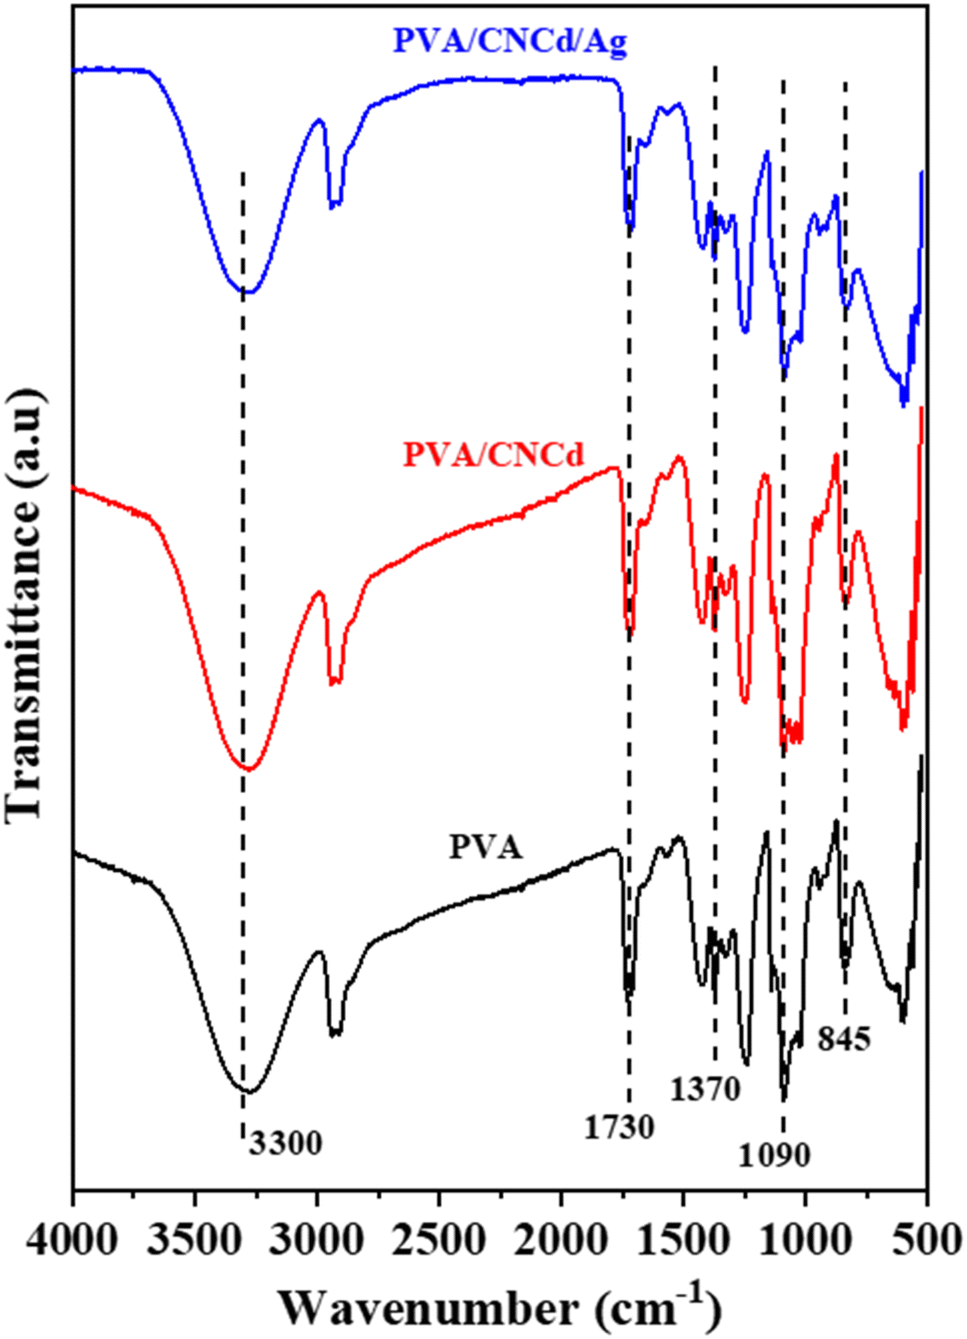
Fig. 2 illustrates the chemical structures of the CMC, CNC, CNCd, and CNCd/Ag samples via the FT-IR spectra. The FT-IR spectrum of CMC exhibited absorption peaks typical of the bond vibrations in the cellulose structure. The broad and strong absorption band at 3400 cm−1 has been attributed to the O–H stretching vibration and intermolecular hydrogen bonding. The sharp peak at 2900 cm−1 was ascribed to Csp3–H group stretching vibrations. The absorption peak indicated a β-1,4-glycosidic bond between D-glucose monomers in cellulose at 1062 cm−1, corresponding to the stretching vibration of the C1–O–C4 bond in the D-glucose ring. The peak at 897 cm−1 corresponded to C–O–C stretching at the β-1,4-glycosidic, whereas the peak at 1430 cm−1 corresponded to –CH2–(C6)– bending vibration.50,56,57
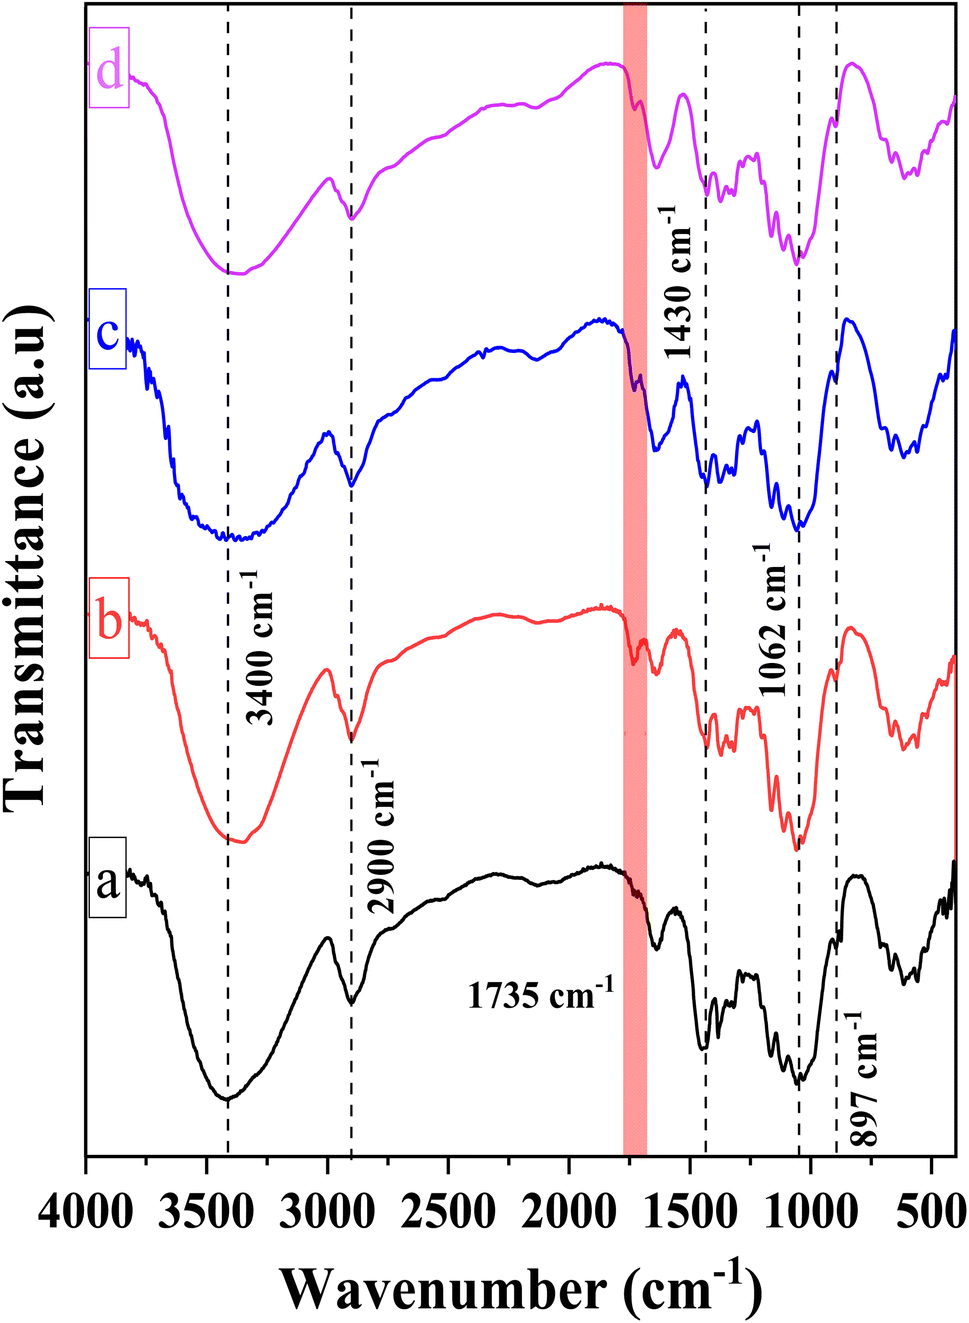 | ||
| Fig. 2 FT-IR spectra of (a) CMC, (b) CNC, (c) CNCd and (d) CNCd/Ag. | ||
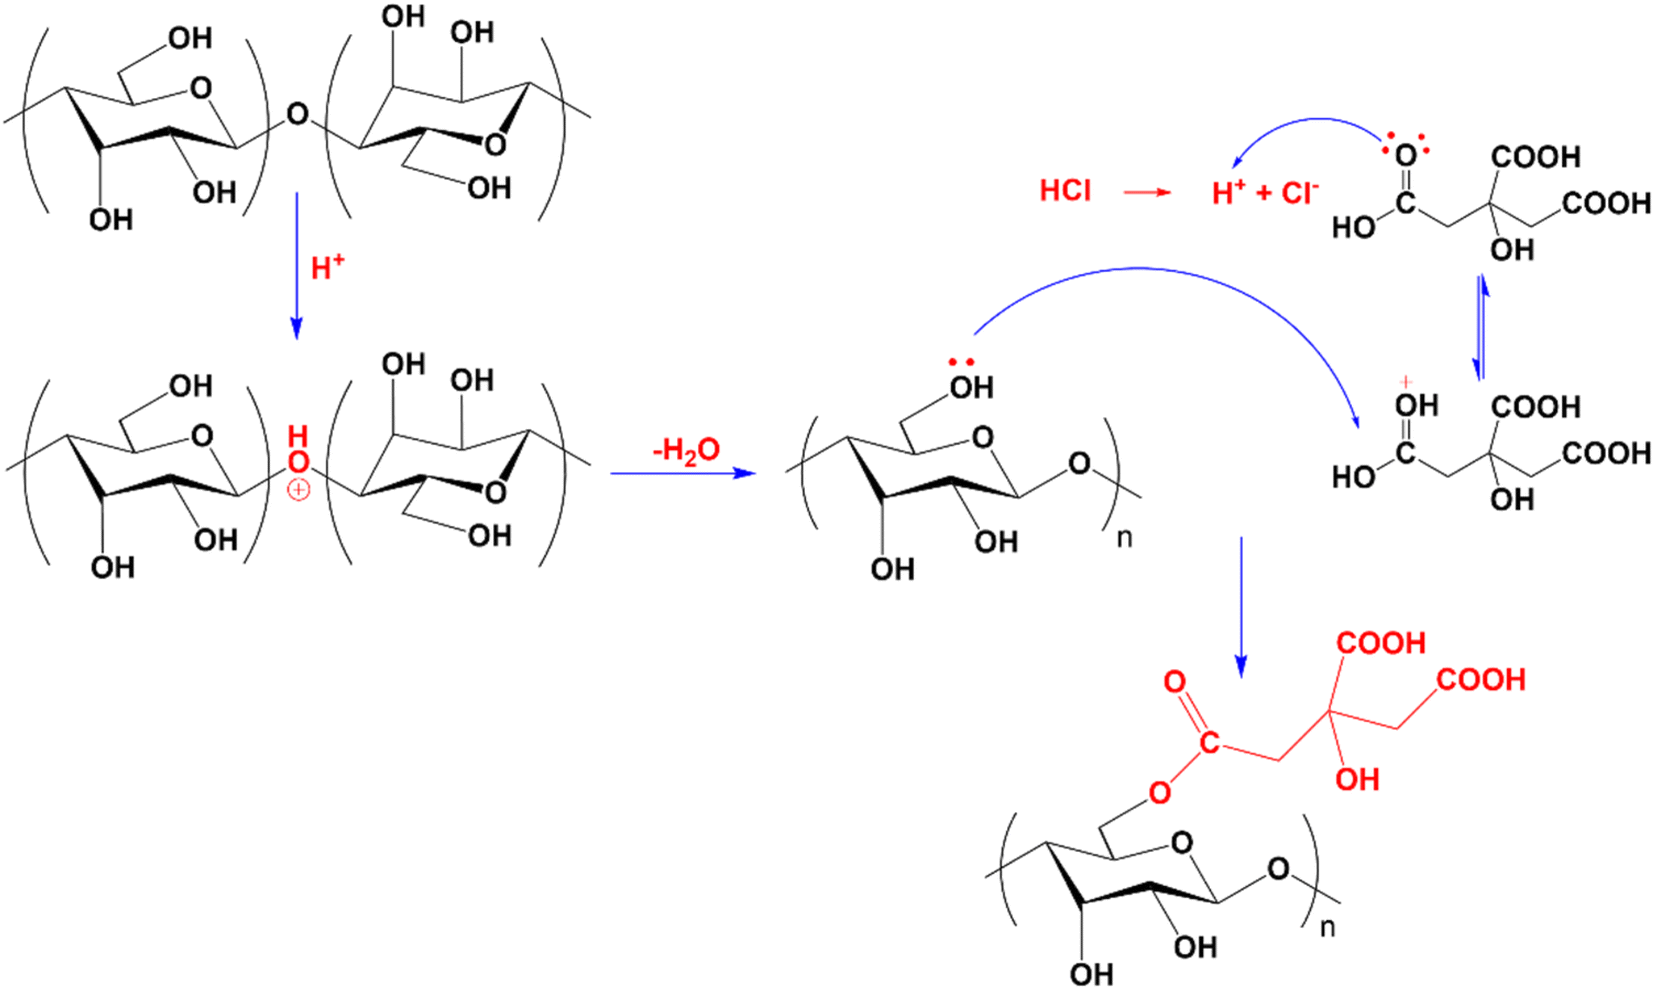
Compared to CMC, the FT-IR spectrum of CNC appeared to have a new absorption peak at 1735 cm−1, ascribed to the stretching vibration of the C![[double bond, length as m-dash]](https://www.rsc.org/images/entities/char_e001.gif) O bond in the –COOH group.58 In the hydrolysis process, not only were the amorphous portions of the CMC structure removed, which helps to increase the CNC's crystallinity, but the esterification reaction between citric acid and mobile –OH groups on the cellulose surface also took place. Consequently, the formed CNC exhibited surface functional groups –COOH after hydrolysis.52,59,60 Scheme 1 depicts the mechanism of cellulose hydrolysis and surface modification. After the reaction with citric acid, the intermolecular bonds and adsorbed water on the surface decreased due to bulky citric acid molecules replacing the O–H groups on the cellulose surface. This phenomenon was demonstrated by the fact that the O–H absorption band of CNC was sharper than that of CMC and that the characteristic peak at 1644 cm−1, attributed to the H–O–H deformation vibration of water adsorbed on CNC, has decreased substantially compared to CMC.
O bond in the –COOH group.58 In the hydrolysis process, not only were the amorphous portions of the CMC structure removed, which helps to increase the CNC's crystallinity, but the esterification reaction between citric acid and mobile –OH groups on the cellulose surface also took place. Consequently, the formed CNC exhibited surface functional groups –COOH after hydrolysis.52,59,60 Scheme 1 depicts the mechanism of cellulose hydrolysis and surface modification. After the reaction with citric acid, the intermolecular bonds and adsorbed water on the surface decreased due to bulky citric acid molecules replacing the O–H groups on the cellulose surface. This phenomenon was demonstrated by the fact that the O–H absorption band of CNC was sharper than that of CMC and that the characteristic peak at 1644 cm−1, attributed to the H–O–H deformation vibration of water adsorbed on CNC, has decreased substantially compared to CMC.
 | ||
| Scheme 1 Schematic of cellulose hydrolysis and surface modification. | ||
On the FT-IR spectrum of CNCd and CNCd/Ag, the peak at 1565 cm−1 corresponded to the stretching vibration of the CO bond in the COO− group.61 This peak indicated that CNC's COOH groups were deprotonated to COO− groups. In the CNCd sample, the peak of the O–H stretching vibration became broader, and the water H–O–H deformation vibration became more intense than that of CNC. After protonation, many negatively charged COO− groups appeared on the surface of the CNC, causing this transformation. These groups enhanced the intermolecular interactions and the affinity of CNCd for water. However, after Ag attachment, the characteristic band of the O–H bond tended to be more pointed than that of CNCd, as AgNPs bind to the COOH, O–H, and COO− groups via coordination bonds, thereby reducing intermolecular bonds. In addition, the initial results partially demonstrated that Ag had been effectively attached to CNCd support.
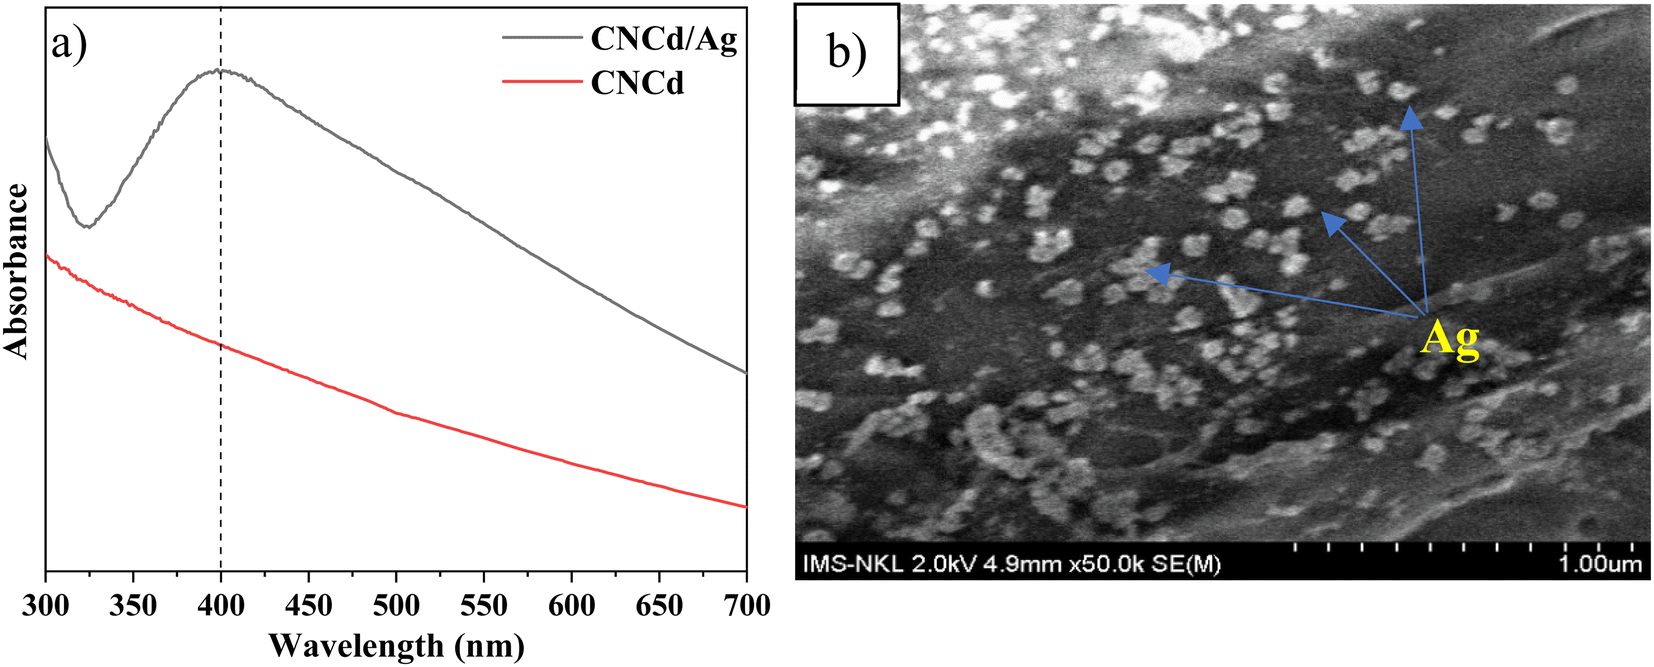 | ||
| Fig. 3 (a) UV-Vis spectra of CNCd and CNCd/Ag, and (b) SEM image of CNCd/Ag. | ||
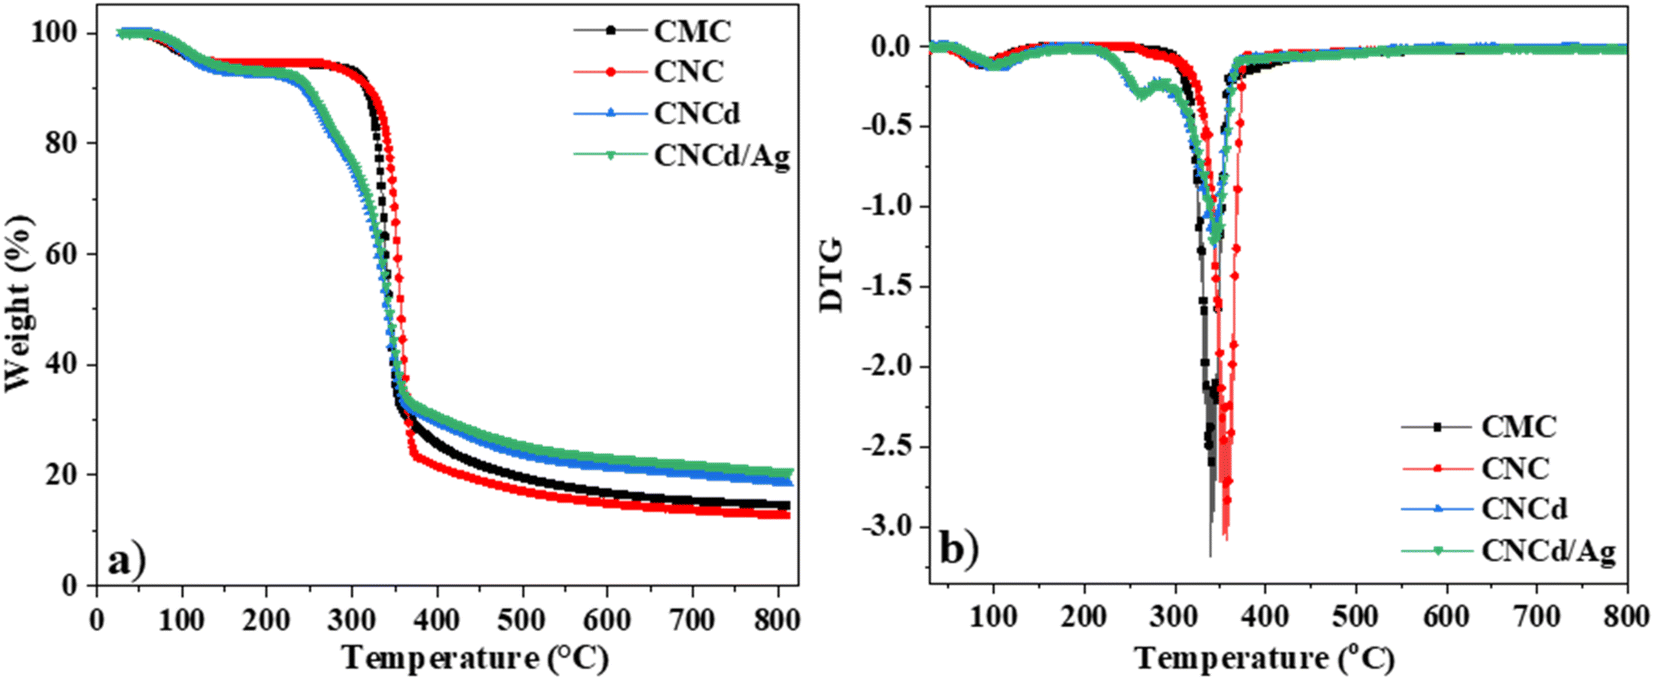 | ||
| Fig. 4 TGA (a) and DTG (b) curves of CMC, CNC, CNCd, and CNCd/Ag. | ||
| Samples | 1st decomposition stage | 2nd decomposition stage | Char yield (%) at 800 °C | ||||
|---|---|---|---|---|---|---|---|
| To (°C) | Tmax (°C) | WL (%) | To (°C) | Tmax (°C) | WL (%) | ||
| CMC | — | — | — | 265 | 341 | 82.5 | 15.0 |
| CNC | — | — | — | 255 | 357 | 81.2 | 13.3 |
| CNCd | 200 | 264 | 12.7 | 284 | 343 | 61.4 | 18.5 |
| CNCd/Ag | 200 | 264 | 12.7 | 290 | 345 | 49.2 | 21.0 |
The CMC had the following regions of mass loss: the evaporation of water from room temperature to 265 °C results in a mass loss of approximately 5.2%. The temperature range between 265 °C and 430 °C was the primary decomposition stage of CMC,62 with the maximal decomposition rate occurring at 341 °C; during this time, the functional groups on CMC were severed, resulting in a weight loss of approximately 82.5%. The remaining ash percentage was 15.0%.
The mass loss regions of CNC, cellulose with carboxylic groups, were represented on the TGA curve. First, the evaporation of water from room temperature to 255 °C corresponded to a mass loss of 5.5%. The primary decomposition stage of the CNC occurred between 255 °C and 380 °C, with the maximal decomposition rate occurring at 357 °C. The remaining ash percentage was 13.3%. The TGA results indicated that CNC decomposed heat faster than CMC. Nevertheless, CNC was more resistant to heat than CMC. The CNC decomposed first because it contains voluminous citric acid radicals that facilitate the decomposition of the samples. However, CNC crystallized better than CMC (as demonstrated by XRD results), so additional heat was required to damage the final structure.
The TGA diagram of CNCd, cellulose with sodium carboxylate groups, revealed two central regions of thermal decomposition. First, the temperature range from room temperature to 200 °C corresponded to a water mass loss of approximately 7.4% in the material structure. The first peak decomposition occurred between 200 °C and 284 °C with a maximum mass loss rate of 264 °C and a mass loss of approximately 12.7%, corresponding to the degradation of the anhydroglucuronic acid units and as the sample is heated, the carboxylate groups also participate in decarbonation and decarboxylation reactions that degrade the cellulose chains.63,64 It was reported that carboxymethyl celluloses degrade at lower temperatures by decarbonation of the sodium carboxyl groups than for cellulose.62,65 The second peak decomposition occurred at 343 °C, corresponding to the degradation of the remaining un-functionalized cellulose.63,64
The TGA diagram for the CNCd/Ag was identical to the TGA diagram for the CNCd sample. However, the CNCd/Ag residual ash was 21%. When deprotonating and attaching Ag to the CNC, cellulose exhibited different thermal behaviors. CNCd and CNCd/Ag had an extended decomposition temperature range in the decomposition region of water because the COO− groups carry a charge, increasing the quantity of water absorbed by cellulose. During deprotonation, the cellulose chains separated, allowing water molecules to penetrate the structure. In addition, CNCd and CNCd/Ag underwent an additional thermal decomposition step compared to CNC and CMC. At this stage of thermal decomposition, functional groups related to Na+ and Ag+ ions were decomposed. In addition, the amount of ash remaining on CNCd/Ag was more significant than that of CNCd because Ag had a greater molecular weight than Na.
Fig. 5 depicts the DTA analysis of CMC, CNC, CNCd, and CNCd/Ag thermal properties. The first endothermic peak of CMC and CNC appeared in the room temperature range of 160 °C due to the evaporation of water molecules adsorbed on these two samples. The CMC's second endothermic peak, indicating decomposition in the CMC structure, appeared between 265 and 400 °C, with a maximum temperature of 334 °C. In contrast, CNC had a maximum temperature of 357 °C. The CNC had a more crystalline structure and was more heat stable than CMC, as indicated by CNC's higher maximal decomposition temperature.
 | ||
| Fig. 5 DTA curves of CMC, CNC, CNCd, and CNCd/Ag. | ||
Unlike CNC, the DTA diagram of CNCd displays two exothermic peaks at 350 °C and 496 °C, along with the endothermic peak related to water evaporation. The given peaks represented the two main stages of CNCd decomposition. Decomposition began with the breaking of deprotonated side chains and the main chain of cellulose. The second step included decomposing the remaining main chain fragments and the charring process. Thermal energy was used on CNCd in both places to break the bonds. Fractured chains tended to reform bonds because of the presence of Na in the structure, leading to the subsequent breakdown of by-products. Competition between heat absorption and release processes occurred throughout these stages, with heat release prevailing, leading to exothermic peaks on the CNCd DTA diagram.
The CNCd/Ag sample exhibits an extra exothermic peak at 264 °C compared to the CNCd sample. The addition of Ag accelerated the thermal induction processes of CNCd/Ag owing to Ag's excellent heat transfer capabilities.
3.2. Characteristics of prepared biocomposite films
 | ||
| Fig. 6 XRD pattern of CNCd/Ag, PVA, and PVA/CNCd/Ag films. | ||
In addition to examining the XRD diffractogram, the FT-IR spectra (Fig. 7) of the PVA, PVA/CNCd, and PVA/CNCd/Ag films were analyzed. At 3300 cm−1, all three samples exhibited a broad absorption band, which was characteristic of the stretching vibration of the OH bond. The absorption bands at 2925 cm−1 and 2880 cm−1 represented the asymmetric and symmetric stretching vibrations of the CH2 group.
 | ||
| Fig. 7 FT-IR spectra of PVA, PVA/CNCd, and PVA/CNCd/Ag films. | ||
Fig. 7 also depicts PVA's specific absorption peaks at 845 cm−1 (vibration of C–C), 1090 cm−1 (stretching vibration of C–O), 1370 cm−1 (stretching vibration of C–C), and 1430 cm−1 (deformation vibration –CH in –CH2). The prominent absorption peak at 1730 cm−1 was characteristic of the CO bond, which was present in PVA's unhydrolyzed –OCOCH3 component. In addition, no visible absorption peaks of CNC and Ag were observed in the FT-IR spectra of the PVA/CNCd and PVA/CNCd/Ag samples, possibly due to the low amount of CNC and Ag present. In addition, when comparing the FT-IR spectra of all three materials, there was no appearance or displacement of the absorption peaks. The FT-IR results indicated that the film components did not make chemical bonds when fabricated using solvent casting.66,68
The onset of the third thermal breakdown stage occurred at 425 °C, corresponding to the degradation of the primary chain of PVA. During this stage, a mass loss of around 14% was seen, with the highest decomposition temperature recorded at 450 °C. Additionally, the maximum decomposition rate was 0.28% per °C. The charring process commenced at 500 °C, resulting in a residual ash content of around 5%.
The thermal behavior of PVA was observed to have undergone modifications in the PVA/CNCd/Ag sample. The branched-chain decomposition of PVA commenced during the second thermal decomposition stage at 275 °C. The process concluded at a temperature of 425 °C, resulting in a mass reduction of 78%. The highest temperature at which decomposition occurred was 325 °C, and the maximum decomposition rate was observed to be 1.28% per °C. The PVA underwent a primary chain breakdown process, resulting in a mass loss of around 12%. This decomposition process commenced at a temperature of 425 °C, reaching its peak at 450 °C. The maximum decomposition rate observed during this process was 0.29% per °C. The carbonization process commenced at 510 °C, resulting in a residual ash content of around 2%.
The use of Ag served as an effective catalyst and facilitator of heat transfer. Consequently, the branched-chain breakdown of PVA commenced earlier, accompanied by a decrease in both the maximum decomposition temperature and the maximum decomposition rate. Furthermore, the presence of the Ag agent contributed to a more pronounced weight loss during the degradation of two PVA stages, specifically the branching and leading chain of PVA. This reduced the amount of ash in the PVA/CNCd/Ag sample.
The DTA diagram of PVA, PVA/CNCd, and PVA/CNCd/Ag heated from room temperature to 800 °C is depicted in Fig. S3.† There were three prominent endothermic peaks in the DTA results. The endothermic peak between 55 and 240 °C was typical for the melting phase of PVA with a maximal temperature of 200 °C. In addition, at 150 °C, a minor endothermic peak corresponding to the water evaporation phase in the PVA structure was evident. The endothermic peak at 260–365 °C was characteristic of the branched-chain decomposition of PVA, with intensity decreasing from PVA, PVA/CNCd, and PVA/CNCd/Ag. Due to intermolecular interactions between dense OH groups, PVA had the greatest branched chain-breaking peak strength. CNCd inserted amid the PVA structure reduced the intermolecular interactions of the OH groups between the PVA chains, thereby decreasing the intensity of the PVA branch degrading peak after the addition of the CNCd reinforcement phase.
When Ag was attached to CNCd, the intensity of this exothermic peak continued to decrease because Ag was an exceptional thermal conductor, which made the branched chain decomposition process more favorable. In addition, due to the Ag heat transfer agent, the branch decomposing peak of PVA/CNCd/Ag shifted to 325 °C, whereas the other two samples remained at 345 °C. The endothermic peak between 400 and 500 °C corresponded to the degradation of the PVA main chain at a maximal temperature of 455 °C.
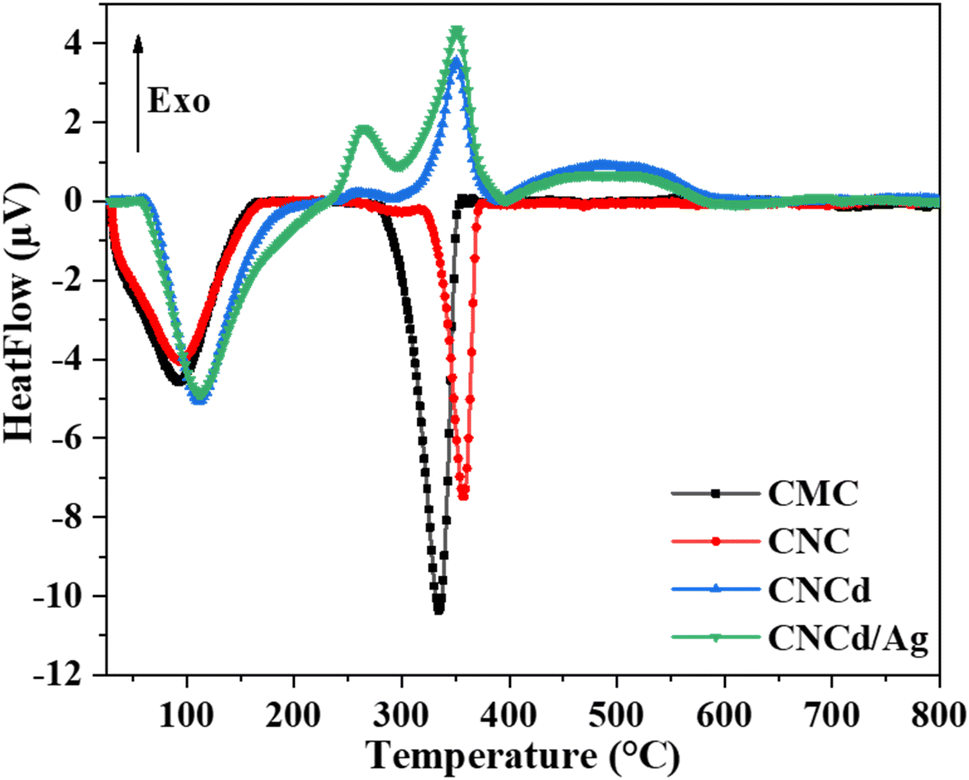
The DSC diagram of PVA, PVA/CNCd, and PVA/CNCd/Ag (Fig. 8) demonstrated that the films' thermal properties were altered in the CNCd and CNCd/Ag dispersion phases. All three films exhibited two endothermic peaks during the heating procedure. The initial endothermic peak of the PVA/CNCd sample, corresponding to water evaporation, shifted toward a higher temperature than the PVA sample. This shift can be attributed to the hydrophilic nature of PVA and CNCd, which established robust hydrogen bonds with H2O molecules adsorbed in the film. Therefore, additional heat was necessary to disrupt hydrogen bonds so H2O molecules could evaporate. Including Ag in the PVA/CNCd/Ag film decreased the hydrogen interaction between PVA, CNCd, and H2O, causing the H2O molecules to loosely retain within the film structure. Therefore, the first endothermic peak of the PVA/CNCd/Ag sample shifted to a lower temperature compared to the pure PVA film.
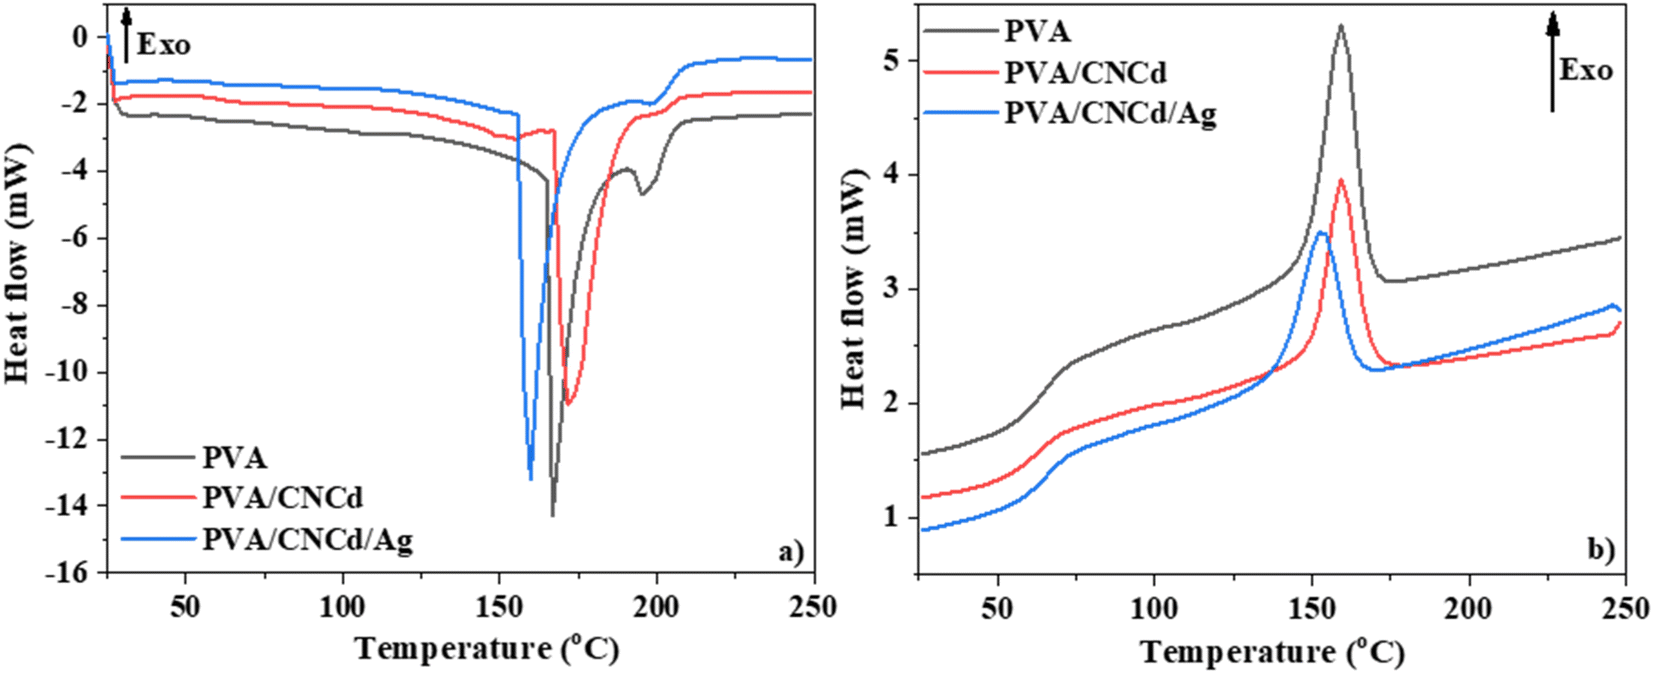 | ||
| Fig. 8 DSC curves of PVA, PVA/CNCd, and PVA/CNCd/Ag films through (a) heating (b) cooling cycle. | ||
The second endothermic peak, corresponding to the PVA melting process,71,72 appeared at approximately 200 °C. This peak area decreased when the CNCd and CNCd/Ag were added to the PVA/CNCd and PVA/CNCd/Ag samples, compared to the neat PVA sample. The presence of CNCd and CNCd/Ag dispersion phase in the PVA matrix reduced the interaction between PVA chains, destroying the crystalline structure of PVA and reducing the heat required to melt PVA. In addition, Ag was an excellent heat transfer agent, so the amount of heat required to melt PVA continues to decrease in the presence of Ag in the PVA structure.
During the cooling phase, the influence of CNCd and CNCd/Ag on the crystallization of the PVA matrix was more pronounced (Fig. 8b). PVA, PVA/CNCd, and PVA/CNCd/Ag all exhibited an exothermic peak at a maximal temperature of 160 °C, 153 °C, and 153 °C, respectively. The decreasing peak area between PVA, PVA/CNCd, and PVA/CNCd/Ag demonstrated that the interaction between the CNC and CNCd/Ag dispersed phase and the PVA matrix affects the interaction between PVA chains, making the PVA in PVA/CNCd and PVA/CNCd/Ag more challenging to crystallize than pure PVA.73
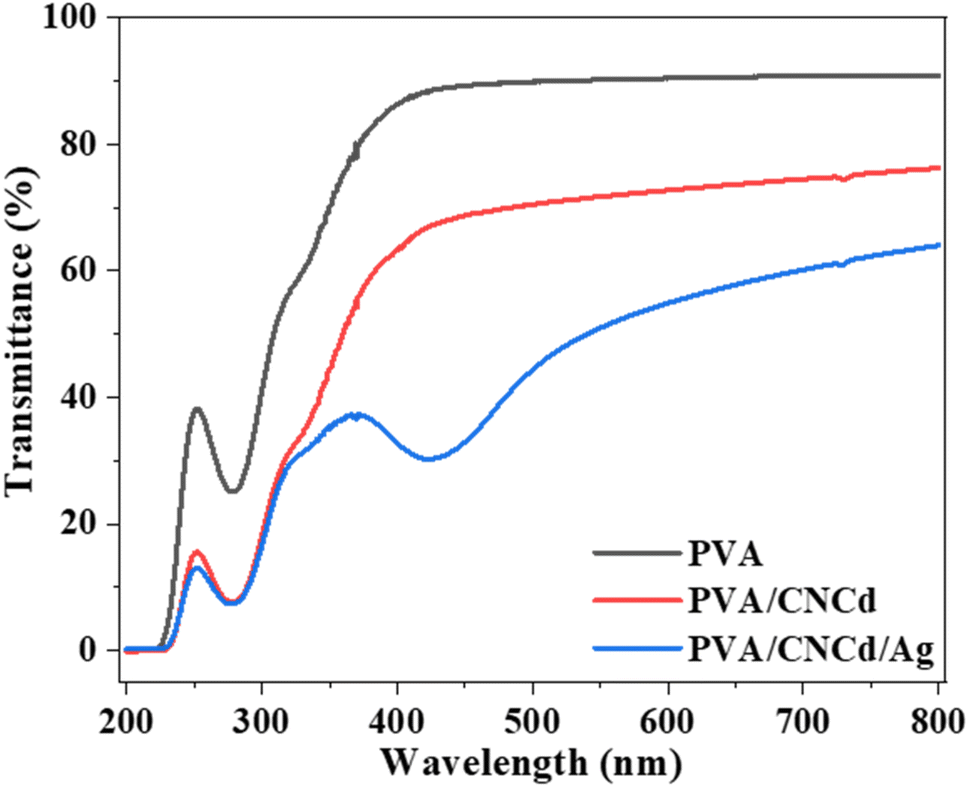 | ||
| Fig. 9 UV-Vis spectra of PVA, PVA/CNCd, and PVA/CNCd/Ag films. | ||
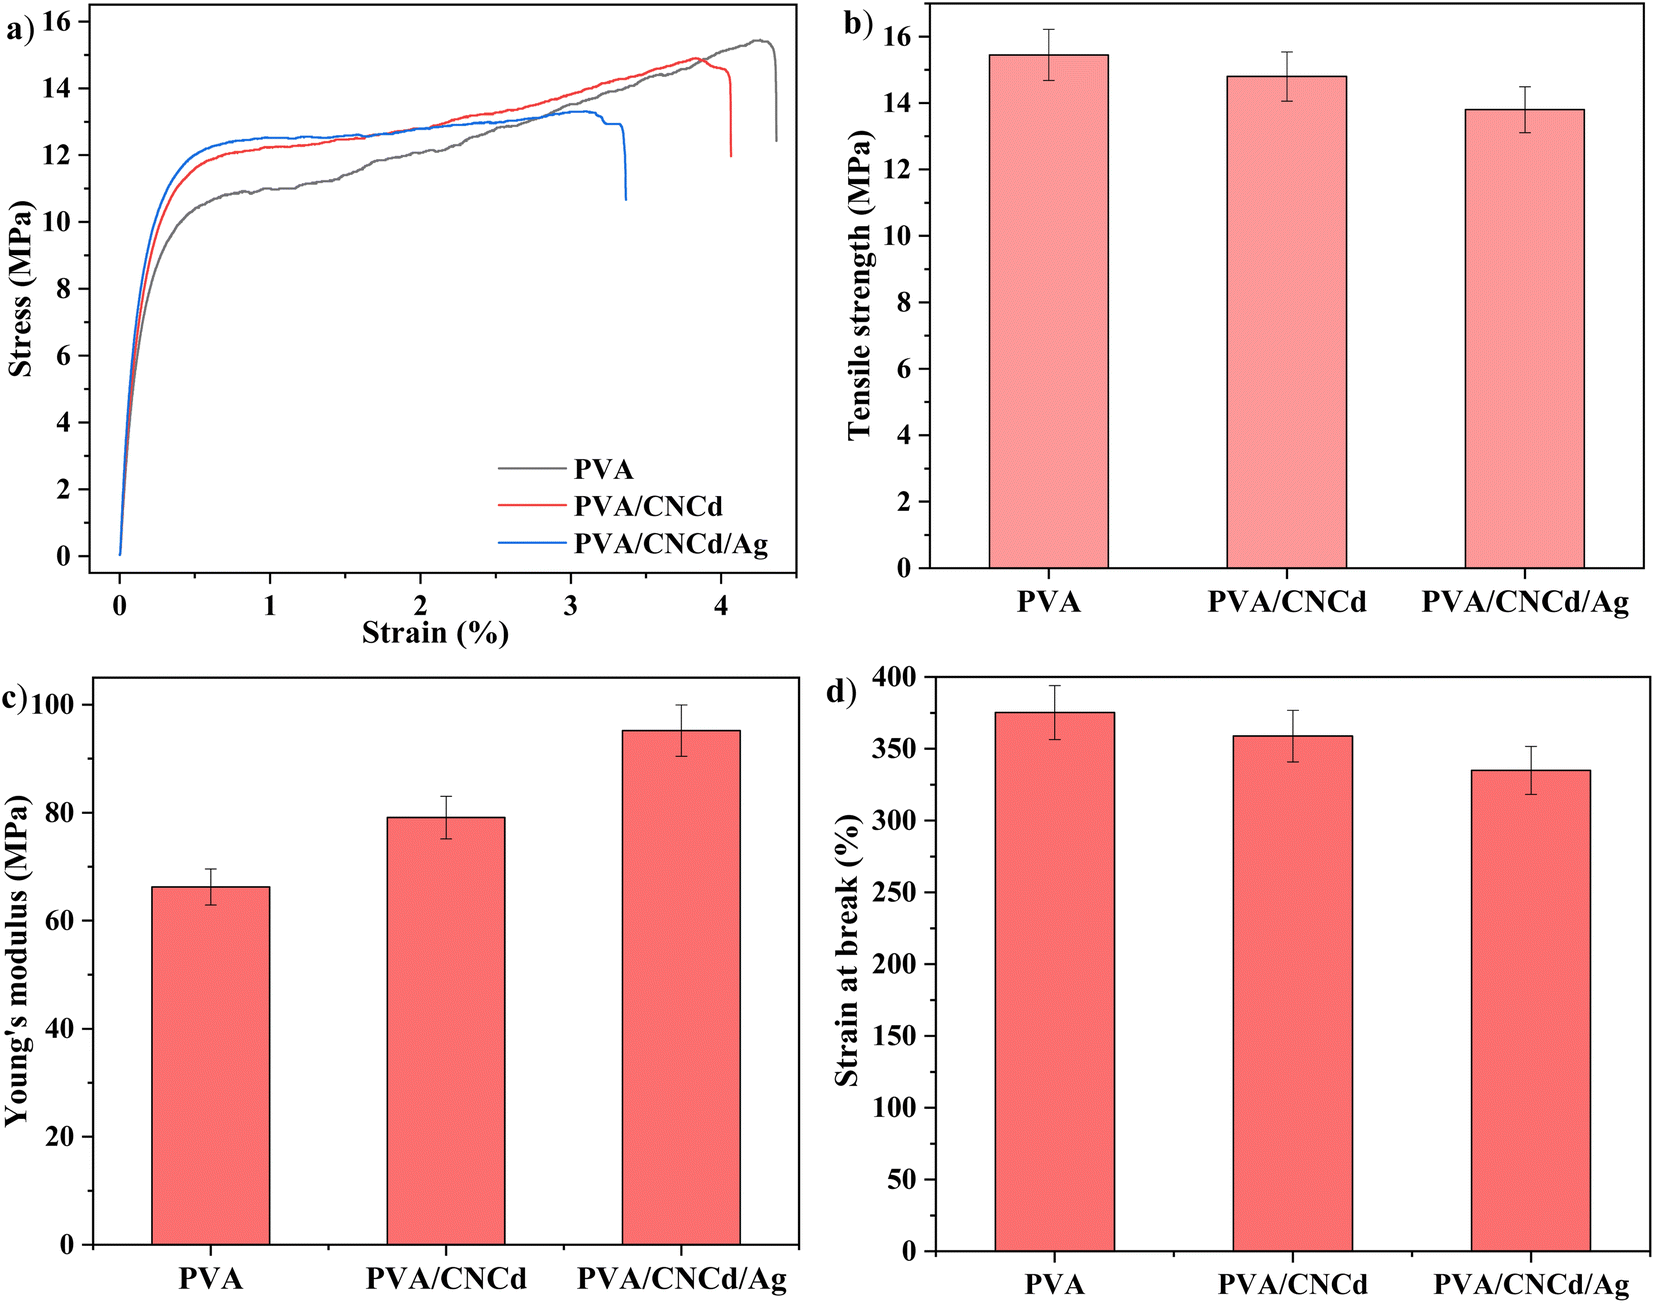 | ||
| Fig. 10 (a) Stress–strain curves, (b) tensile strength, (c) Young's modulus, and (d) strain at break of prepared films. Values that share at least one common letter are not significantly different (p < 0.05). | ||
The tensile strength and elongation of the PVA/CNCd and PVA/CNCd/Ag films decreased in the presence of the CNCd and CNCd/Ag reinforced phases, while the Young modulus increased. In order to absorb mechanical energy, these reinforcement phases were disseminated throughout the polymer matrix. Fig. 10 demonstrated that the PVA/CNCd/Ag modulus was 1.38 times that of pure PVA. However, CNC and CNCd/Ag were dispersed in the PVA matrix, making the PVA chains less flexible, making it difficult to rotate the configuration, creating obstacles for the polymer chain, making the polymer chain simple to break, and resulting in a decrease in tensile strength and elongation at break.
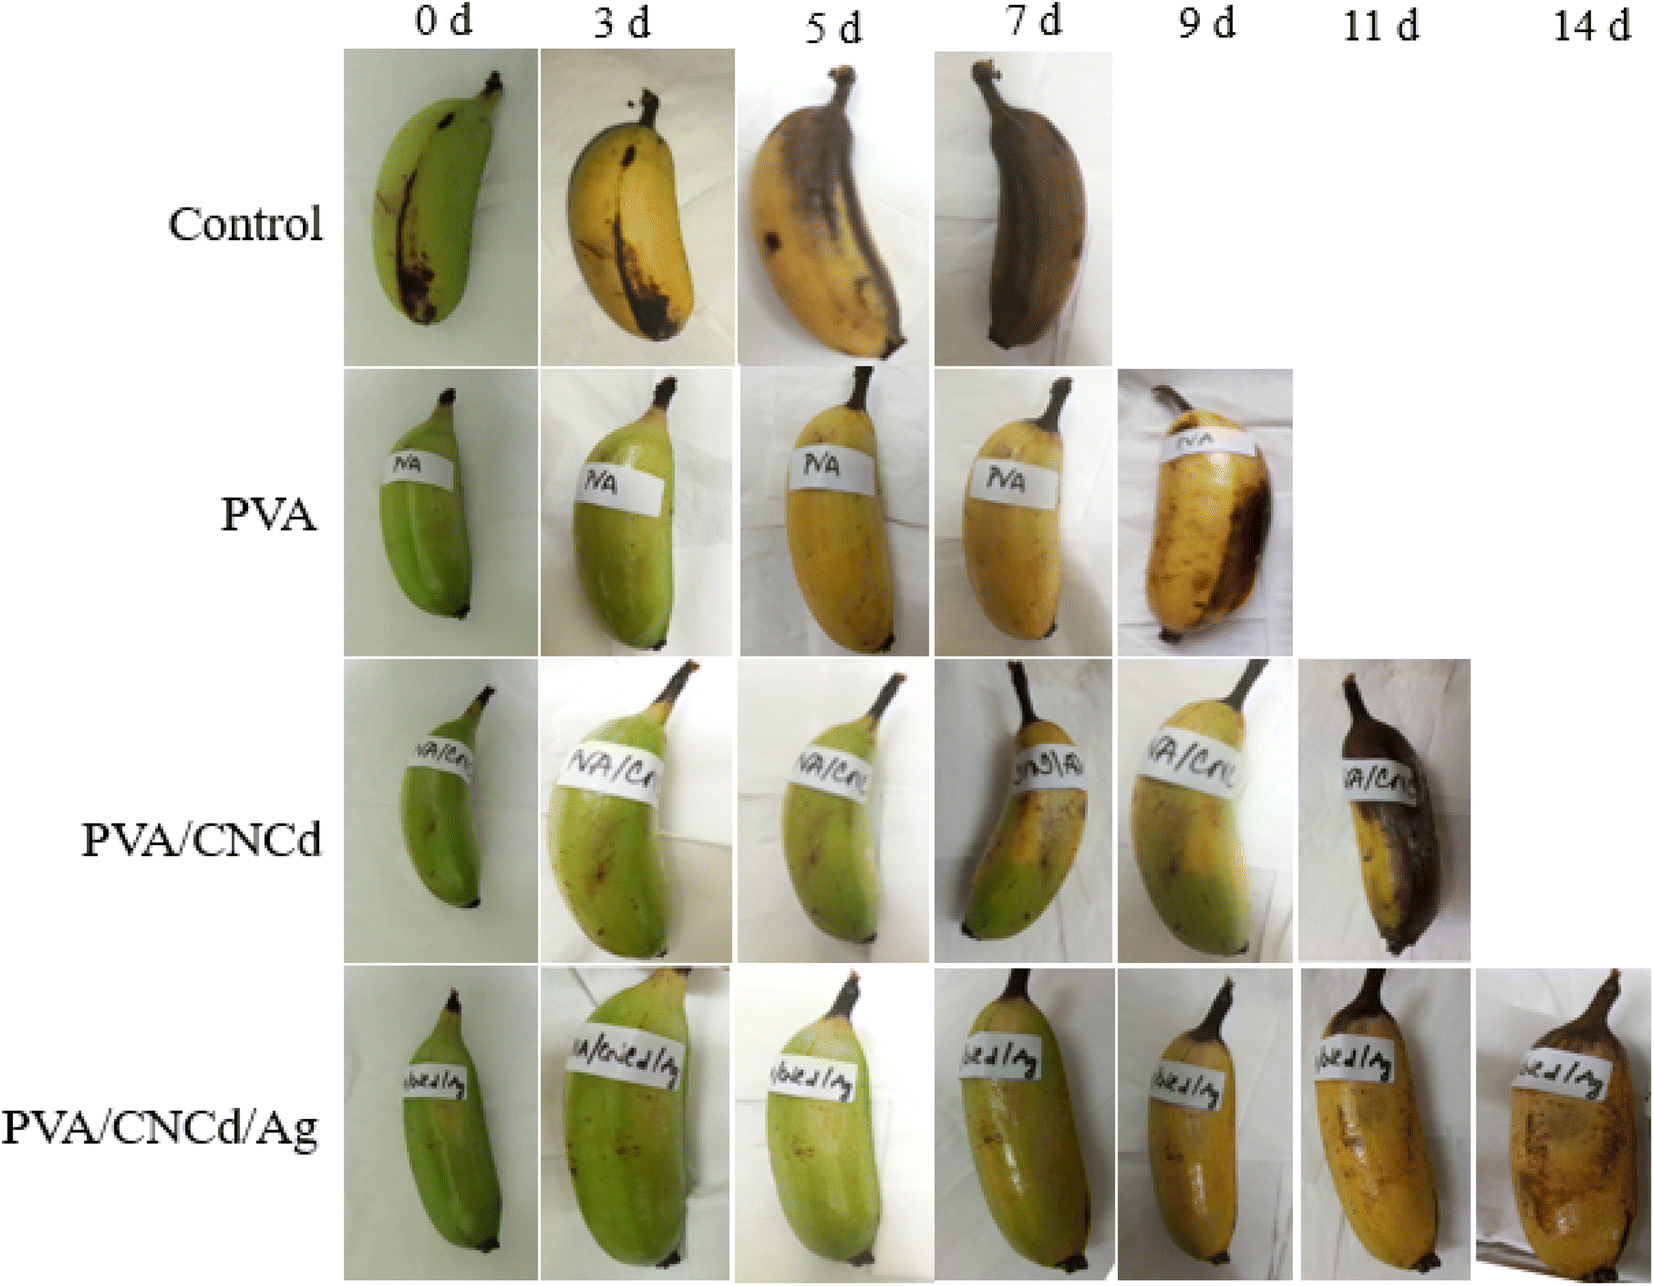 | ||
| Fig. 11 Changes in appearance of bananas on different days (0, 3, 5, 7, 9, 11, and 14 days). | ||
In contrast, the PVA/CNCd sample displayed indications of wilting and incomplete ripening (yellow coloration accompanied by green patches). The PVA/CNCd/Ag-coated samples matured, evolved a yellow hue, and remained unblemished. On the eleventh day of observation, bananas coated with PVA/CNCd exhibited darkening symptoms. In contrast, those coated with PVA/CNCd/Ag maintained their yellow coloration and did not undergo wilting or darkening. On day fourteen, the PVA/CNCd/Ag sample remained the only one under observation, indicating that it had matured; however, the fruit began to develop bruises.
On day fourteen, the final sample was observed; however, indications of darkening prompted the cessation of the observation and the addition of additional fruit. The control sample was utterly degraded, and the banana meat turned dark after seven days of storage. In contrast, PVA/CNCd/Ag preserved bananas for fourteen days, and the banana meat remained utterly ordinary.
The observed outcomes were accounted for by inhibiting the banana's metabolism caused by the PVA coating, which slowed the maturation process compared to uncoated samples. Incorporating the dispersed phase CNCd into the PVA structure resulted in the partial filling of the voids with CNCd, which aided in inhibiting the metabolic process and slowed the maturation of fruits coated with PVA/CNCd.75–78 In contrast, the fruit was preserved for a maximum of fourteen days with the PVA/CNCd/Ag coating due to the antibacterial and antifungal properties of CNCd/Ag, which prevented fruit damage and enhanced the presence of a dispersed phase that impeded the exchange of gases and substances between the fruit and its surroundings, thereby extending the fruit's preservation time.
4. Conclusion
For this study, silver (Ag) was loaded onto a deprotonated CNC carrier (CNCd) and utilized as a strengthening component for polyvinyl alcohol (PVA) in the production of PVA/CNCd/Ag biocomposite film. The results showed a uniform distribution of Ag nanoparticles measuring around 100 nm in diameter on the surface of CNCd. The addition of CNCd/Ag in the PVA matrix phase resulted in significant changes to the thermal stability, optical properties, and mechanical properties of the PVA/CNCd/Ag film compared to the pure PVA film. The composite film made from PVA, CNCd, and Ag can slow down the decay of bananas and extend their shelf life. These findings imply that while the PVA/CNCd/Ag film contributes to the preservation and extension of the shelf-life of food, additional characteristics of the film, such as water vapor transmission rate, moisture retention capability, and antimicrobial efficacy, must be thoroughly evaluated prior to the utilization of the films produced at varied ingredient proportions for food packaging. Furthermore, further safety considerations regarding the released Ag NPs must be considered when employing them as direct materials for food packaging.Data availability
Data will be made available on request.Author contributions
Long Hoang Nguyen: investigation, writing – original draft preparation. Trang Thanh Tran: formal analysis. Thanh-My T. Nguyen: formal analysis. Kim-Phung L. Nguyen: resources. Hieu Van Le: writing – review & editing. An Nang Vu: conceptualization, validation, supervision.Conflicts of interest
The authors report no declarations of interest.Acknowledgements
This research is funded by the University of Science, Vietnam National University Ho Chi Minh City (US, VNU-HCM) under grant number T2022-77. The authors are grateful for this financial support.References
- L. K. Ncube, A. U. Ude, E. N. Ogunmuyiwa, R. Zulkifli and I. N. Beas, Materials, 2020, 13, 4994 CrossRef CAS PubMed.
- M. Rabnawaz, I. Wyman, R. Auras and S. Cheng, Green Chem., 2017, 19, 4737–4753 RSC.
- K. Marsh and B. Bugusu, J. Food Sci., 2007, 72, R39–R55 CrossRef CAS PubMed.
- J. Throup, J. B. G. Martínez, B. Bals, J. Cates, J. M. Pearce and D. C. Denkenberger, Food Bioprod. Process., 2022, 131, 22–39 CrossRef CAS.
- A. Chamas, H. Moon, J. Zheng, Y. Qiu, T. Tabassum, J. H. Jang, M. Abu-Omar, S. L. Scott and S. Suh, ACS Sustain. Chem. Eng., 2020, 8, 3494–3511 CrossRef CAS.
- A. Fonseca-García, E. J. Jiménez-Regalado and R. Y. Aguirre-Loredo, Carbohydr. Polym., 2021, 251, 117009 CrossRef PubMed.
- H. Yu, C. Yan and J. Yao, RSC Adv., 2014, 4, 59792–59802 RSC.
- E. O. Ogunsona and T. H. Mekonnen, J. Colloid Interface Sci., 2020, 580, 56–67 CrossRef CAS PubMed.
- S. V. Nguyen and B.-K. Lee, Mater. Lett., 2022, 307, 131045 CrossRef CAS.
- Y. Zhang and L. Ye, Composites, Part B, 2014, 56, 749–755 CrossRef CAS.
- F.-P. Du, E.-Z. Ye, W. Yang, T.-H. Shen, C.-Y. Tang, X.-L. Xie, X.-P. Zhou and W.-C. Law, Composites, Part B, 2015, 68, 170–175 CrossRef CAS.
- X. Gong, C. Y. Tang, L. Pan, Z. Hao and C. P. Tsui, Composites, Part B, 2014, 60, 144–149 CrossRef CAS.
- H. Risite, M. H. Salim, B. T. Oudinot, E.-h. Ablouh, H. T. Joyeux, H. Sehaqui, J. H. A. Razafimahatratra, A. E. K. Qaiss, M. El Achaby and Z. Kassab, Waste Biomass Valorization, 2022, 13, 2411–2423 CrossRef CAS PubMed.
- S. Van Nguyen and B.-K. Lee, Cellulose, 2021, 28, 5693–5705 CrossRef CAS.
- N. A. El-Wakil, E. A. Hassan, R. E. Abou-Zeid and A. Dufresne, Carbohydr. Polym., 2015, 124, 337–346 CrossRef CAS PubMed.
- H. E. Salama and M. S. Abdel Aziz, Int. J. Biol. Macromol., 2020, 165, 1187–1197 CrossRef CAS PubMed.
- Y.-S. Park, F. Sammartino, N. A. Young, J. Corrigan, V. Krishna and A. R. Rezai, World Neurosurg., 2019, 126, 1–10 CrossRef PubMed.
- M.-C. Popescu, B.-I. Dogaru, M. Goanta and D. Timpu, Int. J. Biol. Macromol., 2018, 116, 385–393 CrossRef CAS PubMed.
- H. Bai, Z. Liang, D. Wang, J. Guo, S. Zhang, P. Ma and W. Dong, Compos. Sci. Technol., 2020, 199, 108338 CrossRef CAS.
- A. L. S. Pereira, D. M. d. Nascimento, M. d. s. M. Souza Filho, J. P. S. Morais, N. F. Vasconcelos, J. P. A. Feitosa, A. I. S. Brígida and M. d. F. Rosa, Carbohydr. Polym., 2014, 112, 165–172 CrossRef CAS PubMed.
- K. R. Srivastava, S. Dixit, D. B. Pal, P. K. Mishra, P. Srivastava, N. Srivastava, A. Hashem, A. A. Alqarawi and E. F. Abd_Allah, Environ. Technol. Innovation, 2021, 21, 101312 CrossRef CAS.
- Z. Zhang, X. Liu, H. Wang, H. He and R. Bai, Polym. Compos., 2021, 42, 1712–1726 CrossRef CAS.
- H. Yu, B. Sun, D. Zhang, G. Chen, X. Yang and J. Yao, J. Mater. Chem. B, 2014, 2, 8479–8489 RSC.
- A. Salam, L. A. Lucia and H. Jameel, ACS Sustain. Chem. Eng., 2013, 1, 1584–1592 CrossRef CAS.
- J. Araki, M. Wada and S. Kuga, Langmuir, 2001, 17, 21–27 CrossRef CAS.
- J. Hu, Z. Kong, K. Liu, J. Qin, Y. Tao, L. Zhou, Y. Yuan, M. Jiang, Y. Duan and J. Zhang, ACS Appl. Polym. Mater., 2021, 3, 6120–6129 CrossRef CAS.
- G. Delepierre, O. M. Vanderfleet, E. Niinivaara, B. Zakani and E. D. Cranston, Langmuir, 2021, 37, 8393–8409 CrossRef CAS PubMed.
- O. M. Vanderfleet, F. D'Acierno, A. Isogai, M. J. MacLachlan, C. A. Michal and E. D. Cranston, Chem. Mater., 2022, 34, 8248–8261 CrossRef CAS.
- D. Yang, L. Gong, Q. Li, B. Fan, C. Ma and Y.-C. He, Int. J. Biol. Macromol., 2023, 227, 524–534 CrossRef CAS PubMed.
- L. Meng, J. Li, X. Fan, Y. Wang, Z. Xiao, H. Wang, D. Liang and Y. Xie, Compos. Sci. Technol., 2023, 232, 109885 CrossRef CAS.
- Z. Zhang, Y.-C. He and Y. Liu, Int. J. Biol. Macromol., 2023, 248, 125804 CrossRef CAS PubMed.
- S. Adepu and M. Khandelwal, J. Mater. Sci., 2018, 53, 1596–1609 CrossRef CAS.
- H. Huang, L. Mao, Z. Li, Y. Liu, S. Fan, Y. Jin and J. Xie, J. Bioresour. Bioprod., 2019, 4, 231–241 CAS.
- C. Amara, A. El Mahdi, R. Medimagh and K. Khwaldia, Curr. Opin. Green Sustainable Chem., 2021, 31, 100512 CrossRef CAS.
- N. Omerović, M. Djisalov, K. Živojević, M. Mladenović, J. Vunduk, I. Milenković, N. Ž. Knežević, I. Gadjanski and J. Vidić, Compr. Rev. Food Sci. Food Saf., 2021, 20, 2428–2454 CrossRef PubMed.
- P. Zhang, C. Shao, Z. Zhang, M. Zhang, J. Mu, Z. Guo and Y. Liu, Nanoscale, 2011, 3, 3357–3363 RSC.
- S. A. Ogundare and W. E. van Zyl, Surf. Interfaces, 2018, 13, 1–10 CrossRef CAS.
- H. M. C. Azeredo, M. F. Rosa and L. H. C. Mattoso, Ind. Crops Prod., 2017, 97, 664–671 CrossRef CAS.
- M. S. Wang, F. Jiang, Y. L. Hsieh and N. Nitin, J. Mater. Chem. B, 2014, 2, 6226–6235 RSC.
- Z. Shi, J. Tang, L. Chen, C. Yan, S. Tanvir, W. A. Anderson, R. M. Berry and K. C. Tam, J. Mater. Chem. B, 2015, 3, 603–611 RSC.
- S. Ifuku, M. Tsuji, M. Morimoto, H. Saimoto and H. Yano, Biomacromolecules, 2009, 10, 2714–2717 CrossRef CAS PubMed.
- N. Drogat, R. Granet, V. Sol, A. Memmi, N. Saad, C. Klein Koerkamp, P. Bressollier and P. Krausz, J. Nanopart. Res., 2011, 13, 1557–1562 CrossRef CAS.
- K. M. A. Uddin, A. R. Lokanathan, A. Liljeström, X. Chen, O. J. Rojas and J. Laine, Green Mater., 2014, 2, 183–192 CrossRef.
- D. Pawcenis, D. K. Chlebda, R. J. Jędrzejczyk, M. Leśniak, M. Sitarz and J. Łojewska, Eur. Polym. J., 2019, 116, 242–255 CrossRef CAS.
- Z. Hosseinidoust, M. Basnet, T. G. M. van de Ven and N. Tufenkji, Environ. Sci.: Nano, 2016, 3, 1259–1264 RSC.
- X. Zhang, H. Sun, S. Tan, J. Gao, Y. Fu and Z. Liu, Inorg. Chem. Commun., 2019, 100, 44–50 CrossRef CAS.
- B. F. Gonçalves, J. Oliveira, P. Costa, V. Correia, P. Martins, G. Botelho and S. Lanceros-Mendez, Composites, Part B, 2017, 112, 344–352 CrossRef.
- H. Ahmad, Cellulose, 2021, 28, 2715–2761 CrossRef CAS.
- H. Yu, S. Y. H. Abdalkarim, H. Zhang, C. Wang and K. C. Tam, ACS Sustain. Chem. Eng., 2019, 7, 4912–4923 CrossRef CAS.
- L. Xing, J. Gu, W. Zhang, D. Tu and C. Hu, Carbohydr. Polym., 2018, 192, 184–192 CrossRef CAS PubMed.
- O. Romruen, T. Karbowiak, W. Tongdeesoontorn, K. Shiekh and S. Rawdkuen, Polymers, 2022, 14, 1830 CrossRef CAS PubMed.
- H.-Y. Yu, D.-Z. Zhang, F.-F. Lu and J. Yao, ACS Sustain. Chem. Eng., 2016, 4, 2632–2643 CrossRef CAS.
- F. Abd El-kader, N. Hakeem, W. Osman, A. Anter and A. Abdelghany, Silicon, 2019, 11, 377–381 CrossRef CAS.
- S. M. K. Thiagamani, N. Rajini, S. Siengchin, A. Varada Rajulu, N. Hariram and N. Ayrilmis, Composites, Part B, 2019, 165, 516–525 CrossRef CAS.
- M. Kishanji, G. Mamatha, K. Obi Reddy, A. Varada Rajulu and K. Madhukar, Int. J. Polym. Anal. Charact., 2017, 22, 734–740 CrossRef CAS.
- S. Y. Oh, D. I. Yoo, Y. Shin, H. C. Kim, H. Y. Kim, Y. S. Chung, W. H. Park and J. H. Youk, Carbohydr. Res., 2005, 340, 2376–2391 CrossRef CAS PubMed.
- W. P. Flauzino Neto, J.-L. Putaux, M. Mariano, Y. Ogawa, H. Otaguro, D. Pasquini and A. Dufresne, RSC Adv., 2016, 6, 76017–76027 RSC.
- J. Wang, Q. Wang, Y. Wu, F. Bai, H. Wang, S. Si, Y. Lu, X. Li and S. Wang, Nanomaterials, 2020, 10, 2227 CrossRef CAS PubMed.
- H. Yu, S. Y. H. Abdalkarim, H. Zhang, C. Wang and K. C. Tam, ACS Sustain. Chem. Eng., 2019, 7, 4912–4923 CrossRef CAS.
- L. A. Worku, M. G. Tadesse, R. K. Bachheti, A. Bachheti and A. Husen, Int. J. Biol. Macromol., 2024, 267, 131228 CrossRef CAS PubMed.
- X. Cui, T. Honda, T.-A. Asoh and H. Uyama, Carbohydr. Polym., 2020, 230, 115662 CrossRef CAS PubMed.
- M. Wang, S. Zhang, X. Liu, Y. Ma and J. Wang, Ind. Crops Prod., 2023, 201, 116925 CrossRef CAS.
- H. Fukuzumi, T. Saito, Y. Okita and A. Isogai, Polym. Degrad. Stab., 2010, 95, 1502–1508 CrossRef CAS.
- O. M. Vanderfleet, M. S. Reid, J. Bras, L. Heux, J. Godoy-Vargas, M. K. R. Panga and E. D. Cranston, Cellulose, 2019, 26, 507–528 CrossRef CAS.
- D. de Britto and O. B. Assis, Thermochim. Acta, 2009, 494, 115–122 CrossRef CAS.
- E. Fortunati, D. Puglia, M. Monti, C. Santulli, M. Maniruzzaman and J. M. Kenny, J. Appl. Polym. Sci., 2013, 128, 3220–3230 CrossRef CAS.
- S. B. Aziz, A. S. Marf, E. M. Dannoun, M. A. Brza and R. M. Abdullah, Polymers n.d., 2020, 12, 2184 CrossRef CAS PubMed.
- H. Afzal, F. Shehzad, M. Zubair, O. Bakather and M. Al-Harthi, J. Therm. Anal. Calorim., 2019, 139, 353–365 CrossRef.
- T. Gasti, V. D. Hiremani, S. S. Kesti, V. N. Vanjeri, N. Goudar, S. P. Masti, S. C. Thimmappa and R. B. Chougale, J. Polym. Environ., 2021, 29, 3347–3363 CrossRef CAS.
- N. Rescignano, E. Fortunati, S. Montesano, C. Emiliani, J. M. Kenny, S. Martino and I. Armentano, Carbohydr. Polym., 2014, 99, 47–58 CrossRef CAS PubMed.
- H. Abral, A. Atmajaya, M. Mahardika, F. Hafizulhaq, D. Handayani, S. Sapuan and R. Ilyas, J. Mater. Res. Technol., 2020, 9, 2477–2486 CrossRef CAS.
- G. Rajesha Shetty and B. Lakshmeesha Rao, Mater. Today: Proc., 2022, 55, 194–200 CAS.
- W. Yang, X. He, F. Luzi, W. Dong, T. Zheng, J. M. Kenny, D. Puglia and P. Ma, Int. J. Biol. Macromol., 2020, 161, 617–626 CrossRef CAS PubMed.
- K. Dejen, E. Zereffa, H. C. A. Murthy and A. Merga, Rev. Adv. Mater. Sci., 2020, 59, 464–476 CAS.
- G. Fotie, S. Limbo and L. Piergiovanni, Nanomaterials, 2020, 10, 1726 CrossRef CAS PubMed.
- G. Fotie, R. Rampazzo, M. A. Ortenzi, S. Checchia, D. Fessas and L. Piergiovanni, Polymers, 2017, 9, 415 CrossRef PubMed.
- J. Wang, D. J. Gardner, N. M. Stark, D. W. Bousfield, M. Tajvidi and Z. Cai, ACS Sustain. Chem. Eng., 2018, 6, 49–70 CrossRef CAS.
- C. Aulin, M. Gällstedt and T. Lindström, Cellulose, 2010, 17, 559–574 CrossRef CAS.
Footnote |
| † Electronic supplementary information (ESI) available. See DOI: https://doi.org/10.1039/d4ra02085e |
| This journal is © The Royal Society of Chemistry 2024 |