 Open Access Article
Innovative use of liquid crystalline acids as color developers in leuco dye-based temperature sensors†
J. Pawłów‡
 ab,
M. Wilk-Kozubek‡
 a,
M. Czajkowski
 a,
M. Zdończyk
 ab and
J. Cybińska
 *ab
*ab
aMaterials Science and Engineering Center, Łukasiewicz Research Network – PORT Polish Center for Technology Development, 147 Stabłowicka Street, 54-066 Wrocław, Poland. E-mail: Joanna.Cybinska@port.lukasiewicz.gov.pl
bFaculty of Chemistry, University of Wrocław, 14 F. Joliot-Curie Street, 50-383 Wrocław, Poland
First published on 11th June 2024
Abstract
Novel temperature sensors with unique optical properties, based on 4-alkylbenzoic acid developers (CnBA, where n is the number of carbon atoms in the alkyl chain ranging from 4 to 6), which exhibit a liquid crystalline phase, and 6′-(diethylamino)-1′,2′-benzofluoran (BF) leuco dye are reported. The main aim of this work is to investigate how the molecular packing of CnBA in different phases affects the development of BF. Various techniques were used to study the prepared temperature sensors' phase transitions and thermal stability. The spectroscopic properties of BF![[thin space (1/6-em)]](https://www.rsc.org/images/entities/char_2009.gif) :
:![[thin space (1/6-em)]](https://www.rsc.org/images/entities/char_2009.gif) CnBA (1
CnBA (1![[thin space (1/6-em)]](https://www.rsc.org/images/entities/char_2009.gif) :
:![[thin space (1/6-em)]](https://www.rsc.org/images/entities/char_2009.gif) 3) were investigated, using temperature-dependent UV-Vis absorption and emission spectroscopy, and the results show that the sensors demonstrate reversible color-changing properties. When the CnBA developers are at room temperature, the materials are pink and emit orange light, while at approximately 105 °C they turn white and emit yellow light. Above that temperature, the sensors return to a pink and orange light emission. Therefore the prepared materials can serve as indicators that inform about not only exceeding a certain temperature threshold but also reaching temperature ranges.
3) were investigated, using temperature-dependent UV-Vis absorption and emission spectroscopy, and the results show that the sensors demonstrate reversible color-changing properties. When the CnBA developers are at room temperature, the materials are pink and emit orange light, while at approximately 105 °C they turn white and emit yellow light. Above that temperature, the sensors return to a pink and orange light emission. Therefore the prepared materials can serve as indicators that inform about not only exceeding a certain temperature threshold but also reaching temperature ranges.
1. Introduction
In the dynamically evolving world of science and technology, exploring innovative materials with unique sensing properties is emerging as a research priority. One particularly intriguing area is the development of thermochromic materials. These materials find application in formulating temperature-sensitive compositions that serve as visual sensors in various industrial sectors.1–4 Examples include monitoring temperature changes in chemical processes, measuring temperature distribution in chemical heating devices such as heat exchangers and reactors, and indicating temperature fluctuations in containers for hazardous chemicals.5,6The components of temperature sensors often consist of thermochromic liquid crystals (TLCs). They exhibit different colors depending on their molecular arrangement, which alters with temperature.7,8 Sensors based on TLCs offer many advantages, such as a wide working temperature range, high-temperature sensitivity, and a broad spectrum of colors.9 They can operate within a temperature range of −30 °C to 150 °C, demonstrating sensitivity to changes as small as 0.5 °C.10 As the temperature increases, the color of TLCs changes from non-reflective (black) to spectral colors, ranging from red-orange at lower temperature to blue-violet at higher temperature, before returning to black.11 Unfortunately, due to their low color density, TLCs require application on a black background to maximize their visual effect. The high cost of TLCs further prompts the exploration of materials with higher color intensity to provide more cost-effective solutions.
An alternative to TLCs is the utilization of thermochromic organic materials (TOMs). Their color depends on the molecular structure of their components, which change with temperature.12 In comparison to TLCs, TOMs provide several advantages, such as a lower cost and a wider working temperature range. Color changes in TOMs occur within the temperature range of −100 °C to 200 °C.13 Additionally, the colors generated by TOMs are intensive, but they only convey information about exceeding a specific temperature threshold. In the case of two-component materials, comprising a leuco dye and a developer, the color change occurs after the developer melts.14–17 Apart from determining the temperature that triggers the color change, the developer also influences the intensity of the color. Numerous studies in the literature investigate the incorporation of a third component into the TOMs, often a polar solvent.18–20 In such instances, the temperature at which the color change takes place is related to the melting of the solvent.
Overall, currently used TOMs provide information regarding the overheating of the monitored system. Nevertheless, in industrial applications, it is crucial to determine the optimal working temperature range. For instance, the placement of appropriate sensors on plastic extruders can be beneficial in assessing whether the feeding temperature aligns with the processing requirements.21 Therefore, this study focuses on the development of TOMs capable of indicating the optimal temperature range. Previous efforts in this direction were made by Tsutsui and co-workers who successfully synthesized a two-component system using 2′-(2-chloroanilino)-6′-(dibutylamino)fluoran as a leuco dye and octadecylphosphonic acid as a developer.22 This system exhibited a colored state at room temperature and decolorized upon heating at 63–67 °C. Further heating restored the colored state at a temperature exceeding approximately 90 °C. Unfortunately, this process was not achievable during cooling. Rapid cooling maintained the system in the colored state, while slow cooling led to discoloration of the system. The created system allowed for determining the temperature range from 63–67 °C to 90 °C, but only during heating. X-ray diffraction analysis revealed that the colored state induced by rapid cooling maintained a lamellar structure formed by the complexation of octadecylphosphonic acid with fluoran dye in a 7![[thin space (1/6-em)]](https://www.rsc.org/images/entities/char_2009.gif) :
:![[thin space (1/6-em)]](https://www.rsc.org/images/entities/char_2009.gif) 1 molar ratio. In contrast, the discolored state resulting from slow cooling was attributed to the fractional crystallization of octadecylphosphonic acid, inhibiting the dye's protonation. This investigation underscores the significance of molecular packing in TOMs and motivates us to explore other systems.
1 molar ratio. In contrast, the discolored state resulting from slow cooling was attributed to the fractional crystallization of octadecylphosphonic acid, inhibiting the dye's protonation. This investigation underscores the significance of molecular packing in TOMs and motivates us to explore other systems.
For this purpose, we chose 6′-(diethylamino)-1′,2′-benzofluoran (BF) as a leuco dye, and 4-alkylbenzoic acids (CnBA, where n is the number of carbon atoms in the alkyl chain ranging from 4 to 6) as color developers. It is known that some carboxylic acids, such as 4-butylbenzoic acid, characterized by an elongated structure, exhibit a nematic phase stabilized by hydrogen-bonded dimers between acid molecules.23 This implies that the protons needed for leuco dye development are not accessible in the temperature range corresponding to the occurrence of the nematic phase. Temperature sensors designed in this way could be capable of detecting three different temperature ranges, allowing them to identify the optimal temperature range through its discoloration. In contrast, commonly used thermochromic sensors based on leuco dye developer systems can only detect two temperature ranges.
2. Experimental part
2.1 Materials
6′-(Diethylamino)-1′,2′-benzofluoran (BF) (>98.0%), 4-butylbenzoic acid (C4BA) (>98.0%) and 4-pentylbenzoic acid (C5BA) (>98.0%) were purchased from TCI. 4-Hexylbenzoic acid (C6BA) (99%) was acquired from Alfa Aesar. N, N-dimethylformamide (DMF), and n-hexane were supplied by Carlo Erba Reagents and Merck, respectively. All reagents were used as received without further purification.2.2 Preparation of thermochromic materials
Fluoran-based materials with 4-alkylbenzoic acids were prepared by mixing solid BF leuco dye and the appropriate solid CnBA acid developer (where n = 4, 5, and 6) in a molar ratio of 1![[thin space (1/6-em)]](https://www.rsc.org/images/entities/char_2009.gif) :
:![[thin space (1/6-em)]](https://www.rsc.org/images/entities/char_2009.gif) 3. The substrate mixture on a quartz glass slide was then heated to 105 °C on a hotplate to allow the CnBA developer to melt. Once the CnBA developer had melted, the BF leuco dye was evenly distributed throughout its volume using a spatula. The obtained material was then removed from the hotplate and placed on a metal block to rapidly cool it to approximately 20 °C, thereby allowing the CnBA developer to crystallize. To ensure the uniform distribution of the BF leuco dye within the volume of the CnBA developer, heating and cooling cycles were repeated three times.
3. The substrate mixture on a quartz glass slide was then heated to 105 °C on a hotplate to allow the CnBA developer to melt. Once the CnBA developer had melted, the BF leuco dye was evenly distributed throughout its volume using a spatula. The obtained material was then removed from the hotplate and placed on a metal block to rapidly cool it to approximately 20 °C, thereby allowing the CnBA developer to crystallize. To ensure the uniform distribution of the BF leuco dye within the volume of the CnBA developer, heating and cooling cycles were repeated three times.
Temperature sensor laminates were fabricated by sandwiching solid substrates – BF leuco dye and CnBA developer – between coverslips and encasing them in a 200-micron-thick polyethylene terephthalate (PET) film. These laminates were then subjected to a hotplate heated to 105 °C to ensure complete melting of the CnBA developer, followed by rapid cooling to room temperature. This process was iterated three times for optimal results.
2.3 Apparatus
![[thin space (1/6-em)]](https://www.rsc.org/images/entities/char_2009.gif) :
:![[thin space (1/6-em)]](https://www.rsc.org/images/entities/char_2009.gif) C4BA (1
C4BA (1![[thin space (1/6-em)]](https://www.rsc.org/images/entities/char_2009.gif) :
:![[thin space (1/6-em)]](https://www.rsc.org/images/entities/char_2009.gif) 3 ratio) and 25, 105 and 155 °C for BF
3 ratio) and 25, 105 and 155 °C for BF![[thin space (1/6-em)]](https://www.rsc.org/images/entities/char_2009.gif) :
:![[thin space (1/6-em)]](https://www.rsc.org/images/entities/char_2009.gif) C5BA (1
C5BA (1![[thin space (1/6-em)]](https://www.rsc.org/images/entities/char_2009.gif) :
:![[thin space (1/6-em)]](https://www.rsc.org/images/entities/char_2009.gif) 3 ratio) and BF
3 ratio) and BF![[thin space (1/6-em)]](https://www.rsc.org/images/entities/char_2009.gif) :
:![[thin space (1/6-em)]](https://www.rsc.org/images/entities/char_2009.gif) C6BA (1
C6BA (1![[thin space (1/6-em)]](https://www.rsc.org/images/entities/char_2009.gif) :
:![[thin space (1/6-em)]](https://www.rsc.org/images/entities/char_2009.gif) 3 ratio).
3 ratio).![[thin space (1/6-em)]](https://www.rsc.org/images/entities/char_2009.gif) :
:![[thin space (1/6-em)]](https://www.rsc.org/images/entities/char_2009.gif) C4BA (1
C4BA (1![[thin space (1/6-em)]](https://www.rsc.org/images/entities/char_2009.gif) :
:![[thin space (1/6-em)]](https://www.rsc.org/images/entities/char_2009.gif) 3 ratio) and 25, 105 and 155 °C for BF
3 ratio) and 25, 105 and 155 °C for BF![[thin space (1/6-em)]](https://www.rsc.org/images/entities/char_2009.gif) :
:![[thin space (1/6-em)]](https://www.rsc.org/images/entities/char_2009.gif) C5BA (1
C5BA (1![[thin space (1/6-em)]](https://www.rsc.org/images/entities/char_2009.gif) :
:![[thin space (1/6-em)]](https://www.rsc.org/images/entities/char_2009.gif) 3 ratio) and BF
3 ratio) and BF![[thin space (1/6-em)]](https://www.rsc.org/images/entities/char_2009.gif) :
:![[thin space (1/6-em)]](https://www.rsc.org/images/entities/char_2009.gif) C6BA (1
C6BA (1![[thin space (1/6-em)]](https://www.rsc.org/images/entities/char_2009.gif) :
:![[thin space (1/6-em)]](https://www.rsc.org/images/entities/char_2009.gif) 3 ratio).
3 ratio).3. Results and discussion
3.1 Single crystal structure of the BF leuco dye
Although thermochromic systems incorporating BF leuco dye have been studied since the late 1960s, the crystal structure of BF itself has remained unknown.29,30 The application of the slow solvent diffusion technique using n-hexane/DMF solution allowed us to obtain a colorless BF crystal suitable for X-ray diffraction analysis. Structural analysis revealed that BF crystallizes in the orthorhombic Pbca space group, with one molecule in the asymmetric part of the unit cell (Fig. 1). The BF molecule consists of two nearly planar spiro-linked components, namely the benzoxanthene moiety and the phthalide group. These components are perpendicular, forming a dihedral angle of 88.68(1)°. The C–O bond length in the five-membered lactone ring is 1.495(1) Å, comparable to those observed in related simple fluorans.31–33 Upon reaction with an acidic substrate such as CnBA developer, the C–O bond in the lactone ring ruptures, leading to the open form of the BF molecule and a simultaneous color change to pink.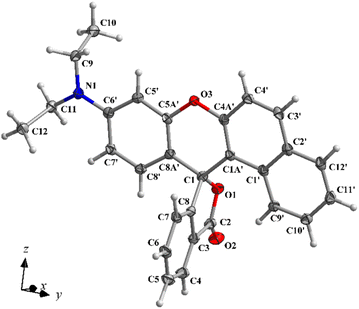 | ||
| Fig. 1 The asymmetric part of the unit cell of BF leuco dye, showing the atom-labelling scheme. The displacement ellipsoids are drawn at the 50% probability level. | ||
3.2 Optimization and preparation of thermochromic materials
Materials based on the BF and the CnBA were prepared in three series of several samples with various molar ratios of leuco dye to the developer, ranging from 1![[thin space (1/6-em)]](https://www.rsc.org/images/entities/char_2009.gif) :
:![[thin space (1/6-em)]](https://www.rsc.org/images/entities/char_2009.gif) 1 to 1
1 to 1![[thin space (1/6-em)]](https://www.rsc.org/images/entities/char_2009.gif) :
:![[thin space (1/6-em)]](https://www.rsc.org/images/entities/char_2009.gif) 9. Irrespective of the employed ratio, the prepared sensors demonstrated a notable color transition behavior: starting from pink at room temperature, shifting to white at approximately 105 °C, and reverting to pink above that temperature. The leuco dye was slightly soluble in the developers, therefore, in the case of materials with a 1
9. Irrespective of the employed ratio, the prepared sensors demonstrated a notable color transition behavior: starting from pink at room temperature, shifting to white at approximately 105 °C, and reverting to pink above that temperature. The leuco dye was slightly soluble in the developers, therefore, in the case of materials with a 1![[thin space (1/6-em)]](https://www.rsc.org/images/entities/char_2009.gif) :
:![[thin space (1/6-em)]](https://www.rsc.org/images/entities/char_2009.gif) 1 ratio the melted volume of the CnBA was insufficient to properly disperse the BF crystals, resulting in agglomerates in the obtained sensors. By increasing the content of the CnBA, it was observed that the leuco dye crystals were more uniformly distributed in the melted volume of each of the developers.
1 ratio the melted volume of the CnBA was insufficient to properly disperse the BF crystals, resulting in agglomerates in the obtained sensors. By increasing the content of the CnBA, it was observed that the leuco dye crystals were more uniformly distributed in the melted volume of each of the developers.
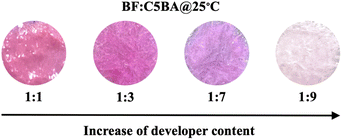
However, an excessive increase in the ratio of CnBA to BF caused the pink color below and above 105 °C to be less intense (Fig. 2). Ultimately, an optimal ratio of 1![[thin space (1/6-em)]](https://www.rsc.org/images/entities/char_2009.gif) :
:![[thin space (1/6-em)]](https://www.rsc.org/images/entities/char_2009.gif) 3 (BF to CnBA) was chosen for further investigation. Materials with this ratio exhibited sustained color vibrancy, and the leuco dye was uniformly dispersed in the melted developers, avoiding the issues of agglomeration.
3 (BF to CnBA) was chosen for further investigation. Materials with this ratio exhibited sustained color vibrancy, and the leuco dye was uniformly dispersed in the melted developers, avoiding the issues of agglomeration.
3.3 Differential scanning calorimetry (DSC) analysis
Differential scanning calorimetry (DSC) is a crucial technique in the study of liquid crystals, particularly those displaying the nematic phase. This method enables precise examination of thermal transitions within the nematic phase, offering insights into the thermodynamic properties, such as phase transitions and associated enthalpies.34The DSC curves of the BF![[thin space (1/6-em)]](https://www.rsc.org/images/entities/char_2009.gif) :
:![[thin space (1/6-em)]](https://www.rsc.org/images/entities/char_2009.gif) CnBA (1
CnBA (1![[thin space (1/6-em)]](https://www.rsc.org/images/entities/char_2009.gif) :
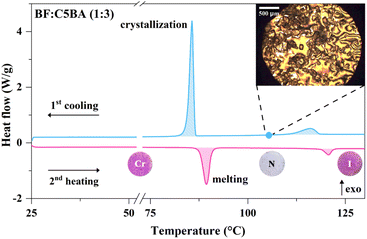
:![[thin space (1/6-em)]](https://www.rsc.org/images/entities/char_2009.gif) 3) show that the prepared temperature sensors exhibit two phase transitions in the second heating and the first cooling cycles (Fig. S1†). An example of the DSC curves for BF
3) show that the prepared temperature sensors exhibit two phase transitions in the second heating and the first cooling cycles (Fig. S1†). An example of the DSC curves for BF![[thin space (1/6-em)]](https://www.rsc.org/images/entities/char_2009.gif) :
:![[thin space (1/6-em)]](https://www.rsc.org/images/entities/char_2009.gif) C5BA (1
C5BA (1![[thin space (1/6-em)]](https://www.rsc.org/images/entities/char_2009.gif) :
:![[thin space (1/6-em)]](https://www.rsc.org/images/entities/char_2009.gif) 3) is shown in Fig. 3. The appropriate temperature and enthalpy changes are presented in Table 1. The first transition is associated with the release of a large amount of energy, which indicates a significant disruption of the packing of CnBA acid molecules in obtained materials. This may be caused by the loss of long-range positional order while still retaining the orientational one, which is influenced by the shift from the crystalline to the nematic phase. The subsequent phase transition is associated with the release of significantly less energy, indicating a minor disturbance in the packing of CnBA acid molecules. This is a direct result of the loss of the remaining orientational order during the transition from the nematic to the isotropic phase.
3) is shown in Fig. 3. The appropriate temperature and enthalpy changes are presented in Table 1. The first transition is associated with the release of a large amount of energy, which indicates a significant disruption of the packing of CnBA acid molecules in obtained materials. This may be caused by the loss of long-range positional order while still retaining the orientational one, which is influenced by the shift from the crystalline to the nematic phase. The subsequent phase transition is associated with the release of significantly less energy, indicating a minor disturbance in the packing of CnBA acid molecules. This is a direct result of the loss of the remaining orientational order during the transition from the nematic to the isotropic phase.
![[thin space (1/6-em)]](https://www.rsc.org/images/entities/char_2009.gif) :
:![[thin space (1/6-em)]](https://www.rsc.org/images/entities/char_2009.gif) C5BA (1
C5BA (1![[thin space (1/6-em)]](https://www.rsc.org/images/entities/char_2009.gif) :
:![[thin space (1/6-em)]](https://www.rsc.org/images/entities/char_2009.gif) 3)a
3)a
| Phase transition | Material | Temperature (°C) | ΔH (kJ mol−1) |
|---|---|---|---|
| a Cr – crystalline phase, N – nematic phase, I – isotropic phase. | |||
| 2nd heating | |||
| Cr–N | BF![[thin space (1/6-em)]](https://www.rsc.org/images/entities/char_2009.gif) : :![[thin space (1/6-em)]](https://www.rsc.org/images/entities/char_2009.gif) C4BA (1 C4BA (1![[thin space (1/6-em)]](https://www.rsc.org/images/entities/char_2009.gif) : :![[thin space (1/6-em)]](https://www.rsc.org/images/entities/char_2009.gif) 3) 3) |
101 | −8.20 |
BF![[thin space (1/6-em)]](https://www.rsc.org/images/entities/char_2009.gif) : :![[thin space (1/6-em)]](https://www.rsc.org/images/entities/char_2009.gif) C5BA (1 C5BA (1![[thin space (1/6-em)]](https://www.rsc.org/images/entities/char_2009.gif) : :![[thin space (1/6-em)]](https://www.rsc.org/images/entities/char_2009.gif) 3) 3) |
89 | −7.97 | |
BF![[thin space (1/6-em)]](https://www.rsc.org/images/entities/char_2009.gif) : :![[thin space (1/6-em)]](https://www.rsc.org/images/entities/char_2009.gif) C6BA (1 C6BA (1![[thin space (1/6-em)]](https://www.rsc.org/images/entities/char_2009.gif) : :![[thin space (1/6-em)]](https://www.rsc.org/images/entities/char_2009.gif) 3) 3) |
97 | −8.72 | |
| N–I | BF![[thin space (1/6-em)]](https://www.rsc.org/images/entities/char_2009.gif) : :![[thin space (1/6-em)]](https://www.rsc.org/images/entities/char_2009.gif) C4BA (1 C4BA (1![[thin space (1/6-em)]](https://www.rsc.org/images/entities/char_2009.gif) : :![[thin space (1/6-em)]](https://www.rsc.org/images/entities/char_2009.gif) 3) 3) |
108 | −0.66 |
BF![[thin space (1/6-em)]](https://www.rsc.org/images/entities/char_2009.gif) : :![[thin space (1/6-em)]](https://www.rsc.org/images/entities/char_2009.gif) C5BA (1 C5BA (1![[thin space (1/6-em)]](https://www.rsc.org/images/entities/char_2009.gif) : :![[thin space (1/6-em)]](https://www.rsc.org/images/entities/char_2009.gif) 3) 3) |
121 | −1.29 | |
BF![[thin space (1/6-em)]](https://www.rsc.org/images/entities/char_2009.gif) : :![[thin space (1/6-em)]](https://www.rsc.org/images/entities/char_2009.gif) C6BA (1 C6BA (1![[thin space (1/6-em)]](https://www.rsc.org/images/entities/char_2009.gif) : :![[thin space (1/6-em)]](https://www.rsc.org/images/entities/char_2009.gif) 3) 3) |
109 | −0.66 | |
![[thin space (1/6-em)]](https://www.rsc.org/images/entities/char_2009.gif) |
|||
| 1st cooling | |||
| I–N | BF![[thin space (1/6-em)]](https://www.rsc.org/images/entities/char_2009.gif) : :![[thin space (1/6-em)]](https://www.rsc.org/images/entities/char_2009.gif) C4BA (1 C4BA (1![[thin space (1/6-em)]](https://www.rsc.org/images/entities/char_2009.gif) : :![[thin space (1/6-em)]](https://www.rsc.org/images/entities/char_2009.gif) 3) 3) |
104 | 0.90 |
BF![[thin space (1/6-em)]](https://www.rsc.org/images/entities/char_2009.gif) : :![[thin space (1/6-em)]](https://www.rsc.org/images/entities/char_2009.gif) C5BA (1 C5BA (1![[thin space (1/6-em)]](https://www.rsc.org/images/entities/char_2009.gif) : :![[thin space (1/6-em)]](https://www.rsc.org/images/entities/char_2009.gif) 3) 3) |
116 | 1.45 | |
BF![[thin space (1/6-em)]](https://www.rsc.org/images/entities/char_2009.gif) : :![[thin space (1/6-em)]](https://www.rsc.org/images/entities/char_2009.gif) C6BA (1 C6BA (1![[thin space (1/6-em)]](https://www.rsc.org/images/entities/char_2009.gif) : :![[thin space (1/6-em)]](https://www.rsc.org/images/entities/char_2009.gif) 3) 3) |
106 | 0.74 | |
| N–Cr | BF![[thin space (1/6-em)]](https://www.rsc.org/images/entities/char_2009.gif) : :![[thin space (1/6-em)]](https://www.rsc.org/images/entities/char_2009.gif) C4BA (1 C4BA (1![[thin space (1/6-em)]](https://www.rsc.org/images/entities/char_2009.gif) : :![[thin space (1/6-em)]](https://www.rsc.org/images/entities/char_2009.gif) 3) 3) |
95 | 8.37 |
BF![[thin space (1/6-em)]](https://www.rsc.org/images/entities/char_2009.gif) : :![[thin space (1/6-em)]](https://www.rsc.org/images/entities/char_2009.gif) C5BA (1 C5BA (1![[thin space (1/6-em)]](https://www.rsc.org/images/entities/char_2009.gif) : :![[thin space (1/6-em)]](https://www.rsc.org/images/entities/char_2009.gif) 3) 3) |
86 | 7.91 | |
BF![[thin space (1/6-em)]](https://www.rsc.org/images/entities/char_2009.gif) : :![[thin space (1/6-em)]](https://www.rsc.org/images/entities/char_2009.gif) C6BA (1 C6BA (1![[thin space (1/6-em)]](https://www.rsc.org/images/entities/char_2009.gif) : :![[thin space (1/6-em)]](https://www.rsc.org/images/entities/char_2009.gif) 3) 3) |
93 | 9.04 | |
During the second heating cycle, nematic phases occur in the temperature ranges from 101 to 108 °C for BF![[thin space (1/6-em)]](https://www.rsc.org/images/entities/char_2009.gif) :
:![[thin space (1/6-em)]](https://www.rsc.org/images/entities/char_2009.gif) C4BA (1
C4BA (1![[thin space (1/6-em)]](https://www.rsc.org/images/entities/char_2009.gif) :
:![[thin space (1/6-em)]](https://www.rsc.org/images/entities/char_2009.gif) 3), from 89 to 121 °C for BF
3), from 89 to 121 °C for BF![[thin space (1/6-em)]](https://www.rsc.org/images/entities/char_2009.gif) :
:![[thin space (1/6-em)]](https://www.rsc.org/images/entities/char_2009.gif) C5BA (1
C5BA (1![[thin space (1/6-em)]](https://www.rsc.org/images/entities/char_2009.gif) :
:![[thin space (1/6-em)]](https://www.rsc.org/images/entities/char_2009.gif) 3) and from 97 to 109 °C for BF
3) and from 97 to 109 °C for BF![[thin space (1/6-em)]](https://www.rsc.org/images/entities/char_2009.gif) :
:![[thin space (1/6-em)]](https://www.rsc.org/images/entities/char_2009.gif) C6BA (1
C6BA (1![[thin space (1/6-em)]](https://www.rsc.org/images/entities/char_2009.gif) :
:![[thin space (1/6-em)]](https://www.rsc.org/images/entities/char_2009.gif) 3). In turn, during the first cooling cycle, nematic phases occur in the temperature ranges from 104 to 95 °C, from 116 to 86 °C and from 106 to 93 °C, respectively.
3). In turn, during the first cooling cycle, nematic phases occur in the temperature ranges from 104 to 95 °C, from 116 to 86 °C and from 106 to 93 °C, respectively.
3.4 Polarized optical microscopy (POM) measurements
While the DSC detects enthalpy changes linked to phase transitions in a material, it falls short of offering precise phase identification. Characteristics of a liquid crystal phase are specific optical patterns, also called textures, which arise from defined molecular arrangements in the sample. Therefore, optical polarizing microscopy was employed alongside DSC to ascertain the mesophase types displayed by a material.34The presence of the nematic phase in the obtained materials was further confirmed by the POM technique (inset in Fig. 3). When cooling the prepared temperature sensors from the isotropic phase, patterns of dark brushes radiating from each point defect were observed in regions between the crystals of the BF at 105 °C. Moreover, the regions of the liquid phase, found between the BF microcrystals transmit the light in the crossed-polarizers setup, indicating the birefringence of the liquid. This, in turn, proves the orientational order of the nematic phase. The above-mentioned patterns, known as Schlieren textures, arise from a consistent change in the orientation of the optical index ellipsoid in the sample, indicating a continuous shift in molecular orientation.35 These specific structures, characteristic of the nematic phase, can be distinguished for all obtained BF![[thin space (1/6-em)]](https://www.rsc.org/images/entities/char_2009.gif) :
:![[thin space (1/6-em)]](https://www.rsc.org/images/entities/char_2009.gif) CnBA (1
CnBA (1![[thin space (1/6-em)]](https://www.rsc.org/images/entities/char_2009.gif) :
:![[thin space (1/6-em)]](https://www.rsc.org/images/entities/char_2009.gif) 3) materials (insets in Fig. S1†), especially in the BF
3) materials (insets in Fig. S1†), especially in the BF![[thin space (1/6-em)]](https://www.rsc.org/images/entities/char_2009.gif) :
:![[thin space (1/6-em)]](https://www.rsc.org/images/entities/char_2009.gif) C5BA (1
C5BA (1![[thin space (1/6-em)]](https://www.rsc.org/images/entities/char_2009.gif) :
:![[thin space (1/6-em)]](https://www.rsc.org/images/entities/char_2009.gif) 3).
3).
3.5 Temperature-dependent powder X-ray diffraction (PXRD)
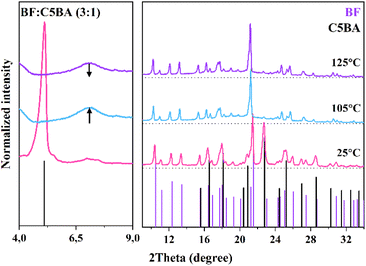
The temperature-dependent PXRD measurements were conducted to determine the phase composition of the obtained temperature sensors as a function of temperature.The PXRD patterns of the prepared materials recorded at 25 °C exhibit well-resolved reflections that can be attributed to the CnBA and the BF in the crystalline phase. Fig. 4 presents measured PXRD patterns of BF![[thin space (1/6-em)]](https://www.rsc.org/images/entities/char_2009.gif) :
:![[thin space (1/6-em)]](https://www.rsc.org/images/entities/char_2009.gif) C5BA (1
C5BA (1![[thin space (1/6-em)]](https://www.rsc.org/images/entities/char_2009.gif) :
:![[thin space (1/6-em)]](https://www.rsc.org/images/entities/char_2009.gif) 3). As the temperature increases, the reflections shift towards smaller 2θ values, indicating the thermal expansion of the lattice parameters. In the PXRD patterns recorded at 105 °C, the reflections from the CnBA disappear, being replaced by two diffuse reflections in the 2θ range of 6–8° and 15–25°.
3). As the temperature increases, the reflections shift towards smaller 2θ values, indicating the thermal expansion of the lattice parameters. In the PXRD patterns recorded at 105 °C, the reflections from the CnBA disappear, being replaced by two diffuse reflections in the 2θ range of 6–8° and 15–25°.
The presence of diffuse reflections indicates the disappearance of long-range positional order in the CnBA developer phase (Fig. S2†). This observation is consistent with the DSC results, corresponding to the transition from the crystalline to the nematic phase. At higher temperature (i.e., 115 °C for the BF![[thin space (1/6-em)]](https://www.rsc.org/images/entities/char_2009.gif) :
:![[thin space (1/6-em)]](https://www.rsc.org/images/entities/char_2009.gif) C4BA (3
C4BA (3![[thin space (1/6-em)]](https://www.rsc.org/images/entities/char_2009.gif) :
:![[thin space (1/6-em)]](https://www.rsc.org/images/entities/char_2009.gif) 1) and BF
1) and BF![[thin space (1/6-em)]](https://www.rsc.org/images/entities/char_2009.gif) :
:![[thin space (1/6-em)]](https://www.rsc.org/images/entities/char_2009.gif) C6BA (1
C6BA (1![[thin space (1/6-em)]](https://www.rsc.org/images/entities/char_2009.gif) :
:![[thin space (1/6-em)]](https://www.rsc.org/images/entities/char_2009.gif) 3) and 125 °C for the BF
3) and 125 °C for the BF![[thin space (1/6-em)]](https://www.rsc.org/images/entities/char_2009.gif) :
:![[thin space (1/6-em)]](https://www.rsc.org/images/entities/char_2009.gif) C5BA (1
C5BA (1![[thin space (1/6-em)]](https://www.rsc.org/images/entities/char_2009.gif) :
:![[thin space (1/6-em)]](https://www.rsc.org/images/entities/char_2009.gif) 3)), a flattening of the diffuse reflections can be observed. This suggests an even greater disorder, such as the lack of both positional and orientational order in the CnBA phase, which is consistent with the transition from the nematic to the isotropic phase present on the DSC curves.
3)), a flattening of the diffuse reflections can be observed. This suggests an even greater disorder, such as the lack of both positional and orientational order in the CnBA phase, which is consistent with the transition from the nematic to the isotropic phase present on the DSC curves.
3.6 Thermal stability analysis using TG
Considering the potential application of the prepared temperature sensors, their thermal stability was determined using the TG method.Analysis of the TG curves revealed that the BF![[thin space (1/6-em)]](https://www.rsc.org/images/entities/char_2009.gif) :
:![[thin space (1/6-em)]](https://www.rsc.org/images/entities/char_2009.gif) C4BA (1
C4BA (1![[thin space (1/6-em)]](https://www.rsc.org/images/entities/char_2009.gif) :
:![[thin space (1/6-em)]](https://www.rsc.org/images/entities/char_2009.gif) 3), BF
3), BF![[thin space (1/6-em)]](https://www.rsc.org/images/entities/char_2009.gif) :
:![[thin space (1/6-em)]](https://www.rsc.org/images/entities/char_2009.gif) C5BA (1
C5BA (1![[thin space (1/6-em)]](https://www.rsc.org/images/entities/char_2009.gif) :
:![[thin space (1/6-em)]](https://www.rsc.org/images/entities/char_2009.gif) 3), and BF
3), and BF![[thin space (1/6-em)]](https://www.rsc.org/images/entities/char_2009.gif) :
:![[thin space (1/6-em)]](https://www.rsc.org/images/entities/char_2009.gif) C6BA (1
C6BA (1![[thin space (1/6-em)]](https://www.rsc.org/images/entities/char_2009.gif) :
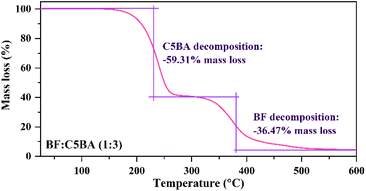
:![[thin space (1/6-em)]](https://www.rsc.org/images/entities/char_2009.gif) 3) are stable up to 123, 131, and 136 °C, respectively, after which decomposition begins (Fig. 5 and S3†). All prepared materials exhibit two main stages of weight loss – first, corresponding to 50.39% for BF : C4BA (1
3) are stable up to 123, 131, and 136 °C, respectively, after which decomposition begins (Fig. 5 and S3†). All prepared materials exhibit two main stages of weight loss – first, corresponding to 50.39% for BF : C4BA (1![[thin space (1/6-em)]](https://www.rsc.org/images/entities/char_2009.gif) :
:![[thin space (1/6-em)]](https://www.rsc.org/images/entities/char_2009.gif) 3), 59.12% for BF
3), 59.12% for BF![[thin space (1/6-em)]](https://www.rsc.org/images/entities/char_2009.gif) :
:![[thin space (1/6-em)]](https://www.rsc.org/images/entities/char_2009.gif) C5BA (1
C5BA (1![[thin space (1/6-em)]](https://www.rsc.org/images/entities/char_2009.gif) :
:![[thin space (1/6-em)]](https://www.rsc.org/images/entities/char_2009.gif) 3), and 49.07% for BF
3), and 49.07% for BF![[thin space (1/6-em)]](https://www.rsc.org/images/entities/char_2009.gif) :
:![[thin space (1/6-em)]](https://www.rsc.org/images/entities/char_2009.gif) C6BA (1
C6BA (1![[thin space (1/6-em)]](https://www.rsc.org/images/entities/char_2009.gif) :
:![[thin space (1/6-em)]](https://www.rsc.org/images/entities/char_2009.gif) 3), can be observed in the temperature range of 123–300 °C, 131–300 °C, and 136–300 °C, respectively, and results from the decomposition of the CnBA acid. The second stage, amounting to 40.02% for BF
3), can be observed in the temperature range of 123–300 °C, 131–300 °C, and 136–300 °C, respectively, and results from the decomposition of the CnBA acid. The second stage, amounting to 40.02% for BF![[thin space (1/6-em)]](https://www.rsc.org/images/entities/char_2009.gif) :
:![[thin space (1/6-em)]](https://www.rsc.org/images/entities/char_2009.gif) C4BA (1
C4BA (1![[thin space (1/6-em)]](https://www.rsc.org/images/entities/char_2009.gif) :
:![[thin space (1/6-em)]](https://www.rsc.org/images/entities/char_2009.gif) 3), 36.47% for BF
3), 36.47% for BF![[thin space (1/6-em)]](https://www.rsc.org/images/entities/char_2009.gif) :
:![[thin space (1/6-em)]](https://www.rsc.org/images/entities/char_2009.gif) C5BA (1
C5BA (1![[thin space (1/6-em)]](https://www.rsc.org/images/entities/char_2009.gif) :
:![[thin space (1/6-em)]](https://www.rsc.org/images/entities/char_2009.gif) 3), and 44.94% for BF
3), and 44.94% for BF![[thin space (1/6-em)]](https://www.rsc.org/images/entities/char_2009.gif) :
:![[thin space (1/6-em)]](https://www.rsc.org/images/entities/char_2009.gif) C6BA (1
C6BA (1![[thin space (1/6-em)]](https://www.rsc.org/images/entities/char_2009.gif) :
:![[thin space (1/6-em)]](https://www.rsc.org/images/entities/char_2009.gif) 3), observed in the temperature range of 300–600 °C, corresponds to the decomposition of the BF dye. The TG results suggest that the obtained materials will reversibly change color over several measurement cycles if the CnBA is not decomposed.
3), observed in the temperature range of 300–600 °C, corresponds to the decomposition of the BF dye. The TG results suggest that the obtained materials will reversibly change color over several measurement cycles if the CnBA is not decomposed.
3.7 Temperature-dependent UV-Vis absorption spectroscopy
UV-Vis spectroscopy measurements were conducted to investigate the influence of the phase composition of obtained sensors on their color, which changed at higher temperature. The temperature at which the absorption spectra were recorded was based on the DSC results: 25, 105, and 135 °C for BF![[thin space (1/6-em)]](https://www.rsc.org/images/entities/char_2009.gif) :
:![[thin space (1/6-em)]](https://www.rsc.org/images/entities/char_2009.gif) C4BA (1
C4BA (1![[thin space (1/6-em)]](https://www.rsc.org/images/entities/char_2009.gif) :
:![[thin space (1/6-em)]](https://www.rsc.org/images/entities/char_2009.gif) 3), and 25, 105, and 155 °C for BF
3), and 25, 105, and 155 °C for BF![[thin space (1/6-em)]](https://www.rsc.org/images/entities/char_2009.gif) :
:![[thin space (1/6-em)]](https://www.rsc.org/images/entities/char_2009.gif) C5BA (1
C5BA (1![[thin space (1/6-em)]](https://www.rsc.org/images/entities/char_2009.gif) :
:![[thin space (1/6-em)]](https://www.rsc.org/images/entities/char_2009.gif) 3) and BF
3) and BF![[thin space (1/6-em)]](https://www.rsc.org/images/entities/char_2009.gif) :
:![[thin space (1/6-em)]](https://www.rsc.org/images/entities/char_2009.gif) C6BA (1
C6BA (1![[thin space (1/6-em)]](https://www.rsc.org/images/entities/char_2009.gif) :
:![[thin space (1/6-em)]](https://www.rsc.org/images/entities/char_2009.gif) 3) – in room temperature, as well as in and after the nematic phase occurrence (Fig. 6 and S4†).
3) – in room temperature, as well as in and after the nematic phase occurrence (Fig. 6 and S4†).
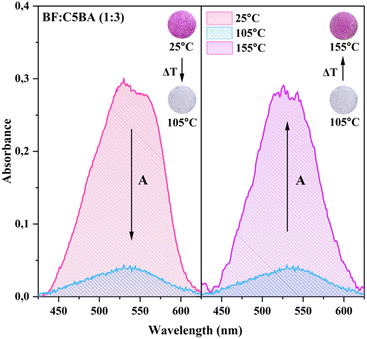
For all types of obtained materials, at 25 °C, the spectra exhibit a broad band in the range from 450 to 600 nm, with the maximum at approximately 525 nm, that can be assigned to the π–π* transitions of the ring-opened BF form.31 The wavelength range of this band directly corresponds to the absorption of green light. In consequence, prepared temperature sensors are colored pink. At 105 °C, the phase transition of CnBA from crystalline to nematic occurs, which is visible on the measured spectra. At this temperature the absorption band is flattened, indicating that the sensors started to reflect the entire visible light spectrum, resulting in a white color. Considering that this band did not flatten completely, it is possible to determine that during the color change, not all BF molecules shift from the colored to the colorless form. At higher temperature, i.e. 135/155 °C, following the nematic phase occurrence, this band regained a shape similar to that observed at room temperature, causing the temperature sensors to exhibit a pink color once again. This concludes that the absorption band in this range is directly connected to the appearance of the ring-opened form of BF in the prepared sensors.
3.8 Photoluminescence spectra
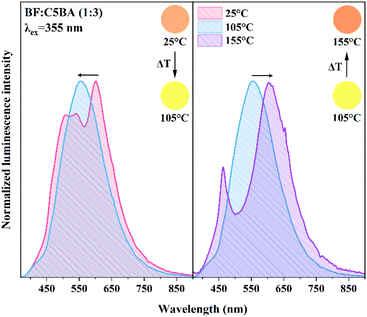
To fully understand the influence of the phase composition of the obtained materials on their spectroscopic properties, temperature-dependent photoluminescence spectra were recorded. Fig. 7 shows the photoluminescence for BF![[thin space (1/6-em)]](https://www.rsc.org/images/entities/char_2009.gif) :
:![[thin space (1/6-em)]](https://www.rsc.org/images/entities/char_2009.gif) C5BA (1
C5BA (1![[thin space (1/6-em)]](https://www.rsc.org/images/entities/char_2009.gif) :
:![[thin space (1/6-em)]](https://www.rsc.org/images/entities/char_2009.gif) 3) measured at 25, 105 and 155 °C. The spectra were recorded under the excitation of a picosecond laser at λex = 355 nm.
3) measured at 25, 105 and 155 °C. The spectra were recorded under the excitation of a picosecond laser at λex = 355 nm.
At room temperature (25 °C) the emission spectra of obtained materials consist of two broad bands, one with the maximum at about λem = 545 nm and the second at λem = 565 nm (Fig. S5†). When the temperature is increased to 105 °C, which corresponds to the white color of the materials because of the change to the nematic phase, the main emission peak slightly shifts towards higher energies with the maximum at λem = 550 nm. In the case of heating the temperature sensor to 155 °C, the emission maximum shifts again back to λem = 565 nm. The new band at λem = 450 nm could be the consequence of the inner filter effect and reabsorption processes. The marginal spectral shift is attributed to the nearly identical chromophore systems in both protonated and unprotonated forms of BF, differing solely in the presence of the open lactone ring in the protonated form.36
Under UV light excitation at room temperature orange emission could be observed, which shifted to yellow at 105 °C, and returned to orange again at 135/155 °C. The analysis of temperature-dependent luminescence spectra proved that they correspond to emission colors observed for these materials when exposed to UV light. The chromatic coordinates (x, y) in the CIE XYZ 1931 color space, based on the recorded spectra, were determined using Origin software. At room temperature (25 °C), when the temperature sensors are pink, they correspond to orange luminescence emission, while in the temperature range of nematic phase for CnBA, at 105 °C, when they turn white, the emission correlates with yellow color. In the case of 135/155 °C, when the materials turn pink again, the coordinates (x, y) once more correspond to orange luminescence emission. These temperature-sensitive sensors employed, exhibiting visible color changes as well as emission, present a crucial aspect for applications in environments with limited air transparency, enhancing their utility and efficacy in challenging conditions.
3.9 Colour-changing thermochromic materials
BF![[thin space (1/6-em)]](https://www.rsc.org/images/entities/char_2009.gif) :
:![[thin space (1/6-em)]](https://www.rsc.org/images/entities/char_2009.gif) CnBA materials (in a 1
CnBA materials (in a 1![[thin space (1/6-em)]](https://www.rsc.org/images/entities/char_2009.gif) :
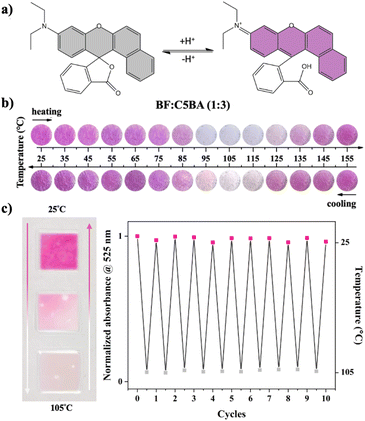
:![[thin space (1/6-em)]](https://www.rsc.org/images/entities/char_2009.gif) 3 ratio) exhibit interesting optical properties depending on the temperature, which are manifested through a change in both – the observed color of the materials, as well as the luminescence emitted by them. At a temperature of 25 °C, corresponding to the crystalline phase of the CnBA, the BF is in colored form with an open lactone ring (Fig. 8a). Consequently, the materials are pink and emit orange radiation. However, at a temperature of 105 °C, corresponding to the nematic phase of the developer, the lactone ring of the BF is closed, and the dye is in its colorless state. This is a direct result of the stabilization of the nematic phase of the CnBA through dimeric structures formed by developer molecules. Therefore, orientationally ordered supramolecular structures with a mesogenic character, resembling rods, are formed. This, in turn, leads to a limited availability of hydrogen atoms for the protonation process of the BF leuco dye, making its development impossible. Consequently, the obtained materials turn white and exhibit yellow emission. Then, at a temperature of 135/155 °C, corresponding to the isotropic phase of the CnBA developer, the BF leuco dye returns to its colored form (Fig. 8b and S6†). Therefore, the materials turn pink again and show orange luminescence.
3 ratio) exhibit interesting optical properties depending on the temperature, which are manifested through a change in both – the observed color of the materials, as well as the luminescence emitted by them. At a temperature of 25 °C, corresponding to the crystalline phase of the CnBA, the BF is in colored form with an open lactone ring (Fig. 8a). Consequently, the materials are pink and emit orange radiation. However, at a temperature of 105 °C, corresponding to the nematic phase of the developer, the lactone ring of the BF is closed, and the dye is in its colorless state. This is a direct result of the stabilization of the nematic phase of the CnBA through dimeric structures formed by developer molecules. Therefore, orientationally ordered supramolecular structures with a mesogenic character, resembling rods, are formed. This, in turn, leads to a limited availability of hydrogen atoms for the protonation process of the BF leuco dye, making its development impossible. Consequently, the obtained materials turn white and exhibit yellow emission. Then, at a temperature of 135/155 °C, corresponding to the isotropic phase of the CnBA developer, the BF leuco dye returns to its colored form (Fig. 8b and S6†). Therefore, the materials turn pink again and show orange luminescence.
These sensors can be used to indicate three temperature ranges, which directly correspond to the crystalline, nematic, and isotropic phase appearance of the CnBA. If the temperature range aligns with the occurrence of both the crystalline and nematic phases they can be used repeatedly. The analysis of absorption spectra indicates the reversible shifts in absorption bands, affirming the absence of intensity loss in the original spectra upon repeated heating and cooling cycles. This observation underscores the complete colorimetric reversibility. Notably, a plot of the absorbance at 525 nm as a function of thermal cycles provides further support to the presence of full colorimetric reversibility (Fig. 8c). When the sensors are intended to indicate the temperature in broader temperature ranges including isotropic phase, i.e. 25–135 °C for BF![[thin space (1/6-em)]](https://www.rsc.org/images/entities/char_2009.gif) :
:![[thin space (1/6-em)]](https://www.rsc.org/images/entities/char_2009.gif) C4BA or 25–155 °C for BF
C4BA or 25–155 °C for BF![[thin space (1/6-em)]](https://www.rsc.org/images/entities/char_2009.gif) :
:![[thin space (1/6-em)]](https://www.rsc.org/images/entities/char_2009.gif) C5BA and BF
C5BA and BF![[thin space (1/6-em)]](https://www.rsc.org/images/entities/char_2009.gif) :
:![[thin space (1/6-em)]](https://www.rsc.org/images/entities/char_2009.gif) C6BA, they can be utilized only in a single full measurement cycle.
C6BA, they can be utilized only in a single full measurement cycle.
Furthermore, these thermochromic materials, once laminated, serve as reliable indicators, undergoing distinct color changes at specific temperature thresholds. This transformative behavior facilitates real-time monitoring and validation of thermal processes. The laminated temperature sensors could find applications in various fields, such as industrial manufacturing, where they would function as temperature-sensitive labels to indicate whether optimal temperature have been reached during production. The versatility of these laminated thermochromic sensors positions them as valuable tools for ensuring precision and quality control in temperature-dependent processes across diverse applications.
4. Conclusions
The first use of CnBA liquid crystals (where n = 4, 5, 6) as color developers in TOMs containing BF leuco dye is reported. The presence of a liquid-crystalline nematic phase, confirmed by DSC, POM, and temperature-dependent PXRD, causes prepared sensors to have unique optical properties. They exhibit a reversible, temperature-dependent change in both, the observed and emission color, which was proven using spectroscopic techniques such as absorption or luminescence measurements. When the CnBA developers are in the crystalline and isotropic phases, the materials are pink and emit orange light, indicating that the BF leuco dye is in an open form. In contrast, when the CnBA is in the nematic phase, the materials are white and emit yellow light, which suggests that the BF adopted a closed form because hydrogen atoms are not accessible for its development. Due to their properties, the sensors can inform about the temperature in normal and reduced air transparency in industrial applications. These results are fundamental for future research on temperature sensors, composed of leuco dyes and liquid-crystalline developers. Depending on the properties of the nematic phase of the developer, including the temperature range in which it occurs and its width, it is possible to design new sensors that are sensitive to selected temperature.Author contributions
Jakub Pawłów: methodology, investigation, data curation, writing – original draft, visualization, Magdalena Wilk-Kozubek: methodology, investigation, data curation, writing – original draft, visualization, funding acquisition, Maciej Czajkowski: methodology, investigation, writing – review & editing, Maria Zdończyk: investigation, data curation, writing – review & editing. Joanna Cybińska: conceptualization, writing – review & editing, supervision.Conflicts of interest
There is no conflict to declare.Acknowledgements
J. P. would like to thank the Ministry of Science and Higher Education in Poland for Grant No. DWD/5/0362/2021 “Design and synthesis of materials for use in optical temperature sensors” in the frame of Implementation of the Doctorate Program. This work was partially supported by the National Centre for Research and Development under the “Lider XI” program based on the grant agreement No. LIDER/38/0135/L-11/19/NCBR/2020. The authors would like to thank Dr Sc. Katarzyna Ślepokura from the Faculty of Chemistry at the University of Wrocław for her help in crystallographic analysis of the single crystal structure of the leuco dye.References
- I. Rocha Segundo, E. Freitas, V. T. F. Castelo Branco, S. Landi Jr, M. F. Costa and J. O. Carneiro, Review and analysis of advances in functionalized, smart, and multifunctional asphalt mixtures, Renewable Sustainable Energy Rev., 2021, 151, 111552 CrossRef.
- M. Calovi, A. Zanardi and S. Rossi, Improvement of the thermal efficiency of organic roof-coatings through design aimed at increasing the durability of thermochromic pigments, Prog. Org. Coat., 2023, 185, 107928 CrossRef CAS.
- U. Berardi, M. Garai and T. Morselli, Preparation and assessment of the potential energy savings of thermochromic and cool coatings considering inter-building effects, Sol. Energy, 2020, 209, 493–504 CrossRef.
- A. Hakami, S. S. Srinivasan, P. K. Biswas, A. Krishnegowda, S. L. Wallen and E. K. Stefanakos, Review on thermochromic materials: development, characterization, and applications, J. Coat. Technol. Res., 2022, 19, 377–402 CrossRef CAS.
- C. R. Smith, D. R. Sabatino and T. J. Praisner, Temperature sensing with thermochromic liquid crystals, Exp. Fluids, 2001, 30, 190–201 CrossRef CAS.
- M. Vanderroost, P. Ragaert, F. Devlieghere and B. De Meulenaer, Intelligent food packaging: The next generation, Trends Food Sci. Technol., 2014, 39, 47–62 CrossRef CAS.
- L. C. van der Werff, A. J. Robinson and I. L. Kyratzis, Combinatorial Approach for the Rapid Determination of Thermochromic Behavior of Binary and Ternary Cholesteric Liquid Crystalline Mixtures, ACS Comb. Sci., 2012, 14(11), 605–612 CrossRef CAS PubMed.
- D. Coates, Development and applications of cholesteric liquid crystals, Liq. Cryst., 2015, 42(5–6), 653–665 CAS.
- F. Fu and L. Hu, Temperature sensitive colour-changed composites, in Advanced High Strength Natural Fibre Composites in Construction, Elsevier, 2017, Ch. 15, pp. 405–423 Search PubMed.
- R. Wiberg and N. Lior, Errors in thermochromic liquid crystal thermometry, Rev. Sci. Instrum., 2004, 75(9), 2985–2994 CrossRef CAS.
- I. Sage, Thermochromic liquid crystals, Liq. Cryst., 2011, 38(11–12), 1551–1561 CrossRef CAS.
- M. A. White and M. LeBlanc, Thermochromism in Commercial Products, J. Chem. Educ., 1999, 76(9), 1201–1205 CrossRef CAS.
- Y. Shibahashi, Thermochromic materials, U.S. Pat., 4425161, 1984 Search PubMed.
- M. W. Khalid, C. Whitehouse, R. Ahmed, M. U. Hassan and H. Butt, Remote Thermal Sensing by Integration of Corner-Cube Optics and Thermochromic Materials, Adv. Opt. Mater., 2018, 7(2), 1801013 CrossRef.
- M. Wang, G. Liu, H. Gao, C. Su and J. Gao, Preparation and performance of reversible thermochromic phase change microcapsules based on negative photochromic spiropyran, Colloids Surf., A, 2023, 659, 130808 CrossRef CAS.
- S. Cho, G. Kim, S. Lee, J. Park and W. Shim, Molecular-Printed Thermochromic with Fast Color Switching, Adv. Opt. Mater., 2017, 5(23), 1700627 CrossRef.
- B. Potaniec, M. Zdończyk and J. Cybińska, Controlled Synthesis of Luminescent Xanthene Dyes and Use of Ionic Liquid in Thermochromic Reaction, Molecules, 2022, 27, 3092 CrossRef CAS PubMed.
- M. S. Tözüm, S. Aksoy and C. Alkan, Microencapsulation of Three-Component Thermochromic System for Reversible Color Change and Thermal Energy Storage, Fibers Polym., 2018, 19(3), 660–669 CrossRef.
- S. Özkayalar, E. Adıgüzel, S. A. Aksoy and C. Alkan, Reversible color-changing and thermal-energy storing nanocapsules of three-component thermochromic dyes, Mater. Chem. Phys., 2020, 252, 123162 CrossRef.
- T. Wu, T. Yin, X. Hu, G. Nian, S. Qu and W. Yang, A Thermochromic Hydrogel for Camouflage and Soft Display, Adv. Opt. Mater., 2020, 8(9), 2000031 CrossRef CAS.
- L. Van der Werff, I. L. Kyratzis, A. Robinson, R. Cranston, G. Peeters, M. O'Shea and L. Nichols, Thermochromic composite fibres containing liquid crystals formed via melt extrusion, J. Mater. Sci., 2013, 48(14), 5005–5011 CrossRef CAS.
- K. Tsutsui, T. Yamaguchi and K. Sato, Thermochromic properties of mixture systems of octadecylphosphonic acid and fluoran dye, J. Appl. Phys., 1994, 33(10), 5925–5928 CrossRef CAS.
- H. Yu, K. Wang, T. Szilvási, K. Nayani, N. Bao, R. J. Twieg, M. Mavrikakis and N. L. Abbott, Design of Chemoresponsive Soft Matter Using Hydrogen-Bonded Liquid Crystals, Materials, 2021, 14, 1055 CrossRef CAS PubMed.
- Rigaku Oxford Diffraction, CrysAlisPro Software System, 1.171.41.93a, Rigaku Corporation, Oxford, UK, 2020 Search PubMed.
- G. M. Sheldrick, A short history of SHELX, Acta Crystallogr. A., 2008, 64, 112 CrossRef CAS PubMed.
- G. M. Sheldrick, Crystal structure refinement with SHELXL, Acta Crystallogr., Sect. C: Struct. Chem., 2015, 71, 3 Search PubMed.
- O. V. Dolomanov, L. J. Bourhis, R. J. Gildea, J. A. K. Howard and H. Puschmann, OLEX2: a complete structure solution, refinement and analysis program, J. Appl. Crystallogr., 2009, 42, 339 CrossRef CAS.
- K. Brandenburg and H. Putz, Diamond, Ver. 3.1, Crystal Impact GbR, Bonn, Germany, 2008 Search PubMed.
- P. Spargur Jr, Recording Material to Produce Copies of Graphical Data, FR1578521, 1969 Search PubMed.
- P. Spargur Jr, Chromogenic Printing Ink, ZA6807028, 1969 Search PubMed.
- D. Han, J. Yi, C. Liu, L. Liang, K. Huang, L. Jing and D. Qin, A fluoran-based viscosity probe with high-performance for lysosome-targeted fluorescence imaging, Spectrochim.
![[thin space (1/6-em)]](https://www.rsc.org/images/entities/char_2009.gif) Acta,
Acta,![[thin space (1/6-em)]](https://www.rsc.org/images/entities/char_2009.gif) Part
Part![[thin space (1/6-em)]](https://www.rsc.org/images/entities/char_2009.gif) A, 2020, 238, 118405 CrossRef CAS PubMed.
A, 2020, 238, 118405 CrossRef CAS PubMed. - K. Huang, Y. Liu, Q. Li, B. Yu, L. Liang and D. Qin, A quinoline-rhodamine hybrid probe for ratiometricly sensing of Hg2+ in water and cell imaging application, Spectrochim.
![[thin space (1/6-em)]](https://www.rsc.org/images/entities/char_2009.gif) Acta,
Acta,![[thin space (1/6-em)]](https://www.rsc.org/images/entities/char_2009.gif) Part
Part![[thin space (1/6-em)]](https://www.rsc.org/images/entities/char_2009.gif) A, 2022, 281, 121651 CrossRef CAS PubMed.
A, 2022, 281, 121651 CrossRef CAS PubMed. - B. Du, Q. Li, K. Huang and L. Liang, A quinoline-fluoran hybrid fluorescent probe for selectively and sensitively sensing copper ions and fluorescence imaging application, J. Mol. Struct., 2023, 1271, 134015 CrossRef CAS.
- S. Singh, Phase transitions in liquid crystals, Phys. Rep., 2000, 324(2–4), 107–269 CrossRef CAS.
- J. Nehring and A. Saupe, On the schlieren texture in nematic and smectic liquid crystals, J. Chem. Soc, Faraday Trans., 1972, 2(68), 1–15 Search PubMed.
- E. N. Obukhova, N. O. Mchedlov-Petrossyan, N. A. Vodolazkaya, L. D. Patsenker, A. O. Doroshenko, A. I. Marynin and B. M. Krasovitskii, Absorption, fluorescence, and acid-base equilibria of rhodamines in micellar media of sodium dodecyl sulfate, Spectrochim.
![[thin space (1/6-em)]](https://www.rsc.org/images/entities/char_2009.gif) Acta,
Acta,![[thin space (1/6-em)]](https://www.rsc.org/images/entities/char_2009.gif) Part
Part![[thin space (1/6-em)]](https://www.rsc.org/images/entities/char_2009.gif) A, 2017, 170, 138–144 CrossRef CAS PubMed.
A, 2017, 170, 138–144 CrossRef CAS PubMed.
Footnotes |
| † Electronic supplementary information (ESI) available. CCDC 2331476. For ESI and crystallographic data in CIF or other electronic format see DOI: https://doi.org/10.1039/d4ra01867b |
| ‡ These authors contributed equally to this work. |
| This journal is © The Royal Society of Chemistry 2024 |

