 Open Access Article
Pr2Ni0.8Co0.2O4+δ impregnated La0.6Sr0.4CoO3−δ oxygen electrode for efficient CO2 electroreduction in solid oxide electrolysis cells†
Binbin Liua,
Zeming Licd,
Guoping Xiao cd,
Xian-Long Du
 *cd,
Huichao Yaob,
Ruoyun Daib,
Xiulin Wang*b,
Jian-Qiang Wang
 cd and
Tao Li*a
aEngineering Research Center of Large-Scale Reactor Engineering and Technology, Ministry of Education, State Key Laboratory of Chemical Engineering, East China University of Science and Technology, Shanghai 200237, China
bCNOOC Gas and Power Group Co., Ltd, Beijing, 100020, China
cKey Laboratory of Interfacial Physics and Technology, Shanghai Institute of Applied Physics, Chinese Academy of Sciences, Shanghai 201800, China. E-mail: duxianlong@sinap.ac.cn
dUniversity of Chinese Academy of Sciences, Beijing 100049, China
First published on 23rd April 2024
Abstract
The solid oxide electrolysis cell (SOEC) is an advanced electrochemical device with a promising future in reducing CO2 emissions. Currently, the insufficient oxygen evolution reaction activity in conventional anode materials severely restricts the development of electrolytic CO2. Herein, the PNCO–LSC composite oxygen electrode was exploited by impregnating Pr2Ni0.8Co0.2O4+δ (PNCO) on the surface of La0.6Sr0.4CoO3−δ (LSC) oxygen electrode. The results of electrochemical tests and various physicochemical characterizations indicate that the infiltration of PNCO can lead to a significant improvement in the performance of the cell for CO2 electroreduction by increasing the surface oxygen exchange. The current density of the PNCO–LSC oxygen electrode infiltrated twice at 800 °C and 1.5 V reaches 0.917 A cm−2, which is about 40% higher than that of the bare LSC oxygen electrode. In addition, the single cell did not show significant degradation in a long-term stability test at a current density of 0.4 A cm−2 for 100 h of electrolysis. Therefore, the PNCO–LSC composite oxygen electrode material is effective in enhancing electrolytic CO2 performance.
1. Introduction
The rapid growth of global fossil energy consumption causes a large amount of CO2 emissions and an increasingly severe greenhouse effect. How to control CO2 emissions more effectively and slow down global warming is a scientific issue that has attracted much attention. Solid oxide electrolysis cells (SOEC), as a clean and efficient electrochemical device, can effectively convert CO2 to CO at high temperatures.1–3 In the high-temperature SOEC electrolysis CO2 system,4 CO2 undergoes an electrochemical reduction reaction on the cathode side to generate CO. The generated oxygen ions are conducted to the anode side through the oxygen vacancies in the electrolyte, and the electrochemical oxidation reaction occurs on the oxygen electrode side, releasing electrons and simultaneously producing O2. The cathodic reaction of CO2 electrolysis occurs with a transfer of two electrons. In comparison, the anodic oxygen evolution reaction (OER) involves a transfer of four electrons, and it can be found that the energy consumption for the high-temperature SOEC electrolysis of CO2 concentrates on the anodic polarization.5,6 Therefore, the development of advanced oxygen electrode materials is crucial for the efficient electrolysis of CO2.7Generally, anode materials should have high ionic and electronic conductivity, excellent stability in an oxidizing atmosphere, and good catalytic activity for OER.8 Perovskite oxide materials are the most commonly used anode materials, such as La1−xSrxMnO3±δ, La1−xSrxCo1−yFeyO3−δ and PrBa0.5Sr0.5Co1.5Fe0.5O5+δ.9–12 However, due to its insufficient OER catalytic activity, it is necessary to adopt some measures to improve the OER performance of perovskite as anode material.13 Solution impregnation is a technique of fixing high surface area catalytic particles on ceramic support material, which is considered an effective method to improve the performance of cell electrodes.14–16
The most widely used Ruddlesden–Popper (R–P) type anode material is Ln2NiO4+δ (Ln = La, Nd, Pr).17 It can be regarded as a special structure composed of a LnO rock salt layer and LnNiO3 perovskite layer, which makes it not only have higher electronic conductivity of perovskite material but also higher oxygen ion conductivity because there is a large amount of interstitial oxygen in LnO rock salt layer.18–20 As an excellent ionic-electronic hybrid conductor material, it has attracted the attention of more and more researchers in recent years. Mitra et al. impregnated La2NiO4 (LNO) onto the surface of La0.6Sr0.4Co0.2Fe0.8O3−δ resulting in a reduction of the polarization resistance by about 81%, indicating that LNO has a significant oxygen diffusivity, high oxygen surface exchange, and particle size.21 Compared to LNO, Pr2NiO4+δ (PNO) has better oxygen diffusivity, structural stability, and higher electrochemical activity.22,23 It has now been found that Ni can be replaced with Co at the B-site, yielding Pr2Ni1−xCoxO4+δ (x = 0.0, 0.1, and 0.2) with improved electrochemical performance and reduced degradation rates compared to PNO.24,25
In this paper, a series of composite oxygen electrodes with different permeation loadings were constructed by infiltrating the Pr2Ni0.8Co0.2O4+δ (PNCO) precursor onto the surface of La0.6Sr0.4CoO3−δ (LSC). The results showed that the permeation of PNCO effectively enhanced the OER activity for high-temperature electrolysis of CO2. The PNCO–LSC composite oxygen electrode impregnated twice showed the best electrochemical performance during CO2 electrolysis at 800 °C.
2. Experimental
2.1 Material synthesis and single cell surface modification
To prepare Pr2Ni0.8Co0.2O4+δ precursor solution with a concentration of 0.01 mol L−1, 1.74 g Pr(NO3)3·6H2O, 0.47 g Ni(NO3)2·6H2O and 0.17 g Co(NO3)3·6H2O were dissolved in 200 mL isopropyl alcohol and deionized water. The surfactant polyvinylpyrrolidone K30 (PVP) and complexing agent glycine were added to the mixture. The resulting mixture was ultrasonic for 30 minutes and stirred for 12 h to obtain a clear and transparent Pr2Ni0.8Co0.2O4+δ solution. The volume ratio of isopropyl alcohol to deionized water is 4![[thin space (1/6-em)]](https://www.rsc.org/images/entities/char_2009.gif) :
:![[thin space (1/6-em)]](https://www.rsc.org/images/entities/char_2009.gif) 1, the molar ratio of Pr(NO3)3·6H2O, Ni(NO3)2·6H2O and Co(NO3)3·6H2O is 10
1, the molar ratio of Pr(NO3)3·6H2O, Ni(NO3)2·6H2O and Co(NO3)3·6H2O is 10![[thin space (1/6-em)]](https://www.rsc.org/images/entities/char_2009.gif) :
:![[thin space (1/6-em)]](https://www.rsc.org/images/entities/char_2009.gif) 4
4![[thin space (1/6-em)]](https://www.rsc.org/images/entities/char_2009.gif) :
:![[thin space (1/6-em)]](https://www.rsc.org/images/entities/char_2009.gif) 1, the molar ratio of glycine to PNCO is 0.8
1, the molar ratio of glycine to PNCO is 0.8![[thin space (1/6-em)]](https://www.rsc.org/images/entities/char_2009.gif) :
:![[thin space (1/6-em)]](https://www.rsc.org/images/entities/char_2009.gif) 1, and the weight of PVP to PNCO is 3 wt%.
1, and the weight of PVP to PNCO is 3 wt%.
In this paper, we investigate the effect of the impregnation process on the electrochemical performance of electrolytic CO2 in cell, and to control the consistency of the other components of the cell, we choose the commercial single cells made by Wuxi Zhongfu New Energy Co. with the cathode material of NiO–YSZ (Y2O3–doped ZrO2), the electrolyte of YSZ, and the anode material of LSC, and the dimensions of the cell are 5 cm × 5 cm. The effective surface area of the cell is 16 cm2, which is used to calculate the current density and area specific resistance. To fully infiltrate the PNCO impregnation solution into the surface of the oxygen electrode of the cell, firstly, 25 μL of the liquid was injected onto the surface of the oxygen electrode of the LSC using a pipette each time and then put into the vacuum drying oven for 1 h. After impregnation, the surface of the single cell is cleaned with ethanol, and finally, the cell is put into the sintering furnace to be heated up to 1000 °C for 2 h. Repeating the above steps several times can result in different infiltration loadings. For ease of description, the LSC composite oxygen electrode with different times of PNCO impregnation is recorded as PNCOλ–LSC (λ = 1, 2, 3), and PNCO1–LSC, PNCO2–LSC, and PNCO3–LSC represent the PNCO–LSC composite oxygen electrode with PNCO impregnated with LSC once, twice, and three times, respectively.
Before the electrolytic CO2 test, Ag paste was screen-printed on the anode side of the cell using a screen printer and baked at 120 °C for 0.5 h as a current collector for electron collection on the anode, with an effective printing area on the anode side of 16 cm2. The single cell was programmed in a high-temperature muffle furnace at a rate of 1 °C min−1 for a temperature increase to 700–800 °C, with a certain amount of nitrogen gas as a protective gas being passed through the cell during the temperature increase.
2.2 Electrochemical characterization of the SOEC
We first passed a certain amount of hydrogen gas for 2 h to reduce NiO to Ni at the cathode, and then we started the test of CO2 electrolysis. CO2 is supplied to the single cell at a flow rate of 128 mL min−1 in the cathode. In the anode, air is used as a sweeping gas at a flow rate of 1280 mL min−1. The current–voltage (I–V) and stability curves were recorded on the Maccor4000 power supply, and the electrochemical impedance spectroscopy (EIS) test data were recorded on the Autolab electrochemical workstation with the test frequency range from 0.01 Hz to 100 kHz. The impedance data were fitted and analyzed using Zview software. The EIS diagram was obtained by testing the cell at open circuit voltage, the test temperature was 700–800 °C, and the gas conditions were consistent with the I–V curve test.2.3 Physicochemical characterization
The crystal structure of PNCO and LSC was investigated by an X-ray diffractometer of D8 Advance (Bruker, Germany). The selected ray in this experiment is the nickel-filtered Cu Kα (λ = 1.5418 Å) radiation with a scanning angle (2θ) of 20–80°, a scanning speed of 2° min−1, and a voltage and current of 40 kV and 40 mA. The scanning electron microscope (SEM) test was carried out by the JEOL 2100F scanning electron microscope, and the surface morphology of LSC and PNCOλ–LSC oxygen electrodes was characterized. FEI Titan Themis 60-300 high-resolution transmission electron microscope (HR-TEM) was used to acquire the oxygen electrode surface image of PNCO2–LSC cell at 300 kV. X-ray photoelectron spectroscopy (XPS) was performed on Thermo K-Alpha to determine the surface composition of the sample, and the XPS data were fitted with Avantage software.3. Results and discussion
3.1 Phase analysis and microstructure
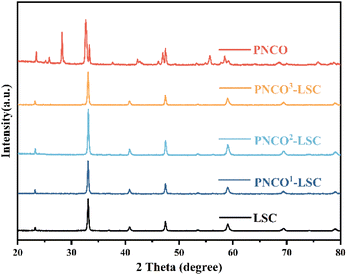
Fig. 1 shows the XRD patterns of PNCO, PNCO1–LSC, PNCO2–LSC, and PNCO3–LSC and gives the comparison diagram with LSC. PNCO calcined at 1000 °C obtains a complete pure phase as reported in the literature. The XRD pattern of PNCO–LSC only shows the characteristic diffraction peaks of PNCO and LSC components, and no other peaks appear. However, the characteristic peaks of PNCO are not clearly observed, which may be due to the small impregnation amount, a larger impregnation amount was used to make it clearer. Fig. S1† shows the XRD pattern of PNCO6–LSC (impregnated six times), and the characteristic peaks of PNCO can be observed. No displacement was observed at the positions of all peaks, and no undesirable phases were produced. The results show that the impregnation component PNCO has good chemical compatibility with the LSC anode.Fig. 2(a)–(d) shows cross-sectional images of PNCO–LSC composite oxygen electrodes under different infiltration loads. The surface of the LSC skeleton before impregnation is smooth, as shown in Fig. 2(a). After infiltrating, the surface begins to become rough. With the increase of impregnation amount, the PNCO distributed on the LSC skeleton surface increases, forming a film covering the LSC surface. Fig. 2(b)–(d) represents the surface micrographs of PNCO–LSC impregnated 1, 2, and 3 times, respectively. The formed PNCO nanofilms significantly increased the surface area of the LSC anode and provided more active sites for oxygen exchange reaction on the surface of the LSC anode.7 However, after three times of impregnation, excessive PNCO infiltration will block the LSC skeleton pores, and reduce the porosity, which is not conducive to gas transport and diffusion. The HR-TEM image of PNCO2–LSC is shown in Fig. 2(e) and (f). The lattice spacing of the PNCO plane is 0.368 nm, which is in good agreement with the orthogonal cell described by the Fmmm space group. The lattice spacing of the (110) planes of the LSC grains is 0.265 nm, confirming the crystal structure of the orthogonal perovskite of LSC. This is consistent with XRD and SEM results, which further verify the infiltration of PNCO on the LSC anode.
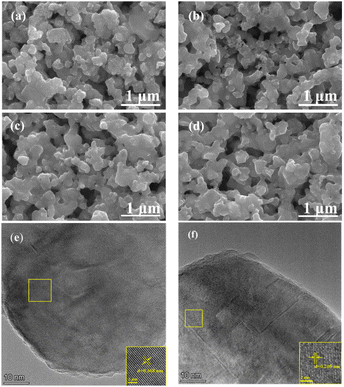 | ||
| Fig. 2 Cross-sectional SEM images of PNCO infiltrated LSC electrode. (a) Bare LSC, (b) PNCO1–LSC, (c) PNCO2–LSC, (d) PNCO3–LSC. HR-TEM image of (e) PNCO, (f) LSC. | ||
3.2 CO2 electrolysis performance
High-temperature SOEC electrolysis CO2 tests were carried out on PNCO–LSC composite oxygen electrode cells with different penetration loadings, and the test results can be shown in Fig. 3. At 700–800 °C, the electrolytic performance of the composite PNCO–LSC oxygen electrode cell is significantly improved compared to the bare LSC single cell. As shown in Fig. 3(d), as the temperature rises, the performance enhancement of the PNCO–LSC oxygen electrode cell compared to the bare LSC becomes increasingly apparent. The current density of bare LSC at 800 °C and 1.5 V is 0.656 A cm−2, and with the increase of impregnation amount, the current density of PNCO2–LSC single cell impregnated twice under the same conditions is 0.917 A cm−2, which is about 40% higher than that of bare LSC single cell.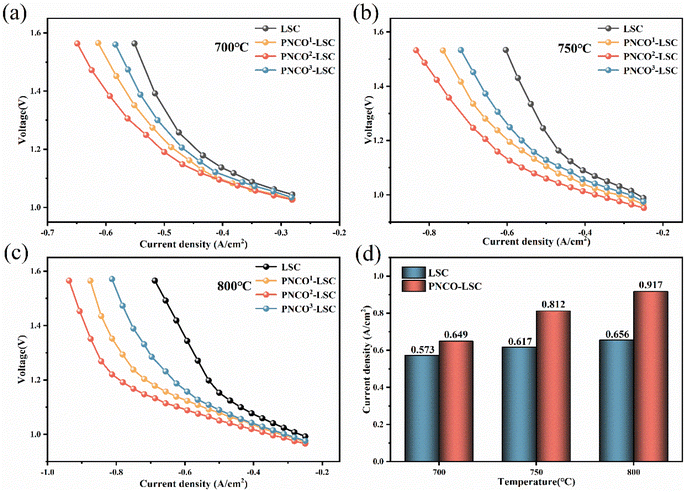 | ||
| Fig. 3 J–V curves of (a) 700 °C, (b) 750 °C, (c) 800 °C, (d) current density of bare LSC and PNCO2–LSC at different temperatures. | ||
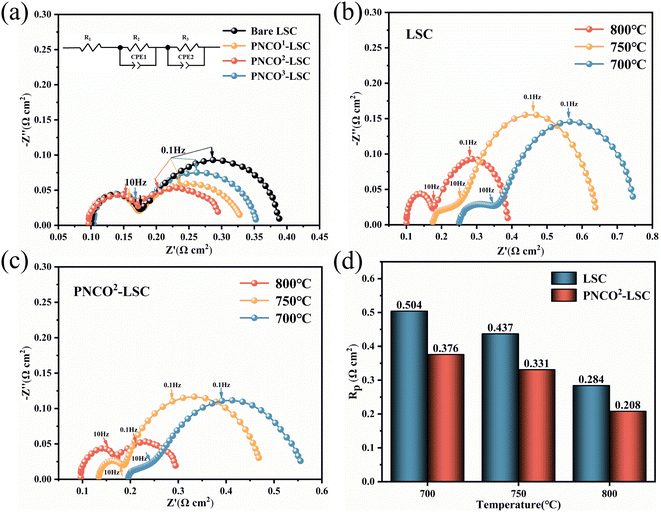
In order to better analyze the effect of infiltrated PNCO on the electrochemical performance of the cells, impedance tests were performed on bare LSC and PNCO–LSC cells, as shown in Fig. 4(a). The fitting analysis was carried out using an equivalent circuit diagram, where the value of R1 represents the ohmic impedance of the cell and the values of R2 and R3 are mainly derived from the gas transport impedance at the surface and interface of the electrode film, collectively known as the polarization impedance of the cell.26,27 From the figure, it is found that the ohmic resistance before and after impregnation does not change much because the electrolyte material and thickness are the same for all cells. Fig. 4(b) and (c) shows the impedances of bare LSC oxygen electrode and PNCO–LSC composite oxygen electrode at different temperatures, respectively. It can be seen that the polarization impedance of the cell decreases with the increase in temperature, which is consistent with the test results of J–V. As shown in Fig. 4(d), the polarization resistance of the cells decreased from 0.284 Ω cm2 for bare LSC to 0.208 Ω cm2 for PNCO2–LSC, which showed excellent electrochemical performance, suggesting that the infiltrated PNCO can improve the OER performance of the electrode in CO2 electrolysis. However, when the number of impregnations reaches three times, the current density decreases to 0.792 A cm−2, which indicates that the best impregnation effect of PNCO–LSC is achieved by impregnating two times, then the electrolytic performance decreases with the increase of impregnation. The reason for the decrease in electrolytic performance may be that with the increase in impregnation, the skeleton on the oxygen electrode side is encapsulated by permeable PNCO nanofilm, resulting in the blockage of the pores which in turn hinders the diffusion of gases, ultimately leading to the decrease in electrolytic performance.
3.3 Performance stability
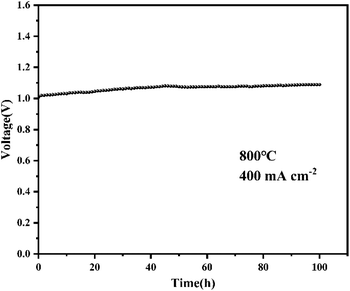
To test the cell stability of the PNCO–LSC composite oxygen electrode, the cell was tested for 100 h at 800 °C with a feedstock gas composition of air 1280 cm min−1, CO2 128 cm min−1 and H2 20 cm min−1 at a constant current density of 0.4 A cm−2. The test results are shown in Fig. 5: it can be found that in the first half of the electrolysis stage, the test voltage rises slightly, and the second half is stable and the decay rate of the cell decreases significantly. In the 100 h CO2 electrolysis process, the test voltage from the initial 1.017 V to 1.088 V at 100 h, the voltage decay rate is 7.1 × 10⁻⁴ V h−1, and the long-term stability of the cell is relatively excellent. In order to study the impact of impregnation on the long-term stability of the cell, the bare LSC cell was tested under the same working conditions. The test results are shown in Fig. S2,† it can be found that the voltage rose slightly in the first half of the electrolytic stage, while the second half was relatively stable. In the 100 h stability test, the voltage rises from 1.083 V to 1.194 V, and the voltage decay rate is 1.11 × 10⁻³ V h−1. By comparing the decay rate of the cell voltage, it can be found that the long-term stability of the cell after impregnation is significantly enhanced.3.4 Enhancement mechanism
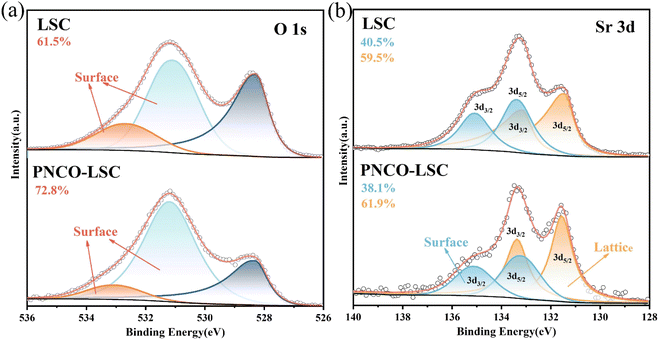
To investigate the reasons for the improved electrochemical performance of LSC oxygen electrodes after PNCO infiltration, X-ray photoelectron spectroscopy (XPS) analysis was performed on the surface of the bare LSC and PNCO2–LSC oxygen electrodes. Before analyzing the chemical state of elements, the binding energy of C 1s was first calibrated to 284.8 eV. Fig. 6(a) shows the XPS spectrum of O 1s: the XPS spectrum of O 1s can be divided into three fitting peaks, which are surface adsorbed oxygen, vacancy oxygen, and lattice oxygen, according to the binding energy from high to low. The spectral peaks of binding energy at 532.7–533.1 eV belongs to surface-adsorbed oxygen, and binding energy at 531.0–531.2 eV belongs to vacancy oxygen. The two can be collectively referred to as adsorbed oxygen (Oads), and the peak binding energy at 528.4 eV is attributed to lattice oxygen (Olat).28–30 The relative percentage content of Oads and Olat in LSC and PNCO2–LSC and the ratio between them are shown in Table 1. It can be seen from the table that the contents of Oads and Olat varied significantly with impregnated PNCO, with the ratio of Oads to Olat increasing from 1.6 for LSC to 2.67 for PNCO2–LSC. The increase in the relative content of Oads is conducive to the improvement of OER.18 Fig. 6(b) shows the XPS spectrum of Sr 3d: the XPS spectrum of Sr 3d could be split into two pairs of peaks, Sr 3d5/2 and Sr 3d3/2. The two peaks with binding energies of 133.4 eV and 135.1 eV belong to Sr 3d3/2 and are high energy Sr. Also known as surface Sr.31 The two peaks of binding energy at 131.7 eV and 133.6 eV are Sr 3d5/2, which is low-energy Sr. The Sr of the low-energy component may be related to Sr in the perovskite lattice, so it is lattice Sr.32 As can be seen from the figure, the relative percentage content of surface (high-energy component) Sr in PNCO2–LSC is 38.1%. It is significantly lower than 40.5% of LSC. In the long-term SOEC electrolysis of CO2, the increase of high-energy Sr components often leads to the loss of oxygen exchange activity and a decrease in performance.33 From this point of view, by infiltrating PNCO into LSC to form a PNCO–LSC composite oxygen electrode, segregation of Sr on the electrode surface is reduced, which is conducive to restoring partial oxygen exchange activity and improving electrode stability.| Oads | Olat | Oads/Olat | |
|---|---|---|---|
| LSC | 0.615 | 0.385 | 1.60 |
| PNCO2–LSC | 0.728 | 0.272 | 2.67 |
The conductivity, oxygen diffusion coefficient, and oxygen surface exchange coefficient of the material all influence the OER activity of the oxygen electrode.34–36 Both LSC and PNCO are ion-electron hybrid conductor materials. LSC has better conductivity as an anode material compared to PNCO. As a typical R–P type material, PNCO has a much better oxygen diffusion coefficient and oxygen surface exchange coefficient than LSC material, which has great advantages in oxygen ion conduction.37 Combining the advantages of PNCO material and LSC material, PNCO–LSC composite oxygen electrodes can significantly improve the performance of cell electrodes. Fig. 7 shows the schematic diagram of PNCO impregnating the LSC oxygen electrode. By infiltrating PNCO into the LSC oxygen electrode, a nanofilm is formed on the surface of the LSC. The formed PNCO nanofilm significantly increased the surface area of the LSC oxygen electrode and provided more active sites for the oxygen exchange reaction on the surface of the LSC anode, thus enhancing the OER performance of the electrode and improving the electrochemical performance of the cell.
4. Conclusions
In summary, a series of PNCOλ–LSC composite oxygen electrodes were constructed by impregnating PNCO onto the surface of LSC oxygen electrodes, and the electrochemical performances were greatly improved, proving that the OER performances were greatly enhanced. Under the conditions of 800 °C and 1.5 V, the current density of the PNCO2–LSC composite oxygen electrode obtained by two impregnations reaches 0.917 A cm−2, which is about 40% higher than that of the bare LSC oxygen electrode. In the 100 h long-term stability test, the cell did not significantly degrade. Electrochemical performance tests and related physicochemical characterization showed that the improvement of electrochemical performance after PNCO infiltration into LSC was mainly due to the improvement of surface oxygen exchange activity and the enhancement of surface oxygen overflow capacity. This study demonstrated that the use of PNCO-infiltrated LSC to form a composite oxygen electrode material can effectively improve the performance of SOEC electrolysis of CO2, and has a good application prospect.Conflicts of interest
There are no conflicts to declare.Acknowledgements
This work was partly supported by the Transformational Technologies for Clean Energy and Demonstration Strategic Priority Research Program of the Chinese Academy of Sciences (XDA2100000), the Major Science and Technology Projects of China National Offshore Oil Corporation Limited during the 14th Five Year Plan (KJGG-2022-12-CCUS-030500), the Industrial Fund of Shanghai Institute of Applied Physics, Chinese Academy of Sciences (1124100602).References
- W. Zhang and B. Yu, J. Electrochem., 2020, 26, 212–229 CAS.
- H. X. Li, W. H. Wang, L. C. Wang, M. Wang, K. Y. Park, T. Lee, A. Heyden, D. Ding and F. L. Chen, ACS Appl. Mater. Interfaces, 2023, 15, 43732–43744 CrossRef CAS PubMed.
- A. Hauch, R. Kungas, P. Blennow, A. B. Hansen, J. B. Hansen, B. V. Mathiesen and M. B. Mogensen, Science, 2020, 370, eaba611 CrossRef PubMed.
- S. Lee, M. Kim, K. T. Lee, J. T. S. Irvine and T. H. Shin, Adv. Energy Mater., 2021, 11, 2100339 CrossRef CAS.
- C. Yang, Y. Tian, J. Pu and B. Chi, ACS Sustainable Chem. Eng., 2022, 10, 1047–1058 CrossRef CAS.
- Y. Song, X. Zhang, Y. Zhou, Q. Jiang, F. Guan, H. Lv, G. Wang and X. Bao, Energy Storage Mater., 2018, 13, 207–214 CrossRef.
- Y. Liu, J. Shuang, X. Tong, S. Yang, Y. Yang and M. Wei, Electrochim. Acta, 2019, 298, 852–857 CrossRef CAS.
- Z. Sun, W. Fan, Y. Bai, K. Wu and Y. Cheng, ACS Appl. Mater. Interfaces, 2021, 13, 29755–29763 CrossRef CAS PubMed.
- X. Tong, S. Ovtar, K. Brodersen, P. V. Hendriksen and M. Chen, J. Power Sources, 2020, 451, 227742 CrossRef CAS.
- W. Wang, W. Liu, M. Kamiko and S. Yagi, New J. Chem., 2022, 46, 13082–13088 RSC.
- K.-J. Lee, M.-J. Lee, S.-h. Park and H.-J. Hwang, J. Korean Ceram. Soc., 2016, 53, 489–493 CrossRef CAS.
- J. Zan, S. Wang, D. Zheng, F. Li, W. Chen, Q. Pei and L. Jiang, Mater. Res. Bull., 2021, 137, 111173 CrossRef CAS.
- J.-W. Zhao, Z.-X. Shi, C.-F. Li, Q. Ren and G.-R. Li, ACS Mater. Lett., 2021, 3, 721–737 CrossRef CAS.
- E. H. Da'as, J. T. S. Irvine, E. Traversa and S. Boulfrad, ECS Trans., 2013, 57, 1851 CrossRef.
- P. Blaszczak, A. Mizera, B. Bochentyn, S.-F. Wang and P. Jasinski, Int. J. Hydrogen Energy, 2022, 47, 1901–1916 CrossRef CAS.
- H. Lv, Y. Zhou, X. Zhang, Y. Song, Q. Liu, G. Wang and X. Bao, J. Energy Chem., 2019, 35, 71–78 CrossRef.
- J.-C. Grenier, A. Flura, S. Dru, C. Nicollet, V. Vibhu, S. Fourcade, A. Rougier, J.-M. Bassat, A. Brevet and J. Mougin, ECS Trans., 2013, 57, 1771 CrossRef.
- Y. Liu, Y. Tian, Y. Wang, Y. Li, J. Pu, F. Ciucci and B. Chi, Electrochim. Acta, 2022, 430, 141032 CrossRef CAS.
- P. Ding, W. Li, H. Zhao, C. Wu, L. Zhao, B. Dong and S. Wang, JPhys Mater., 2021, 4, 022002 CrossRef CAS.
- M. Garali, M. Kahlaoui, B. Mohammed, A. Mater, C. ben Azouz and C. Chefi, Int. J. Hydrogen Energy, 2019, 44, 11020–11032 CrossRef CAS.
- M. Ghamarinia, A. Babaei and C. Zamani, Electrochim. Acta, 2020, 353, 136520 CrossRef CAS.
- Z. Li, P. Shan, W. Tang, Q. Ni, B. Qian, S. Wang, Y. Zheng, L. Ge, H. Chen and C. Zhang, J. Alloys Compd., 2023, 932, 167646 CrossRef CAS.
- J. Bai, Z. Han, D. Zhou, X. Zhu, N. Wang, R. Chen, J. He and W. Yan, Int. J. Hydrogen Energy, 2023, 48, 6076–6087 CrossRef CAS.
- V. Vibhu, I. C. Vinke, R. A. Eichel and L. G. J. de Haart, J. Power Sources, 2021, 482, 228909 CrossRef CAS.
- C. Berger, E. Bucher, A. Egger, A. T. Strasser, N. Schroedl, C. Gspan, J. Hofer and W. Sitte, Solid State Ionics, 2018, 316, 93–101 CrossRef CAS.
- Z. Lyu, H. Li, M. Han, Z. Sun and K. Sun, J. Power Sources, 2022, 538, 231569 CrossRef CAS.
- K. Tan, X. Yan, Z. Zhu, M. Zhou, F. Tian and J. Liu, Int. J. Hydrogen Energy, 2022, 47, 25090–25103 CrossRef CAS.
- Q. Liu, R. Li, W. Feng, J. Li, X. Zhang, H. Lv, Y. Shen, Y. Song, G. Wang and X. Bao, ACS Appl. Energy Mater., 2022, 5(9), 11604–11612 CrossRef CAS.
- P. Li, R. Dong, R. Wang, T. Shao, F. Yan, P. Zhang, D. Fu and R. Wang, ACS Sustainable Chem. Eng., 2021, 9, 13582–13594 CrossRef CAS.
- K. Yang, Y. Wang, L. Jiang, Y. Jin and Z. Yang, Int. J. Hydrogen Energy, 2023, 48, 27464–27472 CrossRef CAS.
- A. Nenning, A. K. Opitz, C. Rameshan, R. Rameshan, R. Blume, M. Haevecker, A. Knop-Gericke, G. Rupprechter, B. Kloetzer and J. Fleigt, J. Phys. Chem. C, 2016, 120, 1461–1471 CrossRef CAS PubMed.
- D. Tripkovic, R. Kungas, M. B. Mogensen and P. V. Hendriksen, Phys. Chem. Chem. Phys., 2020, 22, 15418–15426 RSC.
- M. Y. Lu, J. G. Railsback, H. Wang, Q. Liu, Y. A. Chart, S.-L. Zhang and S. A. Barnett, J. Mater. Chem. A, 2019, 7, 13531–13539 RSC.
- P. M. Geffroy, L. Guironnet, H. J. M. Bouwmeester, T. Chartier, J. C. Grenier and J. M. Bassat, J. Eur. Ceram. Soc., 2019, 39, 59–65 CrossRef CAS.
- M. V. Ananyev, N. M. Porotnikova and E. K. Kurumchin, Solid State Ionics, 2019, 341, 115052 CrossRef CAS.
- J. Ascolani-Yael, A. Montenegro-Hernandez, L. C. Baque, L. M. Toscani, A. Caneiro and L. V. Mogni, J. Electrochem. Soc., 2022, 169, 034514 CrossRef CAS.
- V. Vibhu, I. C. Vinke, R. A. Eichel, J. M. Bassat and L. G. J. de Haart, J. Power Sources, 2019, 444, 227292 CrossRef CAS.
Footnote |
| † Electronic supplementary information (ESI) available. See DOI: https://doi.org/10.1039/d4ra01848f |
| This journal is © The Royal Society of Chemistry 2024 |

