 Open Access Article
Bishydrazone ligand and its Zn-complex: synthesis, characterization and estimation of scalability inhibition mitigation effectiveness for API 5L X70 carbon steel in 3.5% NaCl solutions†
Ola. A. El-Gammala,
Dina A. Saada,
Marwa N. El-Nahassb,
Kamal Shalabi *c and
Yasser M. Abdallah
 *d
*d
aChemistry Department, Faculty of Science, Mansoura University, Mansoura 35111, Egypt
bDepartment of Chemistry, Faculty of Science, Tanta University, Tanta 31527, Egypt
cDepartment of Chemistry, College of Science and Humanities in Al-Kharj, Prince Sattam Bin Abdulaziz University, Al-Kharj 11942, Saudi Arabia. E-mail: k.shalabi@psau.edu.sa
dDelta University for Science and Technology, Gamasa, Mansoura, 11152, Egypt. E-mail: dr.ymostafa8@gmail.com; Yasser_mostafa@deltauniv.edu.eg
First published on 23rd April 2024
Abstract
Bishydrazone ligand, 2,2′-thiobis(N′-((E)-thiophen-2-ylmethylene) acetohydrazide), H2TTAH and its Zn- complex were prepared and characterized through elemental analysis and various spectroscopic performances as well as (IR, 1H and 13C NMR, mass and (UV-Vis) measurements. The synthesized complex exhibited the molecular formula [Zn2(H2TTAH)(OH)4(C5H5N)3C2H5OH] (Zn-H2TTAH). To assess their potential as anti-corrosion materials, the synthesized particles were assessed for their effectiveness for API 5L X70 C-steel corrosion in a 3.5% NaCl solution using electrochemical methods such as potentiodynamic polarization (PP) and electrochemical impedance spectroscopy (EIS). Additionally, X-ray photoelectron spectroscopy (XPS) was employed to examine the steel surface treated with the tested inhibitors, confirming the establishment of an adsorbed protecting layer. The results obtained from the PP plots indicated that both H2TTAH and Zn-H2TTAH act as mixed-type inhibitors. At a maximum concentration of 1 × 10⁻⁴ M, H2TTAH and Zn-H2TTAH exhibited inhibition efficiencies of 93.4% and 96.1%, respectively. The adsorption of these inhibitors on the steel surface followed the Langmuir adsorption isotherm, and it was determined to be chemisorption. DFT calculations were achieved to regulate the electron donation ability of H2TTAH and Zn-H2TTAH molecules. Additionally, Monte Carlo (MC) simulations were conducted to validate the adsorption configurations on the steel surface and gain insight into the corrosion inhibition mechanism facilitated by these molecules.
1. Introduction
Every year, corrosion causes significant global repercussions as metallic materials deteriorate due to various chemical, biological, and electrochemical processes when they interact with their environment.1 Carbon steel is commonly utilized in manufacturing according to its superior mechanical properties, robust tensile strength, and cost-effectiveness,2 however, when exposed to saline solutions, such as cooling liquids, prompt intervention becomes necessary due to significant corrosion issues.3 Inorganic and organic substances have been explored as potential inhibitors for protecting metals and alloys. Organic molecules often contain functional groups like –C![[double bond, length as m-dash]](https://www.rsc.org/images/entities/char_e001.gif) N, –C
N, –C![[double bond, length as m-dash]](https://www.rsc.org/images/entities/char_e001.gif) O, –C
O, –C![[double bond, length as m-dash]](https://www.rsc.org/images/entities/char_e001.gif) S, etc., which form covalent bonds involving elements like nitrogen, sulfur, and/or oxygen.4 Molecules with such characteristics exhibit good inhibitive qualities as they adhere well to steel surfaces, blocking active sites and reducing corrosion rates.5 The ability of sulfur (S) and nitrogen (N) atoms to form densely confined stable complexes within the coordination range of metal particles has been reported, making them intriguing components for corrosion studies.6 Transition metal complexes have found extensive applications in various fields, including electrocatalysis,7 sensing materials,8 biological probes,9 and catalysts.10 Studies on metal complexes containing heterocyclic ligands11,12 and Schiff bases13,14 have demonstrated their inhibitory efficacy against corrosion in acidic environments. Mahdavian et al.15 also reported the effectiveness of diverse transition-metal complexes of acetylacetonate in protecting against corrosion. Furthermore, these researchers examined the impact of ligand size on mild steel's resistance to corrosion in zinc complexes.16
S, etc., which form covalent bonds involving elements like nitrogen, sulfur, and/or oxygen.4 Molecules with such characteristics exhibit good inhibitive qualities as they adhere well to steel surfaces, blocking active sites and reducing corrosion rates.5 The ability of sulfur (S) and nitrogen (N) atoms to form densely confined stable complexes within the coordination range of metal particles has been reported, making them intriguing components for corrosion studies.6 Transition metal complexes have found extensive applications in various fields, including electrocatalysis,7 sensing materials,8 biological probes,9 and catalysts.10 Studies on metal complexes containing heterocyclic ligands11,12 and Schiff bases13,14 have demonstrated their inhibitory efficacy against corrosion in acidic environments. Mahdavian et al.15 also reported the effectiveness of diverse transition-metal complexes of acetylacetonate in protecting against corrosion. Furthermore, these researchers examined the impact of ligand size on mild steel's resistance to corrosion in zinc complexes.16
Hydrazone compounds containing the azomethine group ‘–CH![[double bond, length as m-dash]](https://www.rsc.org/images/entities/char_e001.gif) N–, have gained significant interest in both combinatorial and medicinal chemistry.17,18 Their ability to coordinate with ions, adaptability to assume diverse configurations, and consequent applicability in spectrophotometric measurement of transition metals highlight their importance. These compounds can coordinate with metals in either a neutral or anionic state.19 The presence of multiple donor positions, for example –NNO, in their chemical structure enhances their resistance and limits corrosion damage, making their coordination complexes uniquely designed.20 Notably, hydrazones have been widely explored as corrosion inhibitors, as evidenced by the popularity of their use in the literature.21–23 Given this, we decided to investigate the potential of a derivative of hydrazone as a potent inhibitor of steel disintegration in corrosive, acidic environments.24 While measuring inhibition effectiveness traditionally relies on experimental techniques such as chemical and electrochemical methods,25 relying solely on these techniques can make it challenging to precisely understand the processes occurring between the metal surface and the investigated compound.26
N–, have gained significant interest in both combinatorial and medicinal chemistry.17,18 Their ability to coordinate with ions, adaptability to assume diverse configurations, and consequent applicability in spectrophotometric measurement of transition metals highlight their importance. These compounds can coordinate with metals in either a neutral or anionic state.19 The presence of multiple donor positions, for example –NNO, in their chemical structure enhances their resistance and limits corrosion damage, making their coordination complexes uniquely designed.20 Notably, hydrazones have been widely explored as corrosion inhibitors, as evidenced by the popularity of their use in the literature.21–23 Given this, we decided to investigate the potential of a derivative of hydrazone as a potent inhibitor of steel disintegration in corrosive, acidic environments.24 While measuring inhibition effectiveness traditionally relies on experimental techniques such as chemical and electrochemical methods,25 relying solely on these techniques can make it challenging to precisely understand the processes occurring between the metal surface and the investigated compound.26
In this investigation, we aimed to assess the effectiveness of a hydrazone derivative and its zinc complex as efficient inhibitors for corrosion on the surface of X70 steel in 3.5% NaCl solutions. The evaluation was carried out with electrochemical techniques, specifically potentiodynamic polarization (PP) and electrochemical impedance spectroscopy (EIS). Additionally, the establishment of a protecting film adsorbed on the steel surface was established by X-ray photoelectron spectroscopy (XPS). To increase more perceptions into the adsorption performance and inhibition mechanisms of the H2TTAH and Zn-H2TTAH molecules on Fe (1 1 0), we employed Monte Carlo (MC) simulations and density functional theory (DFT) calculations. The goal was to compare the empirical results obtained from experimental techniques with computational findings. Remarkably, a high degree of agreement was observed between the two approaches. The combination of experimental and computational approaches allowed for a comprehensive considerate of the adsorption behavior and mechanisms of inhibition of the hydrazone derivative and its zinc complex on the Fe (1 1 0) surface. This holistic approach enhances our knowledge of the corrosion inhibition progression and affords appreciated perceptions for the design of effective corrosion inhibitors.
2. Materials and methods
2.1. Composition of material models
In this paper, we utilized a model of API 5L X70 carbon steel, which has the following basic composition in weight percent (wt%): C 0.026, Mn 1.51, Si 0.10, S 0.02, N 0.27, Ni 0.16, Al 0.35, Cr 0.27, Cu 0.28, Nb 0.93, Ti 0.11, and the remaining Fe.To investigate the corrosion behavior of the carbon steel, we conducted electrochemical methods on a carbon steel disc. The disc was mounted in a Teflon tube, with an exposed area of 1 cm2, enabling it to interact with the corrosive medium. For the corrosive solutions, reagent-grade solutions were prepared and diluted to obtain 3.5% NaCl solutions.
By subjecting the carbon steel sample to electrochemical methods in these corrosive solutions, we aimed to analyze and evaluate its corrosion resistance and behavior.
2.2. Inhibitors
Infrared (IR) spectra of the samples were obtained using KBr discs in the range of 4000–400 cm−1. A Mattson 5000 FTIR spectrophotometer was employed for this purpose. Electronic spectra were measured using a Unicam UV-Vis spectrophotometer UV2.
The magnetic susceptibility of the samples at 298 K was evaluated using a Sherwood scientific magnetic susceptibility balance.
Nuclear magnetic resonance (NMR) spectra were recorded using CDCl3 or DMSO-d6 as the internal reference and solvent, respectively. A Varian V NMR 400 spectrometer performing at 400 MHz for 1H and 101 MHz for 13C nuclei was used for NMR analysis.
Electrospray ionization (ESI) mass spectra were obtained using an Orbitrap mass spectrometer manufactured by Thermo Scientific (Rockford, IL, USA).
Thermogravimetric analysis (TGA) and differential thermal analysis (DTA) measurements were achieved using a DTG-50 Shimadzu thermogravimetric analyzer. The measurements were carried out in a nitrogen atmosphere with a flow rate of 15 ml min−1, and the temperature was amplified at a rate of 10 °C min−1.
Electron spin resonance (ESR) spectra were recorded employing a powder ESR spectrometer operating at X-band (9.78 GHz) with a modulation frequency of 100 kHz. The measurements were conducted in a 2 mm quartz capillary at ambient temperature using a Bruker EMX spectrometer.
![[double bond, length as m-dash]](https://www.rsc.org/images/entities/char_e001.gif) O)), 1597 (s, ν(C
O)), 1597 (s, ν(C![[double bond, length as m-dash]](https://www.rsc.org/images/entities/char_e001.gif) C)ph), 1563(s,ν (C
C)ph), 1563(s,ν (C![[double bond, length as m-dash]](https://www.rsc.org/images/entities/char_e001.gif) N)azo), 1641 (s,ν (C
N)azo), 1641 (s,ν (C![[double bond, length as m-dash]](https://www.rsc.org/images/entities/char_e001.gif) N*)azo) 1230(s, ν(C–O)), 1316 (s, δ(OH)), 1132 (s, ν(N–N)),854, 772, 686(s,ν(C–S)thiophen), 706(s, ν(C–S–C); 1H NMR (400 MHz, dmso) δ: 11.53 (d, J = 11.3 Hz, 1H), 11.49 (d, J = 16.1 Hz, 1H), 8.39 (d, J = 5.5 Hz, 1H), 8.17 (d, J = 12.6 Hz, 1H), 7.44–7.39 (m, 4H), 7.13–7.09 (m, 6H), 3.74(dd, J = 14.4, 1.5 Hz, 2H), 3.37–3.34 ppm (m, 2H); 13C NMR (101 MHz, dmso) δ 170.28, 165.05, 142.05, 138.91, 131.02, 130.32, 130.22, 128.95, 128.91, 128.87, 127.83, 39.93, 33.82,32.38, 32.04, MS (ESI) m/z = 366.31 (M+ + H).
N*)azo) 1230(s, ν(C–O)), 1316 (s, δ(OH)), 1132 (s, ν(N–N)),854, 772, 686(s,ν(C–S)thiophen), 706(s, ν(C–S–C); 1H NMR (400 MHz, dmso) δ: 11.53 (d, J = 11.3 Hz, 1H), 11.49 (d, J = 16.1 Hz, 1H), 8.39 (d, J = 5.5 Hz, 1H), 8.17 (d, J = 12.6 Hz, 1H), 7.44–7.39 (m, 4H), 7.13–7.09 (m, 6H), 3.74(dd, J = 14.4, 1.5 Hz, 2H), 3.37–3.34 ppm (m, 2H); 13C NMR (101 MHz, dmso) δ 170.28, 165.05, 142.05, 138.91, 131.02, 130.32, 130.22, 128.95, 128.91, 128.87, 127.83, 39.93, 33.82,32.38, 32.04, MS (ESI) m/z = 366.31 (M+ + H).
2.3. Electrochemical measurements
The electrochemical workstation CS350's potentiostat/Galvanostat with three electrodes was employed. The API 5L X70 class was used to construct the carbon steel working electrode, which had a 1 cm2 surface area and was situated extremely near to the reference electrode to reduce the IR drop. The electrode was abraded using emery sheets formerly each trial. Thereafter, the electrode was successively cleansed with ethanol through ultrasonic bath, followed by a rinsing with distilled water. An Ag/AgCl reference electrode was taken into consideration while limiting the potential of the working electrode. A 1 cm2 platinum sheet was used as the counter electrode. Following thirty minutes of the working electrode being submerged in the test solution, open circuit potential (OCP) that is steady being attained. The Tafel polarization diagrams were acquired by combining several electrodes under potentiodynamic circumstances comparable to 1 mV s−1 (sweep rate) in an environment of air. All measurements were made at 25 ± 1 °C using a carbon steel electrode in solutions including 3.5% NaCl, with and without various dosages of the investigated substances. From eqn (1), the inhibitory effectiveness (%η) and surface exposure (θ) were intended:
 | (1) |
The terms “icorr(free)” and “icorr(inh)” refer to the corrosion current densities with and without different dosages of investigated compounds, respectively.
The cell used for the polarization experiments was also utilized for the electrochemical impedance spectroscopy (EIS) results. The EIS calculations were accomplished with a perturbed signal amplitude of 10 mV over a frequency variety of 0.01 Hz to 100 kHz. Eqn (2) was applied to assess the inhibitory competence (%η) and surface coverage (θ) of the molecules under investigation.
 | (2) |
The charge transfer resistance values, denoted as Roct and Rct, characterize the resistance in presence and without the inhibitor doses, correspondingly.
2.4. Surface investigations (X-ray photoelectron spectroscopy (XPS))
The high-resolution X-ray photoelectron spectroscopy (XPS) analyses of inhibited API 5L X70 C-steel samples in 3.5% NaCl solution with 1 × 10⁻⁴ M of H2TTAH and Zn-H2TTAH at 25 ± 1 °C were shown using Thermo Fisher Scientific's K-ALPHA (Thermo Fisher Scientific, USA).2.5. Theoretical computations
Density Functional Theory (DFT) computations were achieved by applying the Dmol3 module within the BIOVIA Materials Studio software, version 2017. The methodological approach incorporated B3LYP functional coupled with DNP 4.4 basis set. These analytical procedures centered on the optimization of the total energy of both H2TTAH and Zn-H2TTAH molecules under aqueous conditions.28 The results of DFT calculations were considered and determined as follows in the next calculations,29 taking into account the dipole moment (μ), the energy gap (ΔE), electronegativity (χ), chemical hardness (η), global softness (σ), electrophilicity index (ω), the number of electrons transported (ΔN) and back-donation energy (Eback-donation)
 | (3) |
 | (4) |
 | (5) |
 | (6) |
 | (7) |
The function work of Fe (1 1 0) is represented by φ, while the inhibitor electronegativity is denoted by χinh. ηFe and ηinh represent the chemical hardness of Fe (0 eV) and the investigated compounds, respectively. To ascertain the most optimal configurations for adsorption of H2TTAH and Zn-H2TTAH molecules on the Fe (1 1 0) surface, the adsorption locator module within Materials Studio version 2017 was employed. This assessment utilized the COMPASS force field to refine the molecular structure of the adsorbates.30 Subsequently, a computational representation involving the interaction of H2TTAH and the Zn-H2TTAH molecules as well as Cl− ions, H3O+ ions, and H2O particles with the Fe (1 1 0) surface was executed within a dimension of a simulation box of 37.24 Å × 37.24 Å × 59.81 Å.
3. Results and discussion
3.1. Investigated inhibitors characterization
The proposed structural formulae were decided on the basis of the collected elemental and spectral measurements (Table 2). The molar conductivity of the Zn(II) chelates (Λm = 5.09 ohm−1 cm2 mol−1) signifying non-electrolytic feature.| Compound | M.wt | Color | M.p | Found (calc.) % | Yield % | ||||
|---|---|---|---|---|---|---|---|---|---|
| C% | H% | N% | M% | Cl% | |||||
| H2TTAH C14H14N4O2S3 | 366.31 (366.47) | Yellowish white | 210 | 45.82 (45.88) | 3.82 (3.85) | 15.26 (15.28) | — | — | 80 |
| [Zn2(H2TTAH)(OH)4(C5H5N)3C2H5OH] Zn2C31H39N7O7S3 | 848.461 | Yellowish white | 180 | 43.87 (44.04) | 4.04 (4.24) | 11.55 (11.17) | — | 15.40 (15.00) | 68 |
![[thin space (1/6-em)]](https://www.rsc.org/images/entities/char_2009.gif) :
:![[thin space (1/6-em)]](https://www.rsc.org/images/entities/char_2009.gif) 2 molar ratio, revealed by a doublet band observed at 1686 and 1641 cm−1 due to the stretching vibration mode of the (C
2 molar ratio, revealed by a doublet band observed at 1686 and 1641 cm−1 due to the stretching vibration mode of the (C![[double bond, length as m-dash]](https://www.rsc.org/images/entities/char_e001.gif) O) group31 which is supported by two signals in the 1H NMR (in DMSO-d6) spectrum (S.2a) of the ligand assignable to the keto form (1a) at 11.45 ppm (NH), 8.14 ppm (azomethine protons), and 3.74 ppm (–COCH2–S– protons) and at 11.52 ppm (C(OH)
O) group31 which is supported by two signals in the 1H NMR (in DMSO-d6) spectrum (S.2a) of the ligand assignable to the keto form (1a) at 11.45 ppm (NH), 8.14 ppm (azomethine protons), and 3.74 ppm (–COCH2–S– protons) and at 11.52 ppm (C(OH)![[double bond, length as m-dash]](https://www.rsc.org/images/entities/char_e001.gif) N proton), a more deshielded azomethine proton at 8.17, and a more shielded S–CH2 group at 3.75 ppm arised due to those characteristic for enol form (1b). In addition to the duplication of signals of all hydrogen as those due to the aromatic protons appeared as two multiplets at 7.39 and 7.65 ppm. In addition, the two signals observed at 170.28 (C(OH)
N proton), a more deshielded azomethine proton at 8.17, and a more shielded S–CH2 group at 3.75 ppm arised due to those characteristic for enol form (1b). In addition to the duplication of signals of all hydrogen as those due to the aromatic protons appeared as two multiplets at 7.39 and 7.65 ppm. In addition, the two signals observed at 170.28 (C(OH)![[double bond, length as m-dash]](https://www.rsc.org/images/entities/char_e001.gif) N carbon) and 170.12 (C
N carbon) and 170.12 (C![[double bond, length as m-dash]](https://www.rsc.org/images/entities/char_e001.gif) O, carbon) ppm, with the duplication of the other signals in the 13C spectra of the ligand H2TTAH (S.2b) are further evidence for the suggestion of such tautomerization of H2TTAH in solutions. This remains more established by the DFT molecular model of the ligand as the two suggested isomers revealing a significant variation in the total energy between keto (3997.53 kcal mol−1) and enol (4007.38 kcal mol−1) forms, respectively. The band at 1532 cm−1 is characteristic for ν(C
O, carbon) ppm, with the duplication of the other signals in the 13C spectra of the ligand H2TTAH (S.2b) are further evidence for the suggestion of such tautomerization of H2TTAH in solutions. This remains more established by the DFT molecular model of the ligand as the two suggested isomers revealing a significant variation in the total energy between keto (3997.53 kcal mol−1) and enol (4007.38 kcal mol−1) forms, respectively. The band at 1532 cm−1 is characteristic for ν(C![[double bond, length as m-dash]](https://www.rsc.org/images/entities/char_e001.gif) N)azomethine vibration undergoes a blue shift upon complex formation. The two bands at 1597 and 1132 cm−1 are due to ν(C
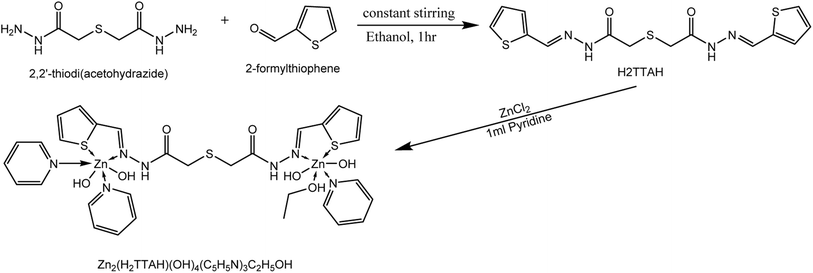
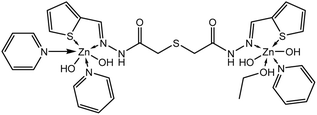
N)azomethine vibration undergoes a blue shift upon complex formation. The two bands at 1597 and 1132 cm−1 are due to ν(C![[double bond, length as m-dash]](https://www.rsc.org/images/entities/char_e001.gif) C)ph and ν(N–N) modes of vibration. The broad band detected at 3226 and a shoulder joint at 3215 cm−1 of the two isomers are ascribed to ν(NH) vibration of the two systems in the solid-state.31 The band at 686 cm−1 is attributed to ν(C–S)thiophen whereas that at 706 cm−1 is attributed to ν(C–S–C) vibrational mode. These bands undergo shift and a new peak corresponding to ν(M–S) appeared as the combination of S-thiophene moiety in coordination occurred 31.H2TTAH acted as a NNSS-neutral tetradentate in [Zn2(TTAH)(OH)2(C5H5N)2(C2H5OH)2] complex (structure 2) where it bounded to two Zn(II) ions via the two azomethin-N and the two thiophene-S atoms.
C)ph and ν(N–N) modes of vibration. The broad band detected at 3226 and a shoulder joint at 3215 cm−1 of the two isomers are ascribed to ν(NH) vibration of the two systems in the solid-state.31 The band at 686 cm−1 is attributed to ν(C–S)thiophen whereas that at 706 cm−1 is attributed to ν(C–S–C) vibrational mode. These bands undergo shift and a new peak corresponding to ν(M–S) appeared as the combination of S-thiophene moiety in coordination occurred 31.H2TTAH acted as a NNSS-neutral tetradentate in [Zn2(TTAH)(OH)2(C5H5N)2(C2H5OH)2] complex (structure 2) where it bounded to two Zn(II) ions via the two azomethin-N and the two thiophene-S atoms.
| Compound | ν (OH) | ν (NH) | ν (C![[double bond, length as m-dash]](https://www.rsc.org/images/entities/char_e001.gif) O) O) |
ν (C![[double bond, length as m-dash]](https://www.rsc.org/images/entities/char_e001.gif) N)* N)* |
ν (C![[double bond, length as m-dash]](https://www.rsc.org/images/entities/char_e001.gif) N)azo N)azo |
ν (C–O) | ν (N–N) | ν (C–S)thio | ν (M–O) | ν (M–S) | ν (M–N) |
|---|---|---|---|---|---|---|---|---|---|---|---|
| H2TTAH | — | 3226 | 1686 | 1641 | 1563 | 1230 | 1080 | 854 | — | — | |
| 772 | |||||||||||
| 686 | |||||||||||
| Zn-H2TTAH | 3437 | 3228 | 1686 | 1599 | 1522 | 1217 | 1135 | 503 | 430 | 436 |
The suggested approach of chelation is established on comparing the IR spectrum of the hydrazone with that of the Zn(II) complex (S.1b) as follows:
(i) There is no notified variation in the position and/or energy of the absorption bands ascribed to ν(NH) and ν(C![[double bond, length as m-dash]](https://www.rsc.org/images/entities/char_e001.gif) O) proving nonsharing in coordination.
O) proving nonsharing in coordination.
(ii) The clear blue shift in the bands owing to azomethine ν(C![[double bond, length as m-dash]](https://www.rsc.org/images/entities/char_e001.gif) N)azo and ν (N–N) modes.32
N)azo and ν (N–N) modes.32
(iii) The coordination through thiophene-S is revealed by the alteration in both the intensity and the position of the characteristic peaks of thiophene ring from (854, 772 and 686) cm−1 to (854, 759, 637) cm−1.33
(iv) The complex spectra of v(Zn–O) and ν(Zn–N) showed the emergence of new bands at (503–568) cm−1 and (430–453) cm−1.34
(v) The coordination of pyridine nitrogen is confirmed by the newly identified bands at (1600–1615), (986–1009) and (758) cm−1, which are attributed to ν(C![[double bond, length as m-dash]](https://www.rsc.org/images/entities/char_e001.gif) N) stretching, pyridine ring breathing, in-plane-bending, and out-of-plane ring vibration modes, respectively.
N) stretching, pyridine ring breathing, in-plane-bending, and out-of-plane ring vibration modes, respectively.
(vi) The ethanol molecule's δ(OH) and ν(OH) are responsible for the bands in the IR-spectrum of the Zn(II) complex that are centered at 3393 cm−1 and (1322–1382) cm−1. The ethanol coordination is further reinforced by the identification of bands corresponding to ν (M–O) at 476–459 cm−1.
3.2. Potentiodynamic polarization method (PP)
Fig. 1 and 2 describes the Tafel diagrams for X70 carbon steel in 3.5% NaCl medium and using various dosages of investigated compounds from 1 × 10⁻⁶ M to 1 × 10⁻⁴ M. Table 4 involves the equivalent electrochemical variables consequent from the PP plots. The values that are typically measured and used to assess corrosion are the corrosion potential (Ecorr), corrosion current density (icorr), cathodic Tafel slope (βc), and anodic Tafel slope (βa). Additionally, the inhibition proficiency (η %) can be calculated using eqn (1).34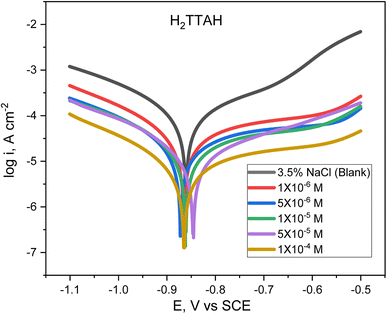 | ||
| Fig. 1 Cathodic and anodic Tafel plots for API 5L X70 C-steel samples in 3.5% NaCl solution treated with altered dosages of H2TTAH, at 25 ± 1 °C. | ||
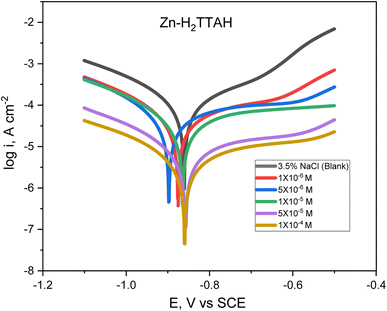 | ||
| Fig. 2 Tafel plots for API 5L X70 C-steel in 3.5% NaCl solution treated with several dosages of Zn-H2TTAH, at 25 ± 1 °C. | ||
| Comp. | Conc., M | −Ecorr, mV | icorr, μA cm−2 | βa, mV dec−1 | βc, mV dec−1 | C.R. mm per year | θ | η, % |
|---|---|---|---|---|---|---|---|---|
| 3.5% NaCl (0.6 M) | 861.4 | 70.86 | 212.82 | 154.94 | 1.1425 | — | — | |
| I; H2TTAH | 1 × 10⁻⁶ | 869.5 | 35.02 | 275.61 | 134.39 | 0.405 | 0.506 | 50.6 |
| 5 × 10⁻⁶ | 878.9 | 15.39 | 290.83 | 147.75 | 1.783 | 0.783 | 78.3 | |
| 1 × 10⁻⁵ | 866.2 | 11.61 | 271.92 | 136.99 | 1.345 | 0.836 | 83.6 | |
| 5 × 10⁻⁵ | 843.7 | 10.22 | 246.48 | 162.80 | 1.184 | 0.856 | 85.6 | |
| 1 × 10⁻⁴ | 868.8 | 4.70 | 275.55 | 136.46 | 0.545 | 0.934 | 93.4 | |
| II; Zn-H2TTAH | 1 × 10⁻⁶ | 880.0 | 27.99 | 263.35 | 141.11 | 3.24 | 0.605 | 60.5 |
| 5 × 10⁻⁶ | 890.1 | 24.70 | 209.07 | 139.35 | 2.86 | 0.651 | 65.1 | |
| 1 × 10⁻⁵ | 863.1 | 22.22 | 263.39 | 150.81 | 2.57 | 0.686 | 68.6 | |
| 5 × 10⁻⁵ | 858.7 | 4.49 | 268.70 | 145.69 | 0.96 | 0.937 | 93.7 | |
| 1 × 10⁻⁴ | 852.8 | 2.73 | 225.46 | 166.74 | 0.57 | 0.961 | 96.1 | |
The Tafel plots show that as the concentration of H2TTAH augmented, the corrosion current densities, icorr, diminished for anodic and cathodic branches. These results confirm that the H2TTAH and Zn-H2TTAH inhibitors have inhibitory properties on the anodic and cathodic directions. The statistics presented in Table 4 showed a slight increase in the corrosion potentials (Ecorr) related to the 3.5% NaCl solution by <−85 mV. Consequently, this observation can be attributed to the mixed type properties of H2TTAH and Zn-H2TTAH inhibitors.35
Furthermore, the rise in the inhibitors concentrations resulted in insignificant alterations in the anodic and cathodic Tafel slopes (βa and βc), which suggests that the corrosion mechanism during the dissolution and oxygen reduction processes remained unaltered by the inhibitors under investigation.36 This discovery validates the inhibitors' mixed-type characteristics.
The polarization findings designate that H2TTAH and Zn-H2TTAH inhibitors have superior inhibition performance (i.e., smallest icorr value) at a concentration of 1 × 10⁻⁴ M compared to other test solutions. According to icorr values (Table 4), we can conclude that Zn-H2TTAH exhibits greater potential for inhibiting corrosion compared to H2TTAH (i.e., smaller icorr) because the Zn-H2TTAH complex has larger size and molecular planarity, as well as the existence of three extra pyridine rings in the Zn-H2TTAH complex in comparison with H2TTAH structure, which indicates a greater inclination to donate electrons, which accounts for its superior inhibitory effectiveness. Two inhibitors have the capability to retard the corrosion process of steel by adhering to active positions and constructing a protecting layer.
3.3. Electrochemical impedance spectroscopy (EIS)
The Nyquist diagrams in Fig. 3(A) and (B) display the Nyquist designs for X70 steel corrosion in 3.5% NaCl solutions at 25 ± 1 °C, using various dosages of evaluated inhibitors.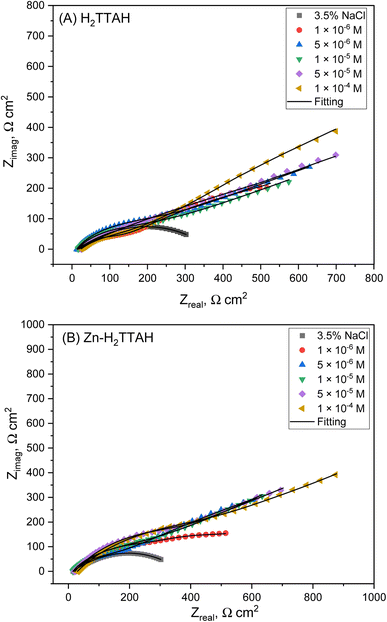 | ||
| Fig. 3 Nyquist plots for X70 steel corrosion in 3.5% NaCl solution, (A) consuming H2TTAH, (B) consuming Zn-H2TTAH at 25 ± 1 °C. | ||
The corrosion inhibition mechanism of H2TTAH or Zn-H2TTAH is explored. The Bode plots shown in Fig. 4(A) and (B) confirm a consistent rise in phase angle shift as the concentrations of examined inhibitors increase. These inhibitors adsorbed on the steel examined metal, resulting in its creation of a high-frequency capacitive loop. Plots display a semicircle pattern that grows larger as concentrations rise.37 It is evident that the corrosion process exhibited by the inhibited X70 steel in a 3.5% NaCl solution is, to a certain degree, influenced by mass transport phenomena (i.e., diffusion) as evidenced by the presence of Warburg impedance at intermediate and low frequency ranges.
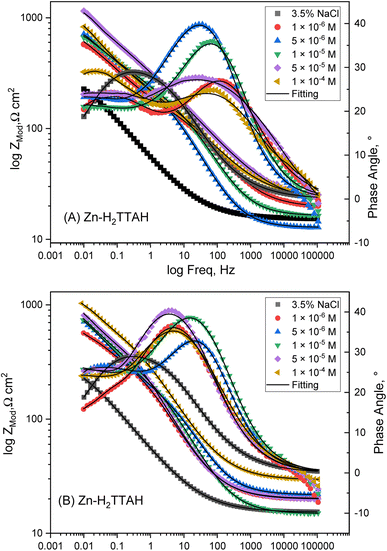 | ||
| Fig. 4 Bode plots for X70 steel corrosion in 3.5% NaCl solution, (A) consuming H2TTAH, (B) consuming Zn-H2TTAH at 25 ± 1 °C. | ||
In order to fully comprehend the EIS results obtained for X70 steel with different concentrations of H2TTAH or Zn-H2TTAH, the equivalent circuit (EC) models employed as illustrated in Fig. 5(A) and (B). The fidelity of the model, assessed through the chi-square (χ2) goodness of fit, was listed in Table 5 and the fitting results were shown in Fig. 3 and 4. These EC models encompass Rs (solution resistance), Rp [polarization resistance; Rp = Rf (film resistance) + Rct (charge transfer resistance)], CPEf (constant phase element associated with the film), CPEdl pertaining to electrical double layer and W (Warburg impedance) particularly in instances involving inhibited samples.
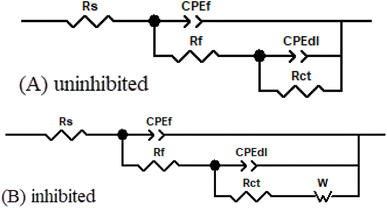 | ||
| Fig. 5 Electrical corresponding circuit used to fit the X70 steel impedance data in 3.5% NaCl solutions for (A) uninhibited (B) inhibited solutions. | ||
| Comp. | Conc., M | Rs, Ω cm2 | CPEf | Rf, Ω cm2 | CPEdl | Rct, Ω cm2 | Rp, Ω cm2 | W, Ω cm2 | χ2 × 10⁻³ | θ | %η | ||
|---|---|---|---|---|---|---|---|---|---|---|---|---|---|
| Y0 × 10−3, Ω−1 sn cm−2 | n | Y0 × 10−3, Ω−1 sn cm−2 | n | ||||||||||
| 3.5% NaCl (0.6 M) | 15.3 | 7.423 | 0.508 | 50.8 | 7.215 | 0.509 | 200.2 | 251.0 | — | 2.96 | — | — | |
| I; H2TTAH | 1 × 10⁻⁶ | 19.5 | 0.512 | 0.497 | 67.4 | 4.223 | 0.503 | 456.4 | 523.8 | 1.85 | 1.82 | 0.521 | 52.1 |
| 5 × 10⁻⁶ | 12.8 | 0.435 | 0.629 | 72.4 | 1.717 | 0.494 | 619.3 | 691.7 | 1.92 | 4.52 | 0.637 | 63.7 | |
| 1 × 10⁻⁵ | 16.4 | 0.294 | 0.610 | 92.2 | 0.885 | 0.485 | 883.1 | 975.3 | 3.34 | 2.60 | 0.743 | 74.3 | |
| 5 × 10⁻⁵ | 24.7 | 0.153 | 0.502 | 120.8 | 0.464 | 0.424 | 1332.3 | 1453.1 | 3.70 | 4.69 | 0.827 | 82.7 | |
| 1 × 10⁻⁴ | 23.5 | 0.074 | 0.489 | 173.0 | 0.173 | 0.503 | 2977.4 | 3150.4 | 3.93 | 4.59 | 0.920 | 92.0 | |
| II; Zn-H2TTAH | 1 × 10⁻⁶ | 19.9 | 0.512 | 0.553 | 76.5 | 1.482 | 0.437 | 675.8 | 752.3 | 1.02 | 8.82 | 0.666 | 66.6 |
| 5 × 10⁻⁶ | 21.7 | 0.388 | 0.519 | 96.2 | 4.149 | 0.429 | 1140.9 | 1237.1 | 1.15 | 2.9 | 0.797 | 79.7 | |
| 1 × 10⁻⁵ | 14.9 | 0.175 | 0.618 | 109.1 | 2.121 | 0.419 | 1814.6 | 1923.7 | 2.25 | 4.19 | 0.870 | 87.0 | |
| 5 × 10⁻⁵ | 20.2 | 0.044 | 0.633 | 162.5 | 0.430 | 0.414 | 3045.9 | 3208.4 | 3.36 | 4.78 | 0.922 | 92.2 | |
| 1 × 10⁻⁴ | 29.3 | 0.012 | 0.532 | 193.4 | 0.132 | 0.405 | 4752.7 | 4946.1 | 8.05 | 2.29 | 0.949 | 94.9 | |
The parameters provided in Table 5 designate that the corrosion behavior of X70 steel in 3.5% NaCl media exhibits semicircle, this may be credited to the irregularity of the steel surface, frequency diffusion, and some mass transfer.38
The inhibitory efficiency for the corrosion of X70 steel (%η) in a 3.5% NaCl solution can be calculated by the formulae that incorporate the polarization resistance (RP).39
| RP = Rf + Rct | (8) |
 | (9) |
The polarization resistances of X70 steel in 3.5% NaCl solutions with and in the lack of investigated compounds are RoP and RP, correspondingly.
The total impedance ZCPE can be calculated via the next equation:40
 | (10) |
The CPE admission, denoted as Y0, is determined by several factors. The imaginary number, j, is involved in the calculation, along with the angular frequency (ω) represented by 2πf. Another important factor is the CPE index, denoted as n, which is calculated based on the phase shift. The value of ‘n’ is pivotal in defining the nature of the element depicted by the constant phase element (CPE); wherein n equating to zero corresponds to a resistor, an n value between 0 and 1 indicates a non-ideal capacitor, and n equating to unity denotes an ideal capacitor.41 The deviation from ideal capacitive character, as revealed by the ndl values ranging from 0.489 to 0.629, is attributable to a multiplicity of influential factors. These include the surface heterogeneity of X70 steel, the migration of charge carriers at energetic sites, the progressive dissolution of metal, the existence of impurities, and the adsorptive interactions of the inhibitory molecules.
Table 5 delineates the electrochemical parameters ascertained from the EIS studies. Elevated charge transfer resistance (Rct) magnitudes associated with H2TTAH and Zn-H2TTAH suggest that the mitigation of corrosion in steel samples may be accredited to the adsorptive of these inhibitors, displacing the water particles initially present on the steel surface.42 A marked decrease in the admittance values (Y0)dl values corresponds to the adsorptive of H2TTAH and Zn-H2TTAH on the X70 steel substrate.43 This adsorption mechanism contributes to an enhanced thickness of the electrical double layer, culminating in the construction of a protecting inhibitive film atop the steel surface. Notably, the EIS data corroborate a superior corrosion protection efficiency of Zn-H2TTAH compared to H2TTAH, a finding that is in concordance with the outcomes derived from PP studies.
3.4. Adsorption isotherm and comparison with previous studies
Different kinds of adsorption isotherms were explored to learn more near the relationship amongst the H2TTAH and Zn-H2TTAH as corrosion inhibitors and the X70 steel metal surface, adsorption characteristics at 25 ± 1 °C using various kinds to determine the most appropriate mechanism from the appropriate adsorption isotherms.Utilizing PP data and the following equation, the surface exposure (θ) of separately examined inhibitor at various dosages of concentration in 3.5% NaCl medium has been calculated:
 | (11) |
 ), and eqn (12) might be used to premedicate the adsorption process.44
 | (12) |
The equation is given as: (T) represents the absolute temperature in kelvin, (R) signifies the gas constant (8.314 J mol−1 K−1), and (55.5) signifies the apparent molar concentration of H2O in solution.
It was confirmed that the tested derivatives' adsorption on steel surface (Fig. 6) follows the Langmuir adsorption isotherm by visually evaluating values of (θ) acquired from the PP approach.43
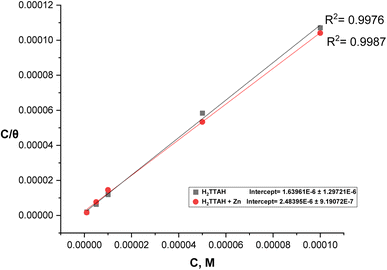 | ||
| Fig. 6 Langmuir's adsorption diagrams for X70 steel in 3.5% NaCl solutions involving various dosages of investigated inhibitors at 25 ± 1 °C. | ||
The data presented in Fig. 6 indicates that the (C/θ) design, in relation to (C), follows a straight line with a correspondence coefficient (R2) greater than 0.99. This demonstrates that the examined inhibitors being studied can be well adsorbed according to the Langmuir adsorption isotherm. By applying eqn (12), the standard free energy of adsorption ( ) is calculated to be −41.93 kJ mol−1 (Kads = 4.03 × 10⁵ L mol−1) for H2TTAH and −42.96 kJ mol−1 (Kads = 6.10 × 10⁵ L mol−1) for Zn-H2TTAH. These results suggest that charge transfer arises between the investigated hydrazone compounds and the c-steel surface, resulting in the establishment of a coordinate bond through chemisorption adsorption. The
  values show a negative sign, demonstrating that the evaluated compounds are spontaneously adsorbed on the steel surface. Additionally, the high-free energy values, equal to −40 kJ mol−1 and higher, further support this observation.45
Table 6 demonstrates a comparative study of the inhibition efficiency of the synthesized compounds (H2TTAH and Zn-H2TTAH), with various previously reported inhibitors in modifying corrosion of carbon steel within diverse corrosive mediums.46–55 The results obtained from the PP and EIS studies, as delineated in Table 6, suggest that H2TTAH and Zn-H2TTAH, are efficacious corrosion inhibitors, exhibiting potential for high-performance applications.
| No. | Inhibitor | Corrosive media | Technique | Optimum concentration | η% | Ref. | |
|---|---|---|---|---|---|---|---|
| 1 | Hydrazone compound: HTH | 1.0 M HCl | PP | 10−3 M | 98 | 46 | |
| 2 | Benzoquinoline derivatives | 1.0 M HCl | PP | 500 ppm | 90.3 | 47 | |
| 3 | Thiocarbohydrazones based on adamantane and ferrocene | 1.0 M HCl | PP | 200 ppm | 93.6 | 48 | |
| 4 | Naproxen-based hydrazones | 1.0 M HCl | Weight loss | 5 × 10⁻³ M | 90.6 | 49 | |
| EIS | 89.2 | ||||||
| 5 | Two malonyl dihydrazide derivatives | 1.0 M HCl | EIS | 2.0 × 10⁻⁵ M | 90.7 | 50 | |
| 6 | Imine compound (PTM) and its cobalt complex (CoPTM) | 1.0 M HCl | EIS | 2 mM | 84.6 | 51 | |
| 7 | Zn(II) Schiff base complexes | 15% HCl | EIS | 0.2 g L−1 | 87.3 | 52 | |
| 8 | Hydrazone derivative (HIND) | Concrete pore solutions | Weight loss | 0.5 mM | 88.4 | 53 | |
| 9 | Hydrazones derived from thiophene derivatives | 0.5 M H2SO4 | Weight loss | 400 ppm | 97.2 | 54 | |
| PP | 94.6 | ||||||
| EIS | 96.3 | ||||||
| 10 | N-(5-((4-Chlorophenyl)diazenyl)-2-hydroxybenzylidene)-2-hydroxybenzo hydrazide (CDHBHZ) | 1.0 M HCl | Weight loss | 0.03 M | 96.0 | 55 | |
| 0.5 M H2SO4 | Weight loss | 89.0 | |||||
| 13 | Bishydrazone ligand and its Zn- complex | H2TTAH | 3.5% NaCl solution | PP | 1 × 10⁻⁴ M | 93.4 | The present work |
| Zn-H2TTAH | 96.1 | ||||||
| H2TTAH | EIS | 93.0 | |||||
| Zn-H2TTAH | 95.6 | ||||||
3.5. XPS studies
The construction and chemical bonds of H2TTAH and Zn-H2TTAH on steel surfaces were considered using X-ray photoelectron spectroscopy (XPS). Additionally, the examination aimed to confirm the adsorption of investigated particles on the carbon steel surface. Fig. 7 and 8 present the XPS spectra attained for the X70 carbon steel surface preserved with H2TTAH and Zn-H2TTAH inhibitors in a 3.5% NaCl solution at 25 ± 1 °C. The spectra for the inhibited specimens revealed characteristic peaks for C 1s, Cl 2p, Fe 2p, O 1s, N 1s, and S 2p. Additionally, a peak related to Zn 2p was observed for the specimen treated with the Zn-H2TTAH complex, providing further evidence of the adsorption of H2TTAH and Zn-H2TTAH inhibitors on the surface of API 5L X70 carbon steel. Table 7 presents the binding energies (BE, eV) and conforming assignments for each peak constituent.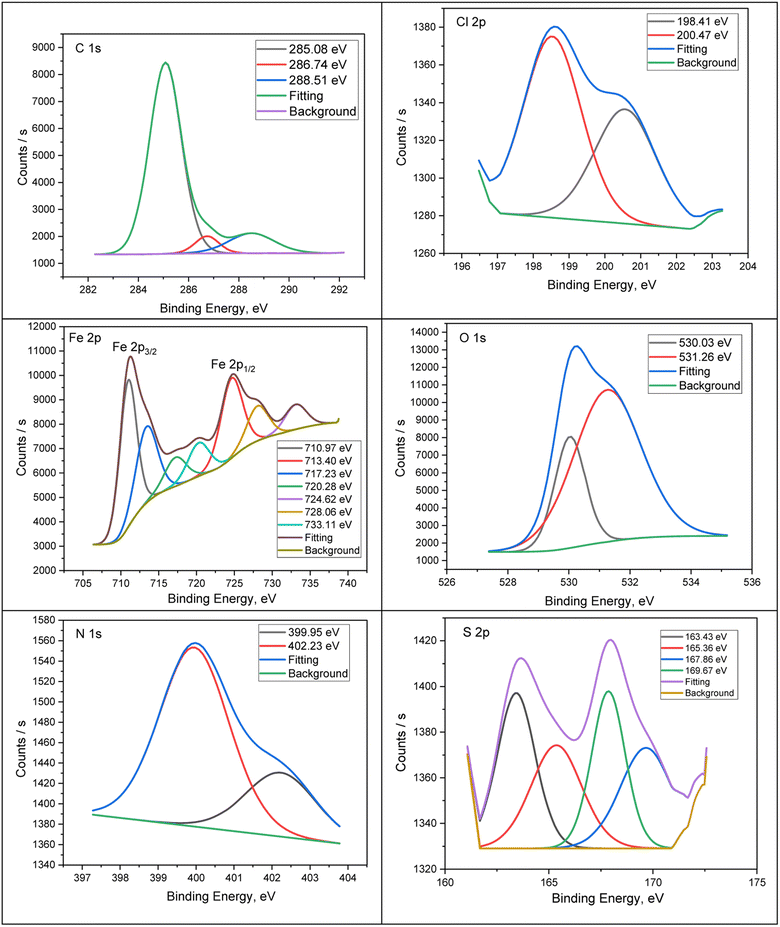 | ||
| Fig. 7 XPS deconvoluted outlines of C 1s, Cl 2p, Fe 2p, O 1s, N 1s, and S 2p for API 5L X70 C-steel samples in 3.5% NaCl solution treated with 1.0 × 10⁻⁴ M of H2TTAH at 25 ± 1 °C. | ||
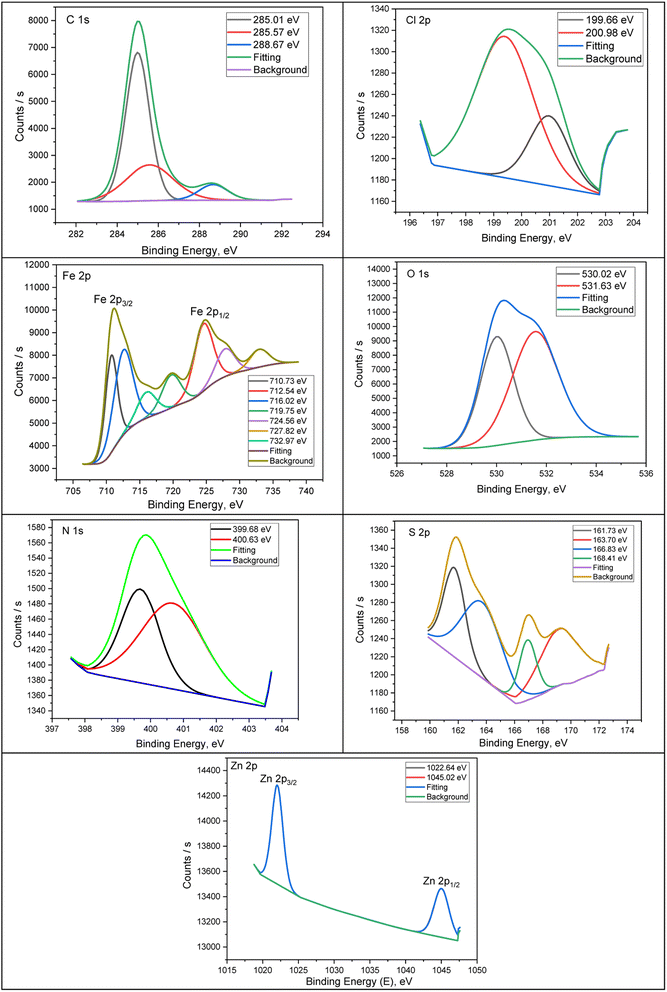 | ||
| Fig. 8 XPS deconvoluted profiles of C 1s, Cl 2p, Fe 2p, O 1s, N 1s, S 2p and Zn 2p for API 5LX70 C-steel samples in 3.5% NaCl solution treated with 1.0 × 10⁻⁴ M of Zn-H2TTAH 25 ± 1 °C. | ||
| API 5L X70 C-steel in 3.5% NaCl solution treated with 1.0 × 10⁻⁴ M of H2TTAH | API 5L X70 C-steel in 3.5% NaCl solution treated with 1.0 × 10⁻⁴ M of Zn-H2TTAH | ||||
|---|---|---|---|---|---|
| Core element | BE, eV | Assignments | Core element | BE, eV | Assignments |
| C 1s | 285.08 | –C–H, –C–C–, –C![[double bond, length as m-dash]](https://www.rsc.org/images/entities/char_e001.gif) C– C– |
C 1s | 285.01 | –C–H, –C–C–, –C![[double bond, length as m-dash]](https://www.rsc.org/images/entities/char_e001.gif) C– C– |
| 286.74 | –C–N, –C–Cl | 285.57 | –C–N, –C–Cl | ||
| 288.51 | –C–N+ | 288.67 | –C–N+ | ||
| Cl 2p | 198.41 | Cl 2p3/2 | Cl 2p | 199.66 | Cl 2p3/2 |
| 200.47 | Cl 2p1/2 | 200.98 | Cl 2p1/2 | ||
| Fe 2p | 710.97 | Fe 2p3/2 of Fe2+ | Fe 2p | 710.73 | Fe 2p3/2 of Fe2+ |
| 713.40 | Fe 2p3/2 of Fe3+ | 712.54 | Fe 2p3/2 of Fe3+ | ||
| 717.23 | Satellite Fe 2p3/2 of Fe2+ | 716.02 | Satellite Fe 2p3/2 of Fe2+ | ||
| 720.28 | Satellite Fe 2p3/2 of Fe3+ | 719.75 | Satellite Fe 2p3/2 of Fe3+ | ||
| 724.62 | Fe 2p1/2 of Fe2+ | 724.56 | Fe 2p1/2 of Fe2+ | ||
| 728.06 | Fe 2p1/2 of Fe3+ | 727.82 | Fe 2p1/2 of Fe3+ | ||
| 733.11 | Satellite Fe 2p1/2 of Fe3+ | 732.94 | Satellite Fe 2p1/2 of Fe3+ | ||
| O 1s | 530.03 | FeO, Fe2O3 | O 1s | 530.02 | FeO, Fe2O3 |
| 531.26 | FeOOH | 531.63 | FeOOH | ||
| N 1s | 399.95 | –C![[double bond, length as m-dash]](https://www.rsc.org/images/entities/char_e001.gif) N–, N–Fe N–, N–Fe |
N 1s | 399.68 | –C![[double bond, length as m-dash]](https://www.rsc.org/images/entities/char_e001.gif) N–, N–Fe N–, N–Fe |
| 402.23 | –C![[double bond, length as m-dash]](https://www.rsc.org/images/entities/char_e001.gif) N+– N+– |
400.63 | –C![[double bond, length as m-dash]](https://www.rsc.org/images/entities/char_e001.gif) N+– N+– |
||
| S 2p | 163.43 | S 2p3/2 of S in thiophene, S–Fe | S 2p | 161.73 | S 2p3/2 of S in thiophene |
| 165.36 | S 2p3/2 of S in thiophene | 163.70 | S 2p3/2 of S in thiophene, S–Fe | ||
| 167.86 | S 2p1/2 of S in thiophene | 166.83 | S 2p1/2 of S in thiophene | ||
| 169.67 | Fe–S | 168.41 | Fe–S | ||
| Zn 2p | 1022.64 | Zn 2p3/2 of Zn2+ | |||
| 1045.02 | Zn 2p1/2 of Zn2+ | ||||
The spectrum of C 1s can be separated into two peaks (Fig. 7 and 8) for samples preserved with H2TTAH and Zn-H2TTAH inhibitors, the peaks correspond to C–H–, C–C–, and C–Cl bonds at 285.08 and 285.01 eV, and C–N+ bonds at 288.51 and 288.67 eV.56,57 The presence of a chlorine peak on API 5L X70 carbon steel specimens treated with H2TTAH and Zn-H2TTAH inhibitors in a 3.5% NaCl solution is assigned to the interaction of chloride ions with steel surface which possess positive charge.58 The Cl 2p spectra of the inhibited specimens showed two peaks at 198.41 and 199.66 eV, for Cl 2p3/2, as well as additional peaks at 200.47 and 200.98 eV, for Cl 2p1/2, which accredited to Cl–Fe bond in FeCl3.59 The XPS spectra of Fe 2p in the inhibited specimens exhibited seven peaks. These peaks were assigned to Fe 2p3/2 of Fe2+ at 710.97 and 710.73 eV, Fe 2p3/2 of Fe3+ at 713.40 and 712.54 eV, Fe 2p3/2 satellites of Fe2+ at 720.28 and 719.75 eV, and Fe 2p1/2 of Fe2+ at 724.62 eV.60,61 Furthermore, in the high-resolution O 1s spectrum, there are two distinct peaks observed (Fig. 7 and 8) for the specimens treated with H2TTAH and Zn-H2TTAH inhibitors. The first peak, at 530.03, 530.02 eV, is recognized to O2− and can be associated with oxygen atoms attached to Fe2+ and Fe3+ in the FeO and Fe2O3 oxides.62 The second peak, at 531.26, 531.63 eV, is accredited to OH− and may be linked to Fe3+ in FeOOH.63,64
Additionally, the N 1s spectrum of the API 5L X70 C-steel in 3.5% NaCl solution containing H2TTAH and Zn-H2TTAH inhibitors displays two peaks (Fig. 7 and 8). The first peak, at 399.95, 399.68 eV, agrees to –C![[double bond, length as m-dash]](https://www.rsc.org/images/entities/char_e001.gif) N- in inhibitors molecules and formation of N–Fe bond.65 The second peak 4002.23, 400.63 eV corresponds to protonated nitrogen atoms (–C
N- in inhibitors molecules and formation of N–Fe bond.65 The second peak 4002.23, 400.63 eV corresponds to protonated nitrogen atoms (–C![[double bond, length as m-dash]](https://www.rsc.org/images/entities/char_e001.gif) N+–) in the H2TTAH and Zn-H2TTAH inhibitors.66 Furthermore, the S 2p spectra show distinct peaks (Fig. 7 and 8). Peaks at energies of 161.73, 163.43, 163.70, and 165.36 eV are associated with neutral sulfur in the thiophen ring. Peaks at energies of 167.86 and 166.83 eV are attributed to neutral sulfur in the thiophen ring,67,68 while peaks at energies of 168.41 and 169.67 eV indicate the formation of S–Fe bond.54,69 Additionally, the Zn 2p XPS spectra of the specimen treated with the Zn-H2TTAH complex exhibit two characteristic peaks (Fig. 8): one at 1022 eV for Zn 2p3/2 of Zn2+ and another at 1045.02 eV for Zn 2p1/2 of Zn2+, confirming the adsorption of the Zn-H2TTAH complex on the surface of the API 5L X70 C-steel.70 These findings obtained from XPS analysis support the adsorption of the H2TTAH and Zn-H2TTAH compounds on the API 5L X70 C-steel surface in 3.5% NaCl solution.
N+–) in the H2TTAH and Zn-H2TTAH inhibitors.66 Furthermore, the S 2p spectra show distinct peaks (Fig. 7 and 8). Peaks at energies of 161.73, 163.43, 163.70, and 165.36 eV are associated with neutral sulfur in the thiophen ring. Peaks at energies of 167.86 and 166.83 eV are attributed to neutral sulfur in the thiophen ring,67,68 while peaks at energies of 168.41 and 169.67 eV indicate the formation of S–Fe bond.54,69 Additionally, the Zn 2p XPS spectra of the specimen treated with the Zn-H2TTAH complex exhibit two characteristic peaks (Fig. 8): one at 1022 eV for Zn 2p3/2 of Zn2+ and another at 1045.02 eV for Zn 2p1/2 of Zn2+, confirming the adsorption of the Zn-H2TTAH complex on the surface of the API 5L X70 C-steel.70 These findings obtained from XPS analysis support the adsorption of the H2TTAH and Zn-H2TTAH compounds on the API 5L X70 C-steel surface in 3.5% NaCl solution.
3.6. DFT studies
Fig. 9 illustrates the optimized structures, LUMO, and HOMO distribution of H2TTAH and Zn-H2TTAH molecules. The equivalent theoretical variables are provided in Table 8. In accordance with the FMO theory, the LUMO and HOMO energies indicate the inhibitor molecule ability for electrons contribution or acceptance with the surface of the metal.56 So, an inhibitor particle with a high EHOMO and low ELUMO values demonstrates superior corrosion protection properties. Created on the data in Table 8, the Zn-H2TTAH molecule displays the highest EHOMO value (−5.05 eV) compared to the H2TTAH molecule (−5.14 eV) implies better protective power for Zn-H2TTAH molecule. According to Fig. 9, the HOMO level of the inhibitor particles primarily resides in the thiophen and acetohydrazide moieties, representing that these regions are extra disposed to electrophilic attacks on the X70-Steel surface. These findings provide the inhibitor ability to adsorb onto the steel surface, thereby enhancing its protective efficiency, which aligns with the experimental results. However, it should be noted that the ELUMO value for the Zn-H2TTAH molecule (−2.74 eV) is inferior to that of the H2TTAH molecule (−2.43 eV). Consistent with previous observations, this lower ELUMO value for the Zn-H2TTAH molecule signifies its greater protective power.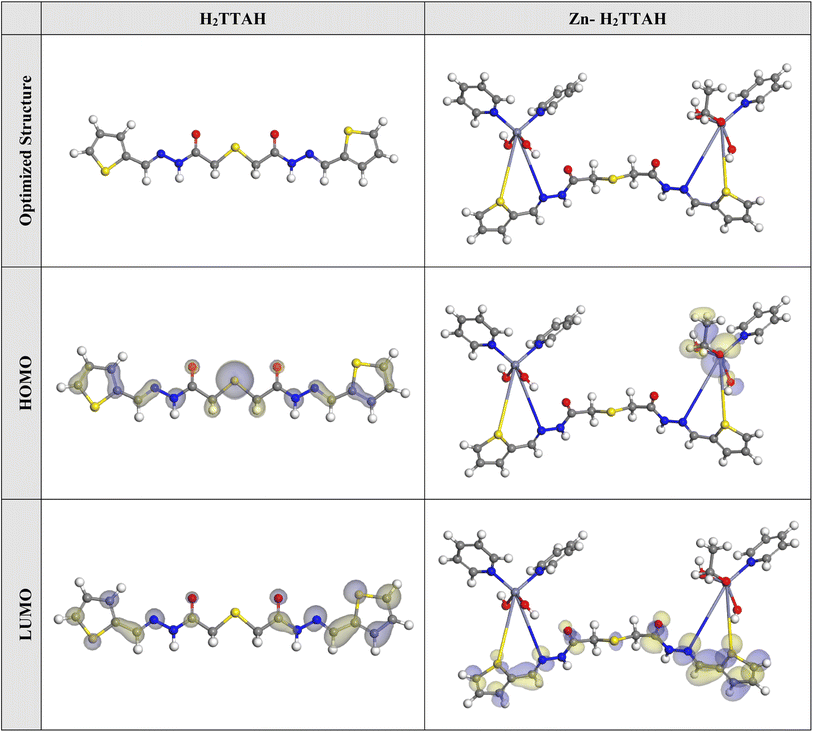 | ||
| Fig. 9 The optimized molecular structures, HOMO and LUMO of the H2TTAH and Zn-H2TTAH using DMol3 module. | ||
| Parameters | H2TTAH | Zn-H2TTAH |
|---|---|---|
| EHOMO (eV) | −5.14 | −5.05 |
| ELUMO (eV) | −2.43 | −2.74 |
| ΔE = ELUMO − EHOMO (eV) | 2.71 | 2.31 |
| Electronegativity (χ) | 3.79 | 3.89 |
| Global hardness (η) | 1.35 | 1.15 |
| Global softness (σ) | 0.74 | 0.87 |
| The number of electrons transferred (ΔN) | 1.19 | 1.35 |
| ΔEback-donation | −0.34 | −0.29 |
| Dipole moments (μ) debye | 14.99 | 18.80 |
| Molecular surface area, Å2 | 385.00 | 809.78 |
Similarly, it is crucial to decrease the energy gap (ΔE) value so as to enhance the effectiveness of the corrosion inhibitor additive.57 As disclosed in Table 8, the Zn-H2TTAH molecule has a higher probability of being adsorbed at the interface of X70-Steel, as indicated by its lower ΔE value of 2.31 eV compared to the H2TTAH molecule with a ΔE value of 2.71 eV. Generally, inhibitors exhibit moderately low electronegativity values (χ), demonstrating their competence to contribute electrons to the steel surface.58 Conversely, a high electronegativity (χ) of the inhibitor particle enables it to efficiently receive electrons from the atoms at the steel interface followed by back donation from inhibitor particles and usage of a stronger bond with the steel surface.71 According to the data in Table 8, both the H2TTAH and Zn-H2TTAH molecules have slightly higher electronegativity values, which allows for effective electron acceptance from the steel interface trucked by back donation to the metal surface, leading to a robust connection with the steel surface. Moreover, the molecule's softness (σ) and hardness (η) can be employed to assess its reactivity and stability. Soft molecules characterized by a seamless electron transfer to the steel interface during adsorption, exhibit superior corrosion protection capabilities compared to hard molecules. Hence, these molecules act as effective corrosion inhibitors.72 Table 8 demonstrates that the Zn-H2TTAH molecule displays higher σ values and smaller η values than the H2TTAH particle. This indicates a more efficient electron transfer to the metal substrate and superior inhibition possessions for Zn-H2TTAH molecule.
Furthermore, the part of electron transfer and the ΔEback-donation are important variables in determining the inhibitor's capability to provide or receive electrons. If ΔN values are greater than 0, it suggests that electron transfer occurs from the inhibitor to the metal interface. While, if ΔN values are less than or equal to zero, it becomes possible for electron transfer from the metal to the inhibitor molecule (i.e., back donation).61,73 By examining the recorded ΔN values in Table 8, it can be noticed that the molecules Zn-H2TTAH and H2TTAH have positive ΔN values, indicating their capacity to provide electrons to the surface of metal. Moreover, when η > 0, the ΔEback-donation value becomes < 0, implying the relocate of electrons from the metal to the molecule and their subsequent donation back to the molecule, which is a desired dynamic process.74 Table 8 shows negative values of ΔEback-donation for the Zn-H2TTAH and H2TTAH molecules, suggesting a preference for back donation in these particles and the creation of a strong bond.62
Moreover, the dipole moment is a critical parameter that significantly influences the corrosion inhibition efficacy.75 An improvement in the dipole moment raises the energy required for distortion and expands the examined particle adsorption on the metal surface. Hence, a greater dipole moment contributes to a greater inhibiting proficiency.76 As outlined in Table 8, the Zn-H2TTAH compound possesses a larger dipole moment value (18.80 debye) in comparison to the H2TTAH molecule (14.99 debye), indicating a higher tendency for adsorption on the steel interface and an enhanced prohibition capability. Additionally, there exists a clear association between the surface area of molecules of the Zn-H2TTAH and H2TTAH molecules and their ability to protect the X-70 surface in destructive media. A larger molecular structure leads to higher inhibition proficiency as it increases the interface area between the inhibitor particles and the examined surface. Henceforth, the Zn-H2TTAH molecule demonstrates the larger molecular surface area (809.78 Å2) than H2TTAH molecule (385.00 Å2), owing to the existence of three extra pyridine rings in the Zn-H2TTAH structure in comparison with H2TTAH structure, and consequently exhibits an increased rate of inhibition in comparison to the H2TTAH particles, as displayed in Table 8.
In addition, the Dmol3 module was applied to evaluate the active sites of the examined compounds species by means of molecular electrostatic potential mapping (MEP). MEP is a visual representation in three dimensions that aims to identify the overall electrostatic influence exerted on a compound by its charge distribution.67 The MEP illustrated in Fig. 10 display regions of intense electron density in red, indicating a strongly negative MEP (associated with nucleophilic reactions). Conversely, the blue regions represent the highest positive areas (related to electrophilic interactions).35 Analysis of Fig. 10 reveals that the areas with the most negative values are primarily situated above the thiophen moieties and pyridine rings, while the acetohydrazide moieties have lower electron density. These regions with greater electron density (indicated by the red area) in the investigated compounds are likely the greatest favorable for interactions with the steel interface, configuring of durable adsorbed protecting layers.
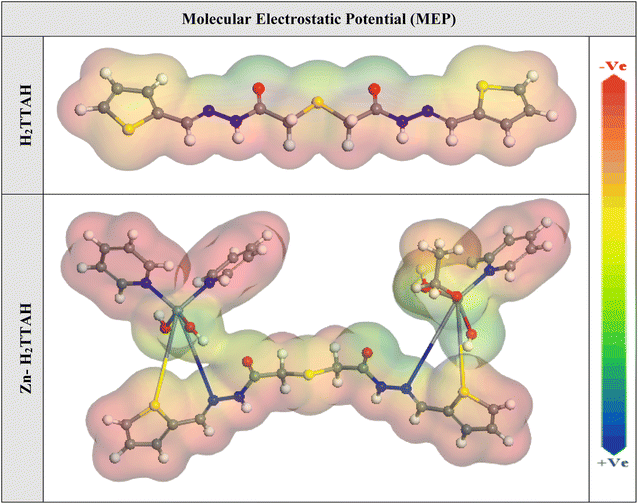 | ||
| Fig. 10 The graphical representation of the MEP for the H2TTAH and Zn-H2TTAH was conducted utilizing the DMol3 module. | ||
3.7. MC simulations
The Monte Carlo simulations were conducted to gain insights into the interactions between the inhibitor particles and the investigated metal. This was done to propose a plausible adsorption mechanism. Fig. 11 demonstrates that the Zn-H2TTAH and H2TTAH molecules exhibited the most favorable adsorption configurations at the interface of the X70 Steel in the 3.5% NaCl solution. The module used for adsorption configurations indicated that these molecules were adsorbed in a nearly flat orientation, indicating enhanced adsorption and maximum coverage of the surface examined.77,78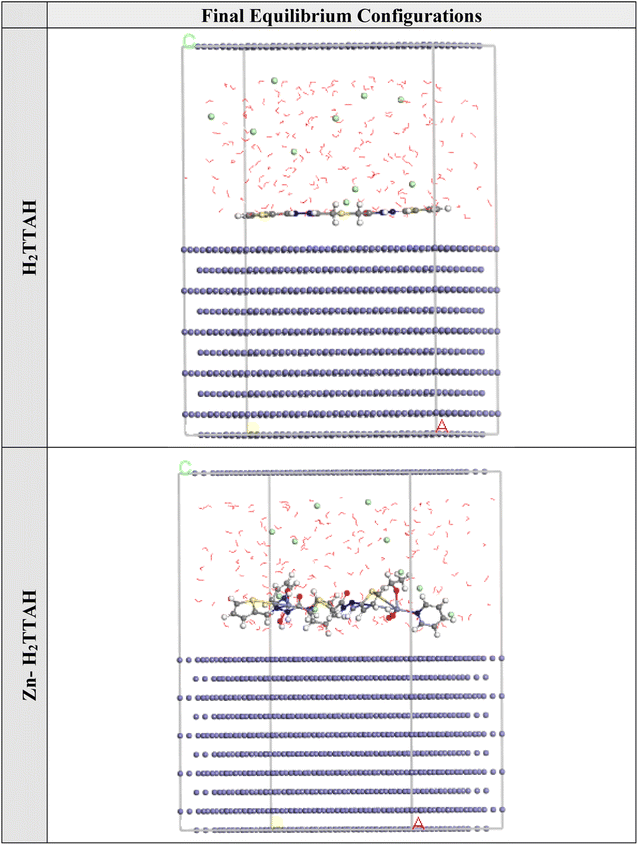 | ||
| Fig. 11 The optimal arrangement of the adsorption for the H2TTAH and Zn-H2TTAH on the Fe (1 1 0) substrate was computed utilizing the adsorption locator module. | ||
Additionally, Table 9 presents the adsorption energies attained from Monte Carlo simulations. It was observed that the Zn-H2TTAH compound (−2710.79 kcal mol−1) exhibited a more negative adsorption energy value associated to the H2TTAH compound (−2469.46 kcal mol−1), representing a stronger adsorption of the Zn-H2TTAH on the steel surface. This suggests that the Zn-H2TTAH compound forms a stable adsorbed film, providing effective corrosion inhibition for the steel, which aligns with the experimental findings.78,79 Furthermore, Table 9 also exhibits that the adsorption energy value for the Zn-H2TTAH compound in the unrelaxed state (−2968.82 kcal mol−1) is more negative compared to the H2TTAH molecule (−2469.46 kcal mol−1). Similarly, in the relaxed state after geometry optimization, the adsorption energy values for the Zn-H2TTAH compound (258.03 kcal mol−1) are more than those of the H2TTAH compound (208.26 kcal mol−1). This confirms the higher corrosion prohibition of the Zn-H2TTAH compound compared to the H2TTAH.
| Corrosion systems | Adsorption energy (kcal mol−1) | Rigid adsorption energy (kcal mol−1) | Deformation energy (kcal mol−1) | dEads/dNi: inhibitor (kcal mol−1) | dEads/dNi: Cl− ions (kcal mol−1) | dEads/dNi: water (kcal mol−1) |
|---|---|---|---|---|---|---|
| Fe (1 1 0) | −2469.46 | −2469.46 | 208.26 | −244.02 | −101.24 | −18.17 |
| H2TTAH | ||||||
| Water | ||||||
| Cl− ions | ||||||
| Fe (1 1 0) | −2710.79 | −2968.82 | 258.03 | −294.55 | −102.67 | −18.50 |
| Zn-H2TTAH | ||||||
| Water | ||||||
| Cl− ions |
The dEads/dNi values afford information about the energy of the arrangement between the investigated metal and the adsorbates, specifically when excluding the adsorbed inhibitor compound or other adsorbates compounds.71 Table 9 shows that the dEads/dNi values of Zn-H2TTAH molecules (−294.55 kcal mol−1) are greater than that of the H2TTAH compound (−244.02 kcal mol−1), indicating that the Zn-H2TTAH molecule has stronger adsorption than the H2TTAH molecule. The dEads/dNi values for water particles and chloride ions are approximately −18.36 and −101.96 kcal mol−1, correspondingly. These values imply that the adsorption of the inhibitor compounds is stronger than that of water particles and chloride ions, leading to the substitution of water particles and chloride ions by the inhibitor compounds.80 Therefore, the Zn-H2TTAH molecule forms a firmly attached protecting film on the steel surface, resulting in effective corrosion inhibition in a corrosive media, as supported by practical and theoretical findings.81
3.8. The corrosion inhibition mechanism
Neutral corrosive environments are thought to prevent metal corrosion by forming a shielding layer through the adsorption of inhibitor particles on the examined metal.82 The adsorption process helps preserve the examined metal surface under corrosive conditions. The adsorption of H2TTAH and Zn-H2TTAH molecules can be categorized into two different categories of interactions: physisorption and chemisorption.46 Physisorption occurs when there is a charged surface on the metal and charged particles in the solution. The electric field at the metal/solution interface induces a surface charge on the metal.83 Conversely, chemisorption contains the relocation of electrons from the inhibitor particles to the metal surface, resulting in the creation of a coordination bond.84Regardless of the charge on the surface, it is possible to achieve inhibition. It is crucial for the inhibitor to consist of molecules that have heteroatoms, or electrons with weak ties with a lone pair of electrons.42 In addition, a transition metal with low-energy unoccupied electron orbitals, such as Fe2+ and Fe3+, is necessary. Two main categories of inhibition mechanisms have been anticipated. One involves the creation of complexes with iron ions (Fe2+ and Fe3+), depending on the environment.24 One more aspect involves the chemical adsorption of H2TTAH and its Zn complex onto steel surfaces. This occurs by way of the development of coordinate linkages between the active sites of H2TTAH and its Zn complex (specifically, nitrogen atoms with lone pairs of electrons and benzene rings with π-electrons) and the vacant d-orbitals of the iron surface. Chemical adsorption is indicated by the values of  (>40 kJ mol−1), which suggests that H2TTAH and its Zn complex are chemically adsorbed on the steel surface.
The corrosion inhibition effectiveness of Zn-H2TTAH is higher than that of H2TTAH. This is attributed to the larger pyridine group in Zn-H2TTAH, which provides more sites for electrophilic attack. Moreover, Zn-H2TTAH has a lower EHOMO, lower ΔE, and lower hardness, which all contribute to its strong inhibitory efficiency. The confirmation of chemical adsorption is based on the interface between the inhibitor molecules and the vacant d-orbital of the iron atom. This interaction involves electron transfer, electron sharing, and the construction of covalent (co-ordinate), the metal surface and the inhibitor particles are connected by bonds.85
| Fe ⇌ Fe2+ + 2e− | (13) |
| O2 + 2H2O + 4e− ⇌ 4OH− | (14) |
4. Conclusion
(1) The H2TTAH and Zn-H2TTAH exhibited impressive inhibition properties against API 5L X70 carbon steel corrosion in 3.5% NaCl solutions reached 93.4%, 96.1% and serving as efficacious suppressants for both anodic and cathodic processes.(2) The electrochemical measurements (PP and EIS) clearly indicate that the inhibition efficiency expands with raising the inhibitor concentrations. The order of efficiency for inhibition is as follows: Zn-H2TTAH > H2TTAH.
(3) The corrosion inhibition behavior of these compounds within a corrosive media is demonstrated by the pronounced increase in Rct values, coupled with the simultaneous decrease in CPEdl values, upon the introduction of 1 × 10⁻⁴ M concentrations of the H2TTAH and Zn-H2TTAH.
(4) The adsorption of the H2TTAH and Zn-H2TTAH molecules on the API 5L X70 carbon steel surface in 3.5% NaCl solutions conforms to the Langmuir adsorption isotherm.
(5) The adsorption of the H2TTAH and Zn-H2TTAH inhibitors is spontaneous process, as implied by the significant negative value of  .
.
(6) XPS was utilized to confirm the adsorption of H2TTAH and Zn-H2TTAH molecules on the API 5L X70 carbon steel surface which matching with corrosion mechanism.
(7) The data obtained from PP and EIS techniques confirmed the effectiveness of the H2TTAH and Zn-H2TTAH molecules as corrosion inhibitors. Furthermore, a significant congruence was observed between the empirical findings and theoretical predictions.
Author contributions
Ola. A. El-Gammal: conceptualization, supervision, investigation, methodology, resources, formal analysis, data curation, funding acquisition, writing – original draft, writing – review & editing. Dena A. Saad: conceptualization, supervision, investigation, methodology, resources, formal analysis, data curation, funding acquisition, writing – original draft, writing – review & editing. Marwa N. El-Nahass: conceptualization, supervision, investigation, methodology, resources, formal analysis, data curation, funding acquisition, writing – original draft, writing – review & editing. Kamal Shalabi: conceptualization, supervision, investigation, methodology, resources, formal analysis, data curation, funding acquisition, writing – original draft, writing – review & editing. Yasser M. Abdallah: conceptualization, supervision, investigation, methodology, resources, formal analysis, data curation, funding acquisition, writing – original draft, writing-review & editing.Conflicts of interest
The authors declare that they have no known competing financial interests or personal relationships that could have appeared to influence the work reported in this paper.References
- A. Y. Yassin, A. M. Abdelghany, M. M. Shaban and Y. M. Abdallah, Colloids Surf., A, 2022, 635, 128115 CrossRef CAS.
- Y. M. Abdallah, O. A. El-Gammal, H. M. Abd El-Lateef and K. Shalabi, RSC Adv., 2022, 12, 14665–14685 RSC.
- O. M. A. Khamaysa, I. Selatnia, H. Zeghache, H. Lgaz, A. Sid, I.-M. Chung, M. Benahmed, N. Gherraf and P. Mosset, J. Mol. Liq., 2020, 315, 113805 CrossRef CAS.
- L. Boucherit, T. Douadi, N. Chafai, M. Al-Noaimi and S. Chafaa, Int. J. Electrochem. Sci., 2018, 13, 3997–4025 CrossRef CAS.
- L. Herrag, B. Hammouti, S. Elkadiri, A. Aouniti, C. Jama, H. Vezin and F. Bentiss, Corros. Sci., 2010, 52, 3042–3051 CrossRef CAS.
- A. Zeino, I. Abdulazeez, M. Khaled, M. W. Jawich and I. B. Obot, J. Mol. Liq., 2018, 250, 50–62 CrossRef CAS.
- Y.-C. Dai, W. Yang, X. Chen, L.-H. Gao and K.-Z. Wang, Electrochim. Acta, 2014, 134, 319–326 CrossRef CAS.
- L. Yang, X. Li, Y. Xiong, X. Liu, X. Li, M. Wang, S. Yan, L. A. M. Alshahrani, P. Liu and C. Zhang, J. Electroanal. Chem., 2014, 731, 14–19 CrossRef CAS.
- X. Li, Y. Li, R. Feng, D. Wu, Y. Zhang, H. Li, B. Du and Q. Wei, Sens. Actuators, B, 2013, 188, 462–468 CrossRef CAS.
- H. M. Abd El-Lateef, A. R. Sayed and M. S. S. Adam, Appl. Organomet. Chem., 2019, 33, e4987 CrossRef.
- A. a. A. Massoud, A. Hefnawy, V. Langer, M. A. Khatab, L. Öhrstrom and M. A. M. Abu-Youssef, Polyhedron, 2009, 28, 2794–2802 CrossRef CAS.
- S. R. Gupta, P. Mourya, M. M. Singh and V. P. Singh, J. Mol. Struct., 2017, 1137, 240–252 CrossRef CAS.
- M. Mishra, K. Tiwari, A. K. Singh and V. P. Singh, Polyhedron, 2014, 77, 57–65 CrossRef CAS.
- A. M. Abdel-Gaber, M. S. Masoud, E. A. Khalil and E. E. Shehata, Corros. Sci., 2009, 51, 3021–3024 CrossRef CAS.
- M. Mahdavian and R. Naderi, Corros. Sci., 2011, 53, 1194–1200 CrossRef CAS.
- M. Mahdavian and M. M. Attar, Corros. Sci., 2009, 51, 409–414 CrossRef CAS.
- S. J. Rowan, S. J. Cantrill, G. R. L. Cousins, J. K. M. Sanders and J. F. Stoddart, Angew. Chem., 2002, 114, 938–993 CrossRef.
- J. V. Ragavendran, D. Sriram, S. K. Patel, I. V. Reddy, N. Bharathwajan, J. Stables and P. Yogeeswari, Eur. J. Med. Chem., 2007, 42, 146–151 CrossRef CAS PubMed.
- K. B. Gudasi, S. A. Patil, R. S. Vadavi, R. V. Shenoy and M. S. Patil, Transition Met. Chem., 2005, 30, 726–732 CrossRef CAS.
- S. K. Ahmed, W. B. Ali and A. A. Khadom, Int. J. Ind. Chem., 2019, 10, 159–173 CrossRef CAS.
- H. Lgaz, A. Chaouiki, M. R. M. R. Albayati, R. Salghi, Y. El Aoufir, I. H. I. H. Ali, M. I. M. I. Khan, S. K. S. K. Mohamed and I.-M. I. M. Chung, Res. Chem. Intermed., 2019, 45, 2269–2286 CrossRef CAS.
- N. Chafai, S. Chafaa, K. Benbouguerra, A. Hellal and M. Mehri, J. Mol. Struct., 2019, 1181, 83–92 CrossRef CAS.
- H. Lgaz, I.-M. Chung, M. R. Albayati, A. Chaouiki, R. Salghi and S. K. Mohamed, Arabian J. Chem., 2020, 13, 2934–2954 CrossRef CAS.
- N. Aissiou, M. Bounoughaz and A. Djeddi, Chem. Res. Chin. Univ., 2021, 37, 718–728 CrossRef CAS.
- H. M. A. El-Lateef, K. A. Soliman, M. A. Al-Omair and M. S. S. Adam, J. Taiwan Inst. Chem. Eng., 2021, 120, 391–408 CrossRef CAS.
- M. Chafiq, A. Chaouiki, M. R. Al-Hadeethi, R. Salghi, A. H. Ismat, M. K. Shaaban and I. M. Chung, Colloids Surf., A, 2021, 610, 125744 CrossRef CAS.
- H. Zimmer and E. Shaheen, J. Org. Chem., 1959, 24, 1140–1141 CrossRef CAS.
- H. M. Abd El-Lateef, M. M. Khalaf, M. Gouda, K. Shalabi, F. El-Taib Heakal, A. S. M. Al-Janabi and S. Shaaban, Constr. Build. Mater., 2023, 366, 130135 CrossRef CAS.
- H. M. A. El-Lateef, Z. A. Abdallah and M. S. M. Ahmed, J. Mol. Liq., 2019, 296, 111800 CrossRef CAS.
- H. M. Abd El-Lateef, M. M. Khalaf, K. Shalabi and A. A. Abdelhamid, Chin. J. Chem. Eng., 2023, 55, 304–319 CrossRef CAS.
- O. A. El-Gammal, D. A. Saad and A. F. Al-Hossainy, J. Mol. Struct., 2021, 1244, 130974 CrossRef CAS.
- O. A. El-Gammal, E. A. Elmorsy and Y. E. Sherif, Spectrochim. Acta, Part A, 2014, 120, 332–339 CrossRef CAS PubMed.
- O. A. El-Gammal, M. M. Bekheit and M. Tahoon, Spectrochim. Acta, Part A, 2015, 135, 597–607 CrossRef CAS PubMed.
- Q. H. Zhang, B. S. Hou and G. A. Zhang, J. Colloid Interface Sci., 2020, 572, 91–106 CrossRef CAS PubMed.
- H. M. Al-Saidi, G. A. Gouda, M. Abdel-Hakim, N. I. Alsenani, A. Alfarsi, M. H. Mahross, O. A. Farghaly and S. Hosny, Int. J. Electrochem. Sci., 2022, 17, 220333 CrossRef CAS.
- R. N. El-Tabesh, A. M. Abdel-Gaber, H. H. Hammud and R. Oweini, J. Bio- Tribo-Corros., 2020, 6, 46 CrossRef.
- H. M. Abd El-Lateef, K. Shalabi, A. M. Arab and Y. M. Abdallah, ACS Omega, 2022, 7, 23380–23392 CrossRef CAS PubMed.
- M. M. Solomon, S. A. Umoren, M. A. Quraishi and M. Salman, J. Colloid Interface Sci., 2019, 551, 47–60 CrossRef CAS PubMed.
- F. Rosalbino, G. Scavino, G. Mortarino, E. Angelini and G. Lunazzi, J. Solid State Electrochem., 2010, 15, 703–709 CrossRef.
- E. A. Noor, Mater. Chem. Phys., 2009, 114, 533–541 CrossRef CAS.
- M. S. Shaaban, K. Shalabi, A. E. A. S. Fouda and M. A. Deyab, Z. fur Phys. Chem., 2023, 237, 211–241 CrossRef CAS.
- M. Ontiveros-Rosales, A. Espinoza-Vázquez, F. J. Rodríguez Gómez, S. Valdez-Rodríguez, A. Miralrio, B. A. Acosta-Garcia and M. Castro, J. Mol. Liq., 2022, 363, 119826 CrossRef CAS.
- A. Salhi, A. Elyoussfi, I. Azghay, A. El Aatiaoui, H. Amhamdi, M. El Massaoudi, M. h. Ahari, A. Bouyanzer, S. Radi and S. El barkany, Inorg. Chem. Commun., 2023, 152, 110684 CrossRef CAS.
- M. Hosseini, S. F. L. Mertens, M. Ghorbani and M. R. Arshadi, Mater. Chem. Phys., 2003, 78, 800–808 CrossRef CAS.
- K. M. Abd El-Khalek, K. Shalabi, M. A. Ismail and A. E.-A. S. Fouda, RSC Adv., 2022, 12, 10443–10459 RSC.
- M. En-Nylly, S. Skal, Y. El aoufir, H. Lgaz, R. J. Adnin, A. A. Alrashdi, A. Bellaouchou, M. R. Al-Hadeethi, O. Benali, T. Guedira, H. S. Lee, S. Kaya and S. M. Ibrahim, Arabian J. Chem., 2023, 16, 104711 CrossRef CAS.
- A. G. Sayed, A. M. Ashmawy, W. E. Elgammal, S. M. Hassan and M. A. Deyab, Sci. Rep., 2023, 13, 13761 CrossRef CAS PubMed.
- A. R. Sayed and H. M. A. El-Lateef, Coatings, 2020, 10, 1068 CrossRef CAS.
- M. Chafiq, A. Chaouiki, M. R. Al-Hadeethi, I. H. Ali, S. K. Mohamed, K. Toumiat and R. Salghi, Coatings, 2020, 10, 700 CrossRef CAS.
- S. S. Alarfaji, I. H. Ali, M. Z. Bani-Fwaz and M. A. Bedair, Molecules, 2021, 26, 3183 CrossRef CAS PubMed.
- H. Keleş, D. M. Emir and M. Keleş, Corros. Sci., 2015, 101, 19–31 CrossRef.
- M. Das, A. Biswas, B. Kumar Kundu, M. Adilia Januário Charmier, A. Mukherjee, S. M. Mobin, G. Udayabhanu and S. Mukhopadhyay, Chem. Eng. J., 2019, 357, 447–457 CrossRef CAS.
- K. Subbiah, H.-S. Lee, M. R. Al-Hadeethi, T. Park and H. Lgaz, J. Adv. Res., 2023, 58, 211–228 CrossRef PubMed.
- A. K. Singh, S. Thakur, B. Pani, B. Chugh, H. Lgaz, I.-M. Chung, P. Chaubey, A. K. Pandey and J. Singh, J. Mol. Liq., 2019, 283, 788–803 CrossRef CAS.
- G. Pandimuthu, K. Muthupandi, T.-W. Chen, S.-M. Chen, A. Sankar, P. Muthukrishnan and S.-P. Rwei, Int. J. Electrochem. Sci., 2021, 16, 211153 CrossRef CAS.
- H. Ouici, M. Tourabi, O. Benali, C. Selles, C. Jama, A. Zarrouk and F. Bentiss, J. Electroanal. Chem., 2017, 803, 125–134 CrossRef CAS.
- G. Fan, H. Liu, B. Fan, Y. Ma, H. Hao and B. Yang, J. Mol. Liq., 2020, 311, 113302 CrossRef CAS.
- M. Bouanis, M. Tourabi, A. Nyassi, A. Zarrouk, C. Jama and F. Bentiss, Appl. Surf. Sci., 2016, 389, 952–966 CrossRef CAS.
- A. Berrissoul, A. Ouarhach, F. Benhiba, A. Romane, A. Guenbour, B. Dikici, F. Bentiss, A. Zarrouk and A. Dafali, Ind. Crops Prod., 2022, 187, 115310 CrossRef CAS.
- N. Z. N. Hashim, E. H. Anouar, K. Kassim, H. M. Zaki, A. I. Alharthi and Z. Embong, Appl. Surf. Sci., 2019, 476, 861–877 CrossRef CAS.
- P. Bommersbach, C. Alemany-Dumont, J. P. Millet and B. Normand, Electrochim. Acta, 2005, 51, 1076–1084 CrossRef CAS.
- W. Temesghen and P. Sherwood, Anal. Bioanal. Chem., 2002, 373, 601–608 CrossRef CAS PubMed.
- A. Zarrouk, B. Hammouti, T. Lakhlifi, M. Traisnel, H. Vezin and F. Bentiss, Corros. Sci., 2015, 90, 572–584 CrossRef CAS.
- P. Mourya, P. Singh, R. B. Rastogi and M. M. Singh, Appl. Surf. Sci., 2016, 380, 141–150 CrossRef CAS.
- V. M. Paiva, R. d. S. Nunes, K. C. d. S. de Lima, S. M. de Oliveira, J. R. de Araujo, B. S. Archanjo, A. F. do Valle and E. D'Elia, Surf. Interfaces, 2024, 47, 104187 CrossRef.
- K. Shalabi, H. M. Abd El-Lateef, M. M. Hammouda, A. M. A. Osman, A. H. Tantawy and M. A. Abo-Riya, Materials, 2023, 16, 5192 CrossRef CAS PubMed.
- Y. Kharbach, F. Z. Qachchachi, A. Haoudi, M. Tourabi, A. Zarrouk, C. Jama, L. O. Olasunkanmi, E. E. Ebenso and F. Bentiss, J. Mol. Liq., 2017, 246, 302–316 CrossRef CAS.
- M. Tourabi, K. Nohair, M. Traisnel, C. Jama and F. Bentiss, Corros. Sci., 2013, 75, 123–133 CrossRef CAS.
- A. K. Singh, M. Singh, S. Thakur, B. Pani, S. Kaya, B. E. L. Ibrahimi and R. Marzouki, Surf. Interfaces, 2022, 33, 102169 CrossRef CAS.
- M. Claros, M. Setka, Y. P. Jimenez and S. Vallejos, Nanomaterials, 2020, 10, 471 CrossRef CAS PubMed.
- S. Öztürk, H. Gerengi, M. M. Solomon, G. Gece, A. Yıldırım and M. Yıldız, Mater. Today Commun., 2021, 29, 102905 CrossRef.
- X. Yang, G. He, W. Dong, L. Yu and X. Li, J. Environ. Chem. Eng., 2023, 11, 109846 CrossRef CAS.
- I. Lukovits, E. Kálmán and F. Zucchi, CORROSION, 2001, 57, 3–8 CrossRef CAS.
- S. Bousba, H. Allal, M. Damous and S. Maza, Comput. Theor. Chem., 2023, 1225, 114168 CrossRef CAS.
- S. S. Al-Najjar and A. Y. Al-Baitai, Phys. Chem. Res., 2022, 10, 179–194 CAS.
- H. M. Abd El-Lateef, M. Gouda, M. M. Khalaf, M. A. A. Al-Shuaibi, I. M. A. Mohamed, K. Shalabi and R. M. El-Shishtawy, Polymers, 2022, 14, 3078 CrossRef PubMed.
- B. J. Usman, S. A. Umoren and Z. M. Gasem, J. Mol. Liq., 2017, 237, 146–156 CrossRef CAS.
- H. M. Abd El-Lateef, K. Shalabi and A. H. Tantawy, J. Mol. Liq., 2020, 320, 114564 CrossRef CAS.
- M. Goyal, H. Vashist, S. Kumar, I. Bahadur, F. Benhiba and A. Zarrouk, J. Mol. Liq., 2020, 315, 113705 CrossRef CAS.
- L. H. Madkour, S. Kaya and I. B. Obot, J. Mol. Liq., 2018, 260, 351–374 CrossRef CAS.
- A. Dehghani, A. H. Mostafatabar, G. Bahlakeh and B. Ramezanzadeh, J. Mol. Liq., 2020, 316, 113914 CrossRef CAS.
- M. Özcan, I. Dehri and M. Erbil, Appl. Surf. Sci., 2004, 236, 155–164 CrossRef.
- X. Wang, H. Guo, S. Cai and X. Xu, J. Mol. Struct., 2023, 1294, 136555 CrossRef CAS.
- S. Geng, J. Hu, J. Yu, C. Zhang, H. Wang and X. Zhong, J. Mol. Struct., 2022, 1250, 131778 CrossRef CAS.
- I. B. Onyeachu and M. M. Solomon, J. Mol. Liq., 2020, 313, 113536 CrossRef CAS.
- A. M. Al-Sabagh, N. M. Nasser, E. A. Khamis and T. Mahmoud, Egypt. J. Pet., 2017, 26, 41–51 CrossRef.
- J. Zhang, J. Wang, F. Zhu and M. Du, Ind. Eng. Chem. Res., 2015, 54, 5197–5203 CrossRef CAS.
Footnote |
| † Electronic supplementary information (ESI) available. See DOI: https://doi.org/10.1039/d4ra00404c |
| This journal is © The Royal Society of Chemistry 2024 |

