 Open Access Article
Shellac-mediated laser-induced reduced graphene oxide film on paper and fabric: exceptional performance in flexible fuel cell, supercapacitor and electrocardiography applications†
Pavar Sai
Kumar
a,
Vanmathi
S.
a,
Himanshi
Awasthi
a,
Imran
Khan
a,
Ritesh Kumar
Singh
a,
Vimal Kumar
Sharma
b,
Chandrani
Pramanik
 *b and
Sanket
Goel
 *a
*a
aMEMS, Microfluidics and Nanoelectronics (MMNE) Lab, Department of Electrical and Electronics Engineering, Birla Institute of Technology and Science (BITS) Pilani, Hyderabad Campus, Hyderabad 500078, India. E-mail: sgoel@hyderabad.bits-pilani.ac.in
bGraphene Centre, Tata Steel Limited, Jamshedpur, Jharkhand 831007, India. E-mail: chandrani.pramanik@tatasteel.com
First published on 12th June 2024
Abstract
The versatile properties of graphene and ancillary materials in various areas have accelerated the development of optimized methods, particularly using natural sources. Herein, natural shellac (biopolymer) (C25H51COOH), with inherent long carbon chains, is leveraged as a potential resource in improving the physiochemical properties of laser-induced reduced graphene oxide (rGO). A versatile 450 nm blue diode laser produced biopolymer-assisted rGO on environmentally friendly flexible paper and cloth samples. The methodology led to the formation of improved rGO with electrical sheet resistances as low as 2.3 Ω Sq.−1 Moreover, thorough characterizations revealed that the average number of rGO layers is as low as 11. The potential of shellac-assisted rGO was validated in four significant applications. First, a disposable 2-electrode enzymatic biofuel cell (EBFC) was developed on biopolymer-assisted paper samples, which led to the generation of a power density of 66.7 μW cm−2. Second, rGO interdigitated electrode (IDE) supercapacitors were patterned over dual shellac varieties of paper and showed a maximum areal capacitance of 31.25 mF cm−2 at a current density of 0.5 mA cm−2. Third, the rGO-patterned electrode system on biopolymer-assisted paper successfully yielded notable conventional ECG signals, specifically P, R, T, and QRS complexes. Moreover, the signal-to-noise ratio (S/N ratio) notably increased to 24%, surpassing the S/N ratio observed using the conventional Ag/AgCl electrode system. Ultimately, printed electronic circuits were demonstrated on cloth samples for wearable applications. The utilization of natural biopolymers to enhance rGO holds significant promise for a wide range of potential applications in the future.
1. Introduction
Exceptional structural and physiochemical properties of graphene and graphene-derived resources have gained tremendous research interest compared with other carbon allotropes.1,2 The sp2 hybridized two-dimensional (2D) single-atom layered graphene material has found diverse applications since its first synthesis report by Novoselov and Geim in 2004.3 Theoretically, the conductive property of graphene was described by Wallace in 1947 via its electron hopping from one lattice site to another by applying the tight-binding model.4 Graphene has various unique properties, such as 2 × 105 cm2 V−1 s−1 electron mobility rate, ∼125 GPa fracture strength, ∼1 TPa tensile strength, ∼5000 W mK−1 thermal conductivity, and more than 2630 m2 g−1 of the theoretical specific surface area (SSA).5,6Despite such unique properties of graphene and its progressive synthesis techniques, began the race for its potential findings.7,8 Numerous kinds of graphene-derived materials, including graphene oxide (GO), reduced graphene oxide (rGO), multilayered graphene, graphene composites, and graphene ribbons, have been synthesized for prominent specific applications.9–11 Conventional synthesis methods can be categorized as top-down methods via mechanical exfoliation (utilizing high-speed ball milling, high shear homogenizer, ultrasonication, etc.) and bottom-up synthesis methods (e.g., chemical vapor depositions (CVD), pulse vapor deposition (PVD) and electric arc discharge).12 However, these techniques exhibit certain drawbacks, such as toxic chemical treatments, exposure to high annealing temperatures, tedious post-processing such as drying and solvent recovery, and the release of harsh chemical byproducts. In addition, these techniques constrain affordability and qualitative stabilities, thus lowering scalabilities and posing environmental challenges.13
Alternatively, the current studies focus on synthesizing graphene oxide (GO) by chemical exfoliations of graphite as a graphene derivative with comparatively lower limitations.14 GO has graphene-like structural properties with covalently attached oxygen functional groups (carboxyl, hydroxyl, and carbonyl) as defects. However, GO could not meet the exceptional electrical, optical, and mechanical properties of graphene.15
Reduced graphene oxide (rGO) synthesis replaces the GO with its graphene-like properties, including higher conductivities, lower sheet resistances, and improved thermal properties.16 The standard method for obtaining rGO was through the thermal and chemical reductions of GO. The popular methods include microwave-assisted synthesis, wet-chemical processes, high-temperature thermal treatments, and often multi-step reductions.17 Nevertheless, the traditional processes involve toxic chemical reagents (hydrazine hydrates and dimethylhydrazines) and high annealing temperatures (from ∼1000 to 1200 °C), releasing hazardous gases into the environment.18 The challenge in obtaining high-quality rGO, a potential resource between GO and graphene, has been to explore single-step, non-toxic, and non-tedious production techniques.
Recent work from our group highlights the one-step methodology for obtaining high-quality rGO through laser irradiation on simple filter paper.19,20 One highlight of the work was obtaining rGO without utilizing GO as an intermediate precursor or a carbon source. Instead, rGO was acquired by laser irradiation onto a simple filter paper with controlled parameters.21,22 However, the work was limited by its lower electrical and physicochemical properties due to the insufficient penetration of laser fluence into the substrate, restricted by its thickness. The continued investigations found an attractive, biodegradable, and eco-friendly natural polymer, shellac, as a natural resource to suppress the limitations of our reported process.19
Natural shellac (C25H51COOH), containing longer carbon chains, could be leveraged as a supporting polymeric resource in treating the samples to develop an enhanced rGO material. Moreover, shellac is widely available as a natural resin or biopolymer secreted by the lac bugs on the trees of several countries, including India and Myanmar.23 Such natural polymers can be broadly classified into two types: Shellac and Dewaxed shellac.24
Shellac has already been proven to produce graphene film on various substrates stable for high temperatures.25 However, for the first time, to the best of our knowledge, the biopolymer was used as a supporting source on biodegradable substrates, such as paper and cloth, to obtain rGO material in a single step at room temperature and in a normal atmosphere with enhanced properties. The laser irradiations were optimized onto the treated paper and cloth samples to obtain high-quality rGO material. The obtained material was thoroughly characterized owing to its optical, structural, electrical, and morphological details. Moreover, the potential of biopolymer-assisted rGO was revealed by deploying it into three applications, including recording electrocardiogram (ECG) signals from miniaturized ECG electrodes. Exceptional results were obtained by developing an enzymatic biofuel cell on biopolymer-assisted rGO paper samples and energy harvesting using an interdigitated electrode (IDE) system for supercapacitor studies.
2. Experimental section
2.1. Materials and methods
Commercially available analytical-grade chemicals were used throughout the experiments. Double-distilled deionized water (18.2 MΩ, conductivity <0.055 μS cm−1) was obtained from an ultra-water purifier (Wasserlab, Automatic Plus, Spain). Ethanol (C2H5OH) (≥99.0%), isopropanol ((CH3)2CHOH), 99.9% (IPA), and Whatman qualitative grade 1 filter papers (580 mm × 680 mm) were purchased from Merck Life Science, India. Parafilm M (a self-sealing thermoplastic film (4-inch × 125 ft.)) and cotton fabric cloth (100 GSM) were purchased from Amazon, India. Sodium tetraborate (Na2B4O7) (anhydrous ≥99.0%) and boric acid (H3BO3) (ACS reagent ≥99.5%) were purchased from SRL Chemicals Pvt. Ltd, India. High-quality Dewaxed Shellac (DS) and Shellac (S) flakes were purchased from DM Shellac Pvt. Ltd, India.2.2. Apparatus and instrumentation
A tabletop scientific mechanical convection oven (Thermoscientific, Heratherm, Advanced protocol oven, 230 V AC, 60 Hz, USA) was utilized for all the sample drying requirements. A magnetic stirrer with a controlled hotplate unit (Tarsons, (6090) SPINOT, India) was utilized for uniform solution preparations. A hot roll laminator (A3 Mega, Mega Electronics, Linton, UK) was used to apply the parafilm as a supporting structure to the paper and cloth substrates. The carbonization was performed using a 450 nm blue diode class 4 laser system (ZMorph VX, Multitool model, Poland) with 2.8 W maximum power and 120 mm s−1 travel speed.2.3. Prior treatments and coating of biopolymer solutions onto substrates
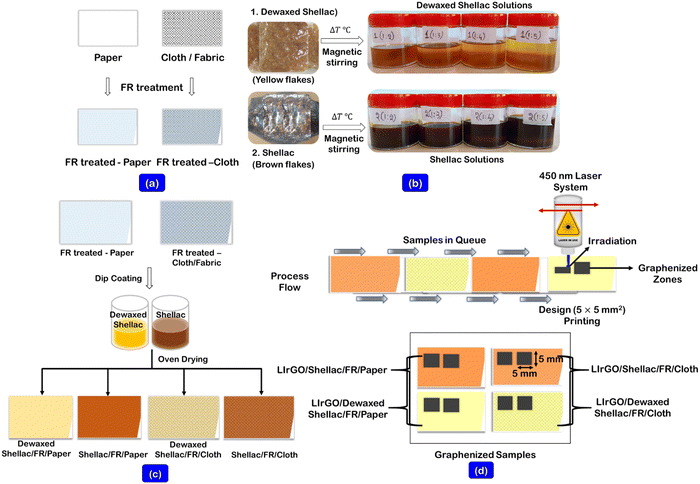
Initially, the obtained grade 1 qualitative filter papers and cloth substrates were cleaned thoroughly using IPA solution and dried at 55 °C for 15 min, ensuring that they were completely dried. The fire retardant (FR) solution (12.75 g of Na2B4O7 and 5.67 g of H3BO3) was prepared in 190 mL of DI water, as shown in our previously reported work (solution A).19 The prepared FR solution (solution A) was prior dip coated on both substrates and dried at 55 °C for 15 min, ensuring complete drying, as shown in Fig. 1a.The biopolymer solutions of Dewaxed shellac (DS) and shellac (S) were prepared by varying the ratio of biopolymer to IPA solvent from 1/1 to 1/5 (w (g)/v (mL)), as shown in Fig. 1b. However, it was found that the ratios 1/1 and 1/2 were challenging to coat due to insufficient solvent consistency. Further, the uniform solutions were made possible through continuous hotplate stirring at 65 °C for 2 h. (solution B). The varying ratios (from 1/3 to 1/5 (w (g)/v (mL))) of biopolymer solutions (solution B) were then dip-coated onto the FR-treated samples and allowed to dry at 55 °C for 1 h. (Fig. 1c).
2.4. Process of laser irradiation on biopolymer-assisted substrates
The graphenized material was produced using laser irradiation using the stored Dewaxed shellac (DS) and Shellac (S)-assisted substrates. The patterns (5 × 5 mm2) were designed in a CAD model, and the gcode-converted files were transferred to the blue diode laser system. The controlled laser parameters (i.e., laser power, speed, and focus) were ablated onto the substrates to yield the graphenized materials. Fig. 1d shows the process flow in obtaining the graphenized zones on the biopolymer-assisted substrates. The formed rGO film temperature stability studies were carried out by developing a printed resistive sensor on paper. The results are shown in ESI† (Sections S1 and S1.1). In addition, the obtained rGO films were subjected to antibacterial testing via the agar diffusion plate process using bacterial organisms (staphylococcus aureus ATCC 6538 and Klebsiella pneumoniae ATCC 4352), and the test results are presented in ESI† (Sections S1 and S1.2).2.5. Material characterizations
This information is provided in a supplementary file (Sections S2 and S2.1, ESI†).3. Results and discussion
3.1. Sheet-resistance characterizations
The benchmark four-probe method was considered in the preliminary optimizations of the biopolymer-assisted laser-induced rGO (LIrGO) samples. The laser parameters were iterated to obtain the minimum possible sheet resistance calculated using the following equation: ; ‘ΔV’ = measured inner probe voltage change, and ‘I’ = applied direct current at outer probes.26 All the iterations were conducted throughout the test on printed 5 × 5 mm2 rGO converted patterns. Tables 1 and 2 show the optimizations performed via laser induction on both Dewaxed Shellac and Shellac-assisted paper substrates (LIrGO/Dewaxed Shellac/Paper and LIrGO/Shellac/Paper), respectively.
| LIrGO/Dewaxed Shellac/FR/Paper | |||||
|---|---|---|---|---|---|
| Dewaxed shellac/IPA (w/v) | (1/3) | (1/4) | (1/5) | ||
| Laser power (%) | Laser power (W) | Laser speed (%) | Avg. sheet resistance (Rs) (Ω Sq.−1) (n = 3) | ||
| ‘–’ insufficient dosage; ‘×’ higher dosage (i.e., substrate cut, discarded); laser max. Power: 2.8 W; laser max. Speed (300%): 120 mm s−1; LIrGO: laser-induced rGO. | |||||
| 15 | 0.42 | 100% or 40 mm s−1 | — | — | — |
| 20 | 0.56 | — | 15.9 | 14.4 | |
| 25 | 0.7 | 14.1 | 11.2 | 9.9 | |
| 30 | 0.84 | 11.7 | × | × | |
| 35 | 0.98 | × | × | × | |
| LIrGO/Shellac/FR/Paper | |||||
|---|---|---|---|---|---|
| Shellac/IPA (w/v) | (1/3) | (1/4) | (1/5) | ||
| Laser power (%) | Laser power (W) | Laser speed (%) | Avg. sheet resistance (Ω Sq.−1) (n = 3) | ||
| ‘×’ higher dosage (i.e., substrate cut, discarded); laser max. Power: 2.8 W; laser max. Speed (300%): 120 mm s−1; LIrGO: laser-induced rGO. | |||||
| 15 | 0.42 | 100% or 40 mm s−1 | 69.8 | 48.7 | 27.8 |
| 20 | 0.56 | 31.8 | 21.8 | 15.6 | |
| 25 | 0.7 | 15.3 | 13.2 | × | |
| 30 | 0.84 | 9.3 | 9.0 | × | |
| 35 | 0.98 | 7.5 | 7.0 | × | |
The experimental results validate the significance of the laser parameters in obtaining the optimized sheet resistance of the developed rGO material. As shown in Tables 1 and 2, the insufficient dosage (represented as ‘–’) resulted in the incomplete formation of the designed pattern. Further, the higher dosage (represented as ‘×’) pierced the substrate (e.g., shown in cf., Fig. S1, ESI†). In the Dewaxed shellac/FR/Paper, the 1/5 ratio of the solution was suitable for obtaining a minimum sheet resistance of 9.9 Ω Sq.−1 (cf., Table 1). Similarly, the Shellac/FR/Paper, 1/4 ratio provided a minimum sheet resistance of 7.0 Ω Sq.−1, as shown in Table 2.
The solution-optimized constituents were utilized in optimizing the laser parameters to obtain possible minimum sheet resistances on cloth substrates. Therefore, the optimizations on cloth substrates leveraged the optimum solution ratios of 1/5 and 1/4 for the Dewaxed shellac/FR/Cloth and Shellac/FR/Cloth, respectively. The plots of sheet resistance variation with the change in laser parameters are shown for rGO/Dewaxed shellac/FR/Cloth and rGO/Shellac/FR/Cloth in Fig. S2 and S3 (ESI†), respectively. Interesting results were obtained for the cloth samples, and the minimum average sheet resistance values of rGO/Dewaxed shellac/FR/Cloth and rGO/Shellac/FR/Cloth were 2.3 Ω Sq.−1 and 3.4 Ω Sq.−1, respectively. However, the observations found the piercing of substrate at higher dosages; therefore, the optimized sheet resistance values of 9.9 Ω Sq.−1 and 8.1 Ω Sq.−1, respectively, were considered for future experiments, as shown in Table 2 and Section S3 and Table S3 (ESI†).
3.2. Structural characterizations
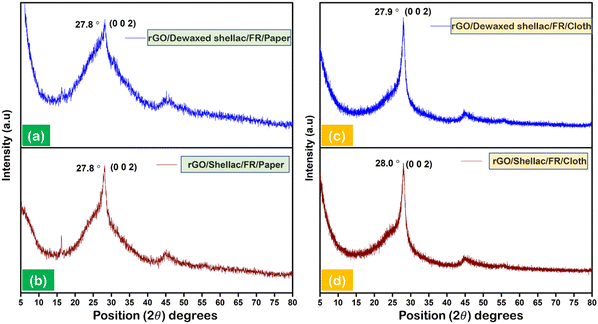
X-ray diffraction (XRD) was carried out to analyze the intrinsic structural properties of the developed biopolymer-assisted rGO.27 The patterned (10 × 10 mm2) squares of rGO were hand scrapped from developed films to collect the rGO powder prior to the experimentation. Fig. 2 depicts the XRD patterns of the rGO developed on paper and cloth samples. The observations showed significant characteristic peaks for rGO developed on both paper samples, as shown in Fig. 2a and b. However, both cloth samples exhibit the comparative sharp, intense peaks of rGO, as shown in Fig. 2c and d. The obtained intense peaks (∼27.8°) and the secondary in-plane peaks (∼47.2°) for all the samples validate the formation of rGO in accordance with state-of-the-art.28–31 Further, the approximate number of rGO layers formed in both paper and cloth samples was calculated according to the literature.32–34 It was observed that the minimum average number of rGO layers (N = 11) was obtained on paper samples and the maximum average number of rGO layers (N = 77) was found for cloth substrates, as shown in Section S4 (ESI†).3.3. Morphological analysis
The FESEM observations were performed on the developed rGO patterns on paper and cloth samples without further post-processing. Fig. 3(a) and (b) show the transformed fibers of the paper to biopolymer-assisted rGO fibrous morphologies. It was found that the average fiber thicknesses of rGO/Dewaxed shellac/FR/Paper and rGO/Shellac/FR/Paper were 26.5 μm and 11.2 μm, respectively. Further, the observations indicate that the biopolymer assisted in the uniform growth of continuous fibrous, as shown in Fig. 3(a) at a 100 μm resolution. Moreover, the absence of wax content (<0.2% (v/v)) in Dewaxed shellac-assisted paper shows broken open fiber in Fig. 3(a) (inset at 5 μm). Additionally, the presence of wax (3–6% (v/v)) in Shellac-assisted paper showed the adsorption of polymer on fiber, supporting its growth with a comparatively reduced thickness, as shown in Fig. 3(b) (inset at 5 μm). Moreover, the composition elemental mappings of rGO/Dewaxed shellac/FR/Paper and rGO/Shellac/FR/Paper are shown in the Fig. S4 and S5 (ESI†), respectively. Similarly, the composition elemental mapping of rGO/Dewaxed shellac/FR/Cloth and rGO/Shellac/FR/Cloth are also shown in Fig. S6 and S7 (ESI†), respectively. Contrary to this, our previous work showed that the rGO developed from paper (i.e., without any modifications) was comparatively low in electrical properties with increased fiber thickness and broken, discontinuous fibers.19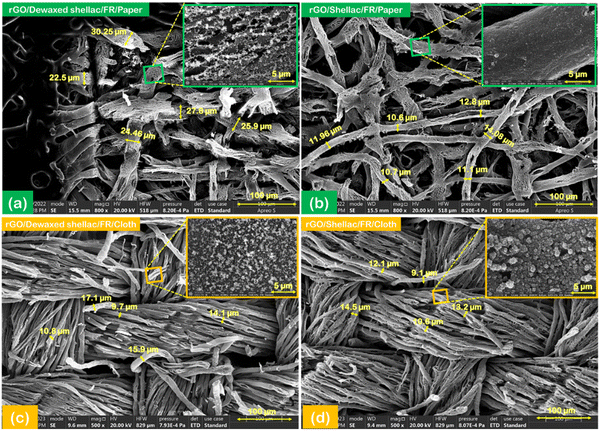 | ||
| Fig. 3 Field emission scanning electron microscopy images: (a) LIrGO/Dewaxed shellac/FR/Paper (Inset: 5 μm and 100 μm high-resolution images), (b) LIrGO/Shellac/FR/Paper, (c) LIrGO/Dewaxed shellac/FR/Cloth, and (d) LIrGO/Shellac/FR/Cloth (all insets: 100 μm high-resolution images, shown separately in ESI† (Fig. S19)). | ||
Fig. 3(c) and (d) show the SEM images of the crossing yarns transformed into biopolymer-assisted rGO yarns. In the assisted Dewaxed shellac and Shellac cotton cloths, the average thicknesses of the rGO yarns were 13.1 μm and 11.2 μm (±1 μm), respectively. Further, the cross-sectional information was provided for the developed laser-irradiated rGO on the biopolymer-assisted cloth sample in Fig. S8 (ESI†). Similar to the paper substrates, the LIrGO/Dewaxed shellac/FR/Cloth showed porous open yarn at 5 μm resolution (i.e., due to the minimal presence of wax content (0.2% v/v)), as shown in Fig. 3(c) inset. However, the LIrGO/Shellac/FR/Cloth showed thick polymer adsorption (i.e., due to the presence of its wax content (3% to 6% (v/v))) over the developed rGO yarns, as shown in Fig. 3(d) inset. Moreover, the untreated/bare paper and cloth FESEM images are presented in (Fig. S20, ESI†).
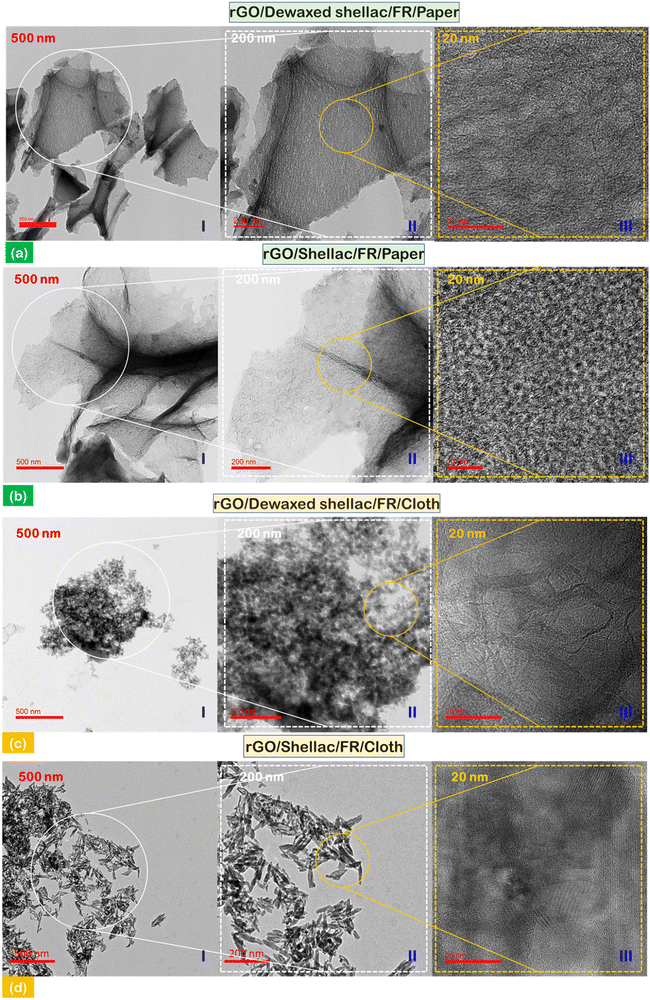
Subsequently, transmission electron microscopy (TEM) was performed to observe the atomic arrangements and morphological details. Fig. 4(a) and (b) show the distribution of rGO flakes developed on the biopolymer-assisted paper samples (I) – 500 nm; further, the higher resolution of material was shown in the inset image of (II) – 200 nm. In addition, the atomic orientation and arrangements can be observed in the inset image of (III) – 20 nm. At this higher resolution in the paper samples (both dewaxed shellac and shellac cases), it was observed that the atomic arrangement was short-range ordered with an increased number of grain boundaries with overlapping atomic distributions. In addition, the TEM observations of rGO developed on biopolymer-assisted cloth samples showed the rGO clusters in the Dewaxed shellac/FR/Cloth sample (Fig. 4c(I) – 500 nm) instead of flakes as in paper samples. However, distorted rectangular stands of rGO were found in the Shellac/FR/Cloth sample (Fig. 4d(I) – 500 nm). In addition, comparatively significant uniformity of atomic arrangements (i.e., relatively long-range ordered atomic arrangement) was observed in cloth samples than in paper (inset images (Fig. 4c(III) and d(III) – 20 nm)). The key finding derived from the transmission electron microscopy (TEM) study was that the transparency of reduced graphene oxide (rGO) on paper samples was more significant compared to that on cloth samples. This difference in transparency was due to the lesser number of rGO layers, as indicated by the data presented in Section S4 (ESI†) (Table S4).
3.4. X-ray photoelectron spectroscopy (XPS) analysis
XPS analysis was carried out to investigate the surface electronic states of the developed biopolymer-assisted rGO material. Fig. S14 (ESI†) shows the XPS information on Dewaxed shellac/FR/Paper and Shellac/FR/Paper. The wide-scan observations of both types of the laser-irradiated biopolymer-assisted papers showed the presence of characteristic peaks. It includes carbon (C) (285.01 eV), oxygen (O) (533.1 eV), and sodium (Na) (1073.05 eV), indicating the formation of rGO,35 as shown in Fig. S14(a) and (c) (ESI†). Further, the quality of rGO developed was found from the elemental atomic weight percentages as C: 86.9%, O: 11.9%, (C/O: 7.3) and Na: 1.2% for the LIrGO/Dewaxed shellac/FR/Paper, as shown in Fig. S14(a) (ESI†). Similarly, the LIrGO/Shellac/FR/Paper showed C: 86.4%, O: 12.7%, (C/O: 6.8), and Na: 0.9%, as shown in Fig. S14(c) (ESI†). Moreover, the C 1s narrow-scan XPS spectra indicate the chemical bondings of the rGO at the binding energies of 284.8 eV, 286.2 eV (±0.2 eV), and 289.1 eV (±0.2 eV), representing C![[double bond, length as m-dash]](https://www.rsc.org/images/entities/char_e001.gif) C, C–O, and O–C
C, C–O, and O–C![[double bond, length as m-dash]](https://www.rsc.org/images/entities/char_e001.gif) O bonds, respectively, as shown in Fig. S14(b) and (d) (ESI†).
O bonds, respectively, as shown in Fig. S14(b) and (d) (ESI†).
Similar characteristics of rGO were observed in the laser-induced biopolymer-assisted cloth samples. Fig. S15(a) and (c) (ESI†) show the characteristic peaks of carbon (C) (285.1 eV), oxygen (O) (532.08 eV), and sodium (Na) (1072.3 eV). Further, the elemental atomic weight percentages were C: 89.9%, O: 9.39%, (C/O): 9.6, and Na: 0.71 for LIrGO/Dewaxed shellac/FR/Cloth. Moreover, the LIrGO/Shellac/FR/Cloth shows the atomic percentages as C: 88.9%, O: 10.6, (C/O: 8.4) and Na: 0.49. It was observed that the biopolymer-assisted cloth samples showed improved C/O ratios compared to the biopolymer-assisted paper substrates. In addition, the narrow scan survey of the C 1s spectra indicates the chemical bondings of rGO at 284.8 eV, 286.1 eV (±0.1 eV), and 289.1 eV (±0.1 eV), representing the C![[double bond, length as m-dash]](https://www.rsc.org/images/entities/char_e001.gif) C, C–O, and O–C
C, C–O, and O–C![[double bond, length as m-dash]](https://www.rsc.org/images/entities/char_e001.gif) O bonds, respectively, as shown in Fig. S15(b) and (d) (ESI†).
O bonds, respectively, as shown in Fig. S15(b) and (d) (ESI†).
3.5. Optical characterizations
UV-visible (UV-vis) spectral measurements were performed to analyze the electronic transitions of the developed biopolymer-assisted LIrGO material. The scrapped and collected samples of rGO (5 mg) were dispersed into an ethanol solution (50 mL) and sonicated for 30 minutes prior to the experimentation. The solutions were further 10-fold (0.1 mg mL−1) diluted before obtaining the UV-vis spectral information. Fig. 5a shows the intense absorbance peaks at 268 nm, corresponding to the rGO developed on biopolymer-assisted paper samples. Similarly, Fig. 5b shows the maximum absorbance of developed LIrGO/Dewaxed shellac/FR/Cloth at 269 nm and the slight red shift of intense absorbance peak at 271 nm (π → π* for LIrGO/Shellac/FR/Cloth). The narrow band gap between the ground and excited states generally requires lower electron transition energies, thereby absorbing longer wavelengths. In addition, the n → π* electronic transition was observed in the presence of C![[double bond, length as m-dash]](https://www.rsc.org/images/entities/char_e001.gif) O in all the developed rGO samples, and the state of art further validated the optical characteristics of rGO.36,37
O in all the developed rGO samples, and the state of art further validated the optical characteristics of rGO.36,37
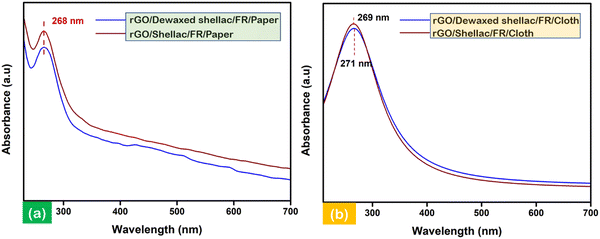 | ||
| Fig. 5 Electronic transitional characterization via UV-vis spectroscopy: (a) rGO developed on biopolymer-assisted paper samples and (b) rGO developed on biopolymer-assisted cloth samples. | ||
3.6. Raman spectroscopy analysis
The developed biopolymer-assisted rGO material over cloth and paper samples was subjected to Raman spectroscopy to characterize the structural defects and distortions in the material.38Fig. 6 shows the Raman spectra of the samples (i.e., paper and cloth) altogether. The Raman active intense peaks were found at 1345.5 cm−1 and 1585.1 cm−1 for rGO developed on both biopolymer-assisted paper samples. Further, the peaks correspond to the disordered D band (i.e., in the presence of sp3 hybridized C–C bondings) and characteristic graphitic G band (i.e., in the presence of conjugate π bonds of sp2 hybridized C![[double bond, length as m-dash]](https://www.rsc.org/images/entities/char_e001.gif) C), as shown in Fig. 6a. Moreover, the presence of an intense second-order transition band (2D) can be observed at 2698.4 cm−1, indicating the quality of the obtained material, as shown in Fig. 6a. Further, as shown in Fig. 6(a), (ID/IG) = 0.25 and (I2D/IG) = 0.7 for rGO/Dewaxed shellac/FR/Paper, and (ID/IG) = 0.36 and (I2D/IG) = 0.52 for rGO/Shellac/FR/Paper.
C), as shown in Fig. 6a. Moreover, the presence of an intense second-order transition band (2D) can be observed at 2698.4 cm−1, indicating the quality of the obtained material, as shown in Fig. 6a. Further, as shown in Fig. 6(a), (ID/IG) = 0.25 and (I2D/IG) = 0.7 for rGO/Dewaxed shellac/FR/Paper, and (ID/IG) = 0.36 and (I2D/IG) = 0.52 for rGO/Shellac/FR/Paper.
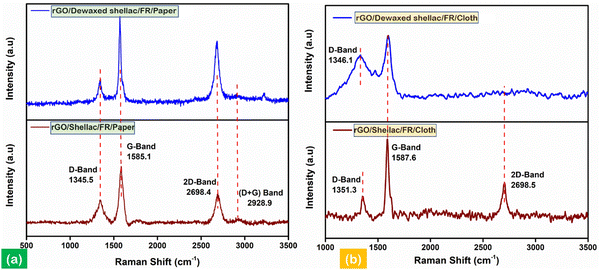 | ||
| Fig. 6 Raman analysis in identifying structural disorders, (a) analysis of rGO developed on biopolymer-assisted paper samples and (b) analysis of rGO developed on biopolymer-assisted cloth samples. | ||
In addition, the Raman spectra of the rGO developed on biopolymer-assisted cloth samples are shown in Fig. 6b. The observations found a similar characteristic G band at 1587.6 cm−1 and the disordered D bands at 1346.1 cm−1 and 1351.3 cm−1 for rGO/Dewaxed shellac/FR/Cloth and rGO/Shellac/FR/Cloth samples, respectively. The qualitative analysis found that (ID/IG) = 0.67 for the rGO/Dewaxed shellac/FR/Cloth and (ID/IG) = 0.32 and (I2D/IG) = 0.46 for the rGO/Shellac/FR/Cloth. Moreover, the obtained rGO material followed the literature entirely.39 Further, the specific surface area (SSA) and pore size measurements with complete calculations are presented in Section S5 (ESI†).
4. Diversified applications
4.1. Disposable enzymatic biofuel cell (EBFC)
Notably, glucose was employed as a source of energy to facilitate the conversion of its chemical energy into highly efficient electrical energy, accomplished by utilizing a biodegradable two-electrode rGO/Shellac/FR/Paper system. The materials and instrumentation used for this study are included in the (Section S6, ESI†). The developed electrodes (5 mm × 20 mm) were exposed to oxygen plasma and were treated with N1 - ((ethylimino)methylene) – N3 (EDC), 5-pyrrolidine-dione (NHS), and (EDC-NHS) (1![[thin space (1/6-em)]](https://www.rsc.org/images/entities/char_2009.gif) :
:![[thin space (1/6-em)]](https://www.rsc.org/images/entities/char_2009.gif) 3) linkage before enzyme immobilizations. The anodic electrode was modified using GOx (8 mg mL−1), while the cathodic electrode was treated using laccase (8 mg mL−1). The SEM images are shown in (Fig. S9B, ESI†). However, in each modification, complete drying of electrodes was ensured prior to the consequent treatments in the process flow, as shown in (Fig. S9A, ESI†).
3) linkage before enzyme immobilizations. The anodic electrode was modified using GOx (8 mg mL−1), while the cathodic electrode was treated using laccase (8 mg mL−1). The SEM images are shown in (Fig. S9B, ESI†). However, in each modification, complete drying of electrodes was ensured prior to the consequent treatments in the process flow, as shown in (Fig. S9A, ESI†).
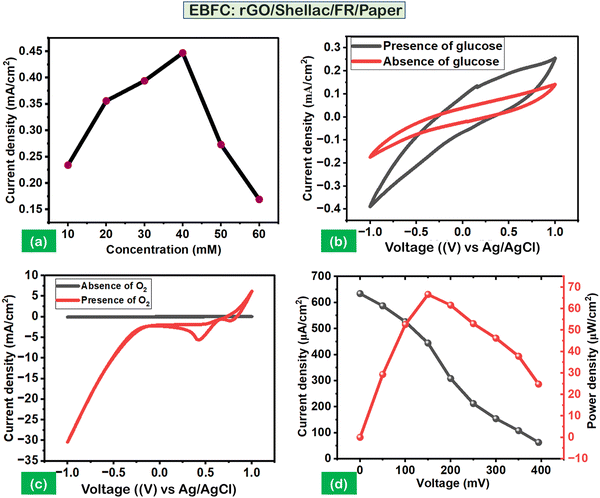
Linear sweep voltammetry analysis was carried out to optimize the concentrations of glucose (10 mM to 60 mM). It was observed that the maximum current density (CD) (0.459 mA cm−2) was obtained at 40 mM, as shown in Fig. 7a. The performance of the anodic and cathodic electrodes was analyzed via cyclic voltammetry (CV) studies. The setup leveraged a standard Ag/AgCl electrode as a reference and a platinum electrode as a counter. Further, the experimental CV parameters include 50 mV s−1 scan speed, a −1 V to 1 V voltage range, 5 mL of cell volume, and 0.1 M PBS (pH 7). Fig. 7b shows the negligible anodic performance without glucose (40 mM). However, its presence promotes the efficiency of an immobilized enzyme (GOx), resulting in an oxidation peak at a CD of 0.25 mA cm−2 and 0.9 V. Similarly, the cathodic performance showed an improved CD of 5.2 mA cm−2 at 0.4 V in the presence of oxygen (O2) purge than its absence, as shown in Fig. 7c.
Further, the chronoamperometry (CA) was carried out to obtain the polarization performance analysis on the developed 2-electrode system of biopolymer-assisted rGO, as shown in (Fig. S9A, ESI†). Fig. 7d illustrates the maximum power density (PD) of 66.7 μW cm−2 at a CD of 634 μA cm−2 with a steady open circuit voltage of 394 mV. The polarization analysis indicates the possibility of superior electron kinetics and redox reactions through the developed rGO material and its active sites for enzyme immobilization.21
4.2. Supercapacitor (SC) studies
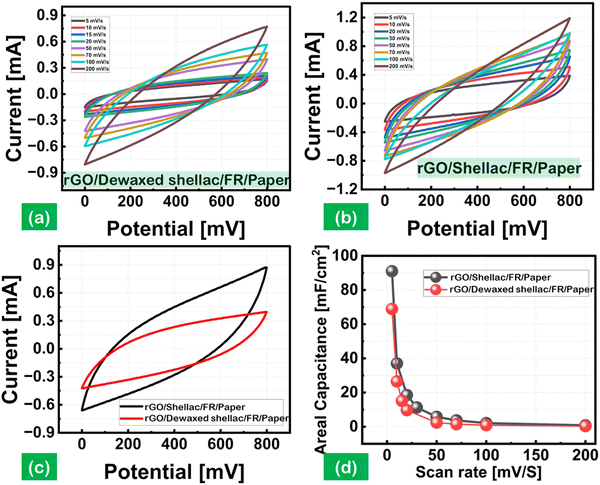
The rapidly expanding wearable, flexible, and integrated electronic markets increase the demand for miniaturized energy harvesting devices. The attractive characteristics of supercapacitors in producing higher power densities (PD) attracted these rapidly growing markets, mainly using interdigitated electrode designs.40 The interdigitated electrodes were fabricated over the biopolymer-assisted LIrGO on both paper samples. The developed patterns have an active surface area of 1.2 cm2, as shown in (Fig. S10, ESI†). The cyclic voltammetry (CV) studies were carried out using a potentiostat (OrigalLys, Origaflex-OGF500 pack, France) with 3 M NaCl as an electrolyte and a potential scan from 0 to 800 mV as experimental parameters. Fig. 8(a) and (b) show the CV analysis for analyzing the relationship between the current (mA) and voltage (V), with the effect of the scan rate varying from 5 mV s−1 to 200 mV s−1 for both paper substrates. The increasing scan rates showed an increased current response with a standard quasi-rectangular form in the CV curves. The obtained CV curves indicate the reversibility of the developed materials by the potential redox peaks.41Moreover, a comparative CV curve is shown in Fig. 8(c) at a constant 50 mV s−1 scan rate, which indicates the produced capacitance by the sorption of ions from the electrolyte, leading to the formation of a double layer (EDL) over the electrode surface.42 The areal capacitance trends as a function of the scan rates (5 mV s−1 to 200 mV s−1) are shown in Fig. 8(d). The rGO SC developed on Dewaxed shellac paper substrate showed an areal capacitance of 68.8 mF cm−2 to 0.3 mF cm−2, and the rGO SC developed on Shellac paper substrate showed a higher areal capacitance of 91 mF cm−2 to 0.7 mF cm−2. It was observed that the increase in scan rate decreased the areal capacitance, following the equation below:
Further, the logarithmic decay in the areal capacitance was observed due to the diffusion limitations at higher scan rates, decreasing the EDL capacitances. Moreover, the EDL capacitance is in direct proportion to the specific capacitance. The decay may also be attributed to the increase in resistance within the electrode material's active surface or at the electrolytes and electrode surface interface.
The developed patterns of rGO on both paper samples were further characterized using the galvanostatic charge–discharge (GCD) analysis. The test conditions leveraged the varying current density inputs, including 0.1, 0.2, 0.25, 0.5 mA cm−2 and 0.25, 0.5, 1, 1.5 mA cm−2, on rGO/Dewaxed shellac/FR/Paper and rGO/Shellac/FR/Paper samples, as shown in Fig. S18(a) and (b) (ESI†). Moreover, the nearly obtained triangular shapes indicate the energy storage dynamics of the rGO on both paper samples.43 The comparative areal capacitance at a current density (CD) of 0.5 mA cm−2 showed a maximum capacitance of 31.25 mF cm−2 with the rGO/Shellac/FR/Paper. In contrast, the rGO/Dewaxed shellac/FR/Paper showed 16.87 mF cm−2 capacitance, as shown in Fig. S18(c) (ESI†). Further, the electrochemical impedance spectroscopy (EIS) study was performed at a frequency ranging from 10 kHz to 10 MHz, and the obtained Nyquist plot, as shown in Fig. S18(d) (ESI†), was analyzed to obtain the equivalent series resistance (ESR). An ESR of 118.6 Ω cm2 was obtained by calculations for the rGO/Shellac/FR/Paper, while a higher ESR of 224.5 Ω cm2 was derived for the rGO/Dewaxed shellac/FR/Paper. Moreover, a lower ESR indicates higher ion diffusion electrochemical behaviors with increased electrode conductivities and vice versa.44 In general, the utilization of biopolymer-assisted reduced graphene oxide (rGO) on paper samples demonstrates considerable promise in the field of supercapacitor applications.
4.3. Electrocardiogram signals from rGO patterns
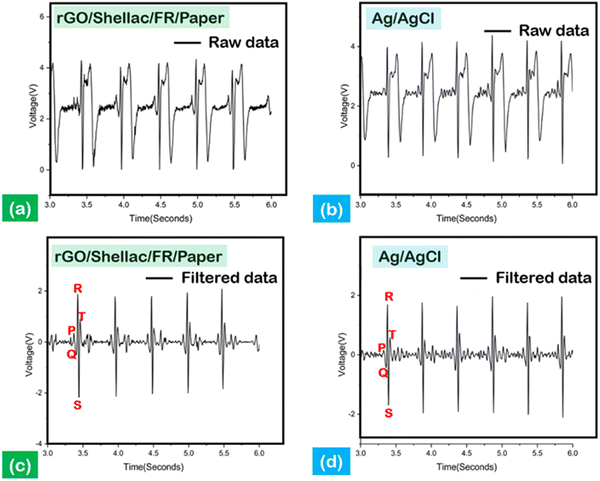
Electrocardiography (ECG) is an essential diagnostic method to monitor body signals, including blood pressure (BP), glucose levels, and heart health.45 However, the ECG signals recorded at the hospitals were for a limited treatment period due to the high cost involved. Further, the increase in health disorders demands an affordable, biocompatible, and adoptable ECG sensor.46The biopolymer-assisted rGO developed on shellac-assisted paper samples was used to develop the dry ECG electrodes by 1 v/v%, PEDOT: PSS/Dimethyl sulfoxide (DMSO) modifications, as shown in (Fig. S11, ESI† (inset)), and the Ag/AgCl conventional standard wet electrodes were used for comparison. Moreover, it has been shown that applying conductive gel to record signals through ordinary electrodes can lead to skin irritation and a gradual decrease in signal quality.47 To amplify the obtained signals, the Bioamp exg pill tool was connected to Arduino Uno (ATMEGA328P, processing microcontroller), and MATLAB programs (wavelet denoising and symlet 4 denoising) were leveraged to obtain high noise-to-ratio informative peaks, as shown in Fig. 9.
Fig. 9(a) and (b) show the unfiltered ECG signals derived from the developed dry electrode created on paper and the standard Ag/AgCl electrodes, in which the interpretation of data was difficult. Nevertheless, the filtered data show the characteristic P, R, and T peaks, indicating the electrical impulse response from the heart, as shown in Fig. 9(c) and (d). Moreover, the depolarization of the heart can be observed through the QRS complex peaks, as shown in Fig. 9(c) and (d).
Further, the impedance analysis establishes a comparative analysis between the standard and the developed system, as shown in (Fig. S11, ESI†). The frequency range was systematically adjusted from 0.1 Hz to 1000 Hz to measure the skin impedance. The measurements at a frequency of 10 Hz indicated a significantly higher impedance value of 87.85 kΩ, in contrast to the impedance of the standard electrode, which measured 49.12 kΩ. The disparities in electrode characteristics, namely between dry and wet gel electrodes, were the primary factors contributing to the notable variation in impedance. However, the as-developed rGO electrodes (S/N: 21.5 dB) significantly improved the signal-to-noise ratio by 24% compared to the standard electrodes (S/N: 17.32 dB).
4.4. Printed textile electronics
The limitations in the ease of wearability within the embedded garments were made possible with the rapid progress in printed flexible electronics. Unlike the conventional usage of printed circuit boards (PCBs), flexible electronics pave the way for multiple applications, including health care and sensing functionalities.48 Here, experiments were conducted to visualize the potential of the developed methodology in wearable printed electronics. Computer-aided designing (CAD) software was used to create the parallel and series circuit designs, as shown in Fig. 10. A simple study was conducted by printing the designed patterns on the Dewax shellac and Shellac cloth substrates. The obtained conductive rGO on the cloth was responsible for the transfer of electrons to turn on the electronics.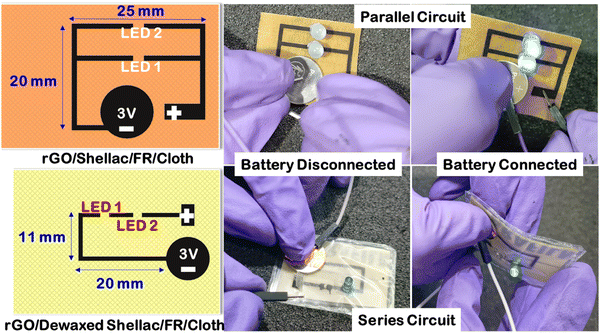 | ||
| Fig. 10 Printed electronic circuits on developed rGO patterns over dewaxed shellac and shellac cloth substrates. | ||
As shown in Fig. 10, when the battery was disconnected, the LEDs were off in both cases, while the LEDs were turned on by a battery connection. Further, this validates that the obtained patterns are highly conductive to transfer electrons and can be used in the near future for disposable, biocompatible wearable electronics.
5. Conclusions
The utilization of natural shellac (C25H51COOH) to enhance the quality of the laser-induced reduced graphene oxide (rGO) material represents a novel advancement. The optimization of solvent concentrations was performed on two varieties of natural shellac, namely Dewaxed shellac and the shellac, prior to their application on paper and cloth samples. The modification of laser parameters resulted in the production of high-quality biopolymer-assisted reduced graphene oxide (rGO) on paper and cloth substrates. The resulting paper exhibited a minimum electrical sheet resistance of 9.9 Ω Sq.−1 for Dewaxed shellac and 7.0 Ω Sq.−1 for shellac paper. Similarly, using biopolymer-assisted reduced graphene oxide (rGO) on cloth resulted in a notably low electrical sheet resistance. Specifically, the Dewaxed shellac variant exhibited a minimum resistance of 2.3 Ω Sq.−1, while the shellac cloth variant demonstrated a somewhat lower resistance of 3.4 Ω Sq.−1 In addition, a comprehensive analysis was conducted to completely characterize the reduced graphene oxide (rGO) material derived from biopolymer-assisted paper and cloth samples. This analysis encompassed optical, structural, and morphological findings.Moreover, the efficacy of the generated reduced graphene oxide (rGO) was verified in four notable applications. This study involved the creation of a disposable enzymatic biofuel cell (EBFC) that can generate a power density of 66.7 μW cm−2 at a current density (CD) of 634 μA cm−2 while maintaining a consistent open circuit voltage of 394 mV. Furthermore, the interdigitated electrode (IDE) system, created to study supercapacitors (SCs) using rGO/Dewaxed shellac/FR/Paper and rGO/Shellac/FR/Paper, exhibited aerial capacitance values of 16.87 mF cm−2 and 31.25 mF cm−2, respectively, when subjected to a current density (CD) of 0.5 mA cm−2. Electrocardiogram (ECG) data were obtained using a dry rGO/Shellac/FR/Paper electrode system, which exhibited a superior signal-to-noise ratio (S/N) improvement of 24% compared to the conventional Ag/AgCl electrodes. Finally, the cloth-based printed electronics showcase the possibility of future endeavors in developing printed textiles for smart lifestyles. The proposed methodology for utilizing natural shellac to enhance the performance of reduced graphene oxide (rGO) has enormous potential for a wide range of flexible wearables, and edible electronic applications in the future.
Conflicts of interest
There are no conflicts to declare.Acknowledgements
Authors would like to express acknowledgment to the BITS Pilani Hyderabad Campus, Central Analytical Laboratory (CAL) for supporting characterization techniques. Authors are privileged to have continuous support from the Tata Steel investigator, Dr Shyam Kumar Chowdary. Authors would also like to acknowledge the funding received from Tata Steel Jamshedpur.References
- X. Wang and G. Shi, Energy Environ. Sci., 2015, 8, 790–823 RSC.
- N. H. Barbhuiya, A. Kumar and S. P. Singh, Trans. Indian Natl. Acad. Eng., 2021, 6, 159–171 CrossRef.
- K. S. Novoselov, A. K. Geim, S. V. Morozov, D. Jiang, Y. Zhang, S. V. Dubonos, I. V. Grigorieva and A. A. Firsov, Science, 2004, 306, 666–669 CrossRef CAS PubMed.
- P. R. Wallace, Phys. Rev., 1947, 71, 622–634 CrossRef CAS.
- L. Najafi, R. Oropesa-Nuñez, B. Martín-García, F. Drago, M. Prato, V. Pellegrini, F. Bonaccorso and S. Bellani, Mater. Adv., 2020, 1, 387–402 RSC.
- S. Akca, P. Arpaçay, N. McEvoy, O. Prymak, W. J. Blau and M. Ulbricht, Mater. Adv., 2021, 2, 6439–6454 RSC.
- R. Tarcan, O. Todor-Boer, I. Petrovai, C. Leordean, S. Astilean and I. Botiz, J. Mater. Chem. C, 2020, 8, 1198–1224 RSC.
- R. Banerjee, A. H. Chowdhury, P. S. Kumar, C. Wang, S. Goel and P. M. Raj, 2023 Fourth International Symposium on 3D Power Electronics Integration and Manufacturing (3D-PEIM), 2023, pp. 1–5 Search PubMed.
- P. Kumar Raghav and S. Mohanty, Med. Hypotheses, 2020, 144, 110031 CrossRef CAS PubMed.
- V. Divya, S. K. Pavar, C. Shilpa Chakra, T. Rakesh Kumar, K. Shireesha and S. Madhuri, Applications of Carbon-Based Nanomaterials in Health and Environment: Biosensors, Medicine and Water Treatment, in Carbon Nanomaterial Electronics: Devices and Applications, ed. A. Hazra and R. Goswami, Advances in Sustainability Science and Technology, Springer, Singapore, 2021, pp. 261–284 Search PubMed.
- M. D. Wagh, H. R. Saikumar, P. S. Kumar, K. Amreen, S. K. Sahoo and S. Goel, IEEE Sens. J., 2022, 22, 14620–14627 CAS.
- K. S. Obayomi, S. Y. Lau, I. E. Mayowa, M. K. Danquah, J. Zhang, T. Chiong, L. Meunier and M. M. Rahman, J. Water Process Eng., 2023, 51, 103440 CrossRef.
- P. S. Kumar, S. Madapusi and S. Goel, Int. J. Biol. Macromol., 2023, 245, 125502 CrossRef CAS PubMed.
- A. Gutiérrez-Cruz, A. R. Ruiz-Hernández, J. F. Vega-Clemente, D. G. Luna-Gazcón and J. Campos-Delgado, J. Mater. Sci., 2022, 57, 14543–14578 CrossRef.
- A. Razaq, F. Bibi, X. Zheng, R. Papadakis, S. H. Jafri and H. Li, Materials, 2022, 15, 1012 CrossRef CAS PubMed.
- N. Jahan, H. Roy, A. H. Reaz, S. Arshi, E. Rahman, S. H. Firoz and M. S. Islam, Case Stud. Chem. Environ. Eng., 2022, 6, 100239 CrossRef CAS.
- C. Kavitha, Mater. Today Proc., 2022, 49, 811–816 CrossRef CAS.
- G. S. Lekshmi, R. Tamilselvi, R. Geethalakshmi, S. D. Kirupha, O. Bazaka, I. Levchenko, K. Bazaka and M. Mandhakini, J. Colloid Interface Sci., 2022, 608, 294–305 CrossRef CAS PubMed.
- P. S. Kumar and S. Goel, Diamond Relat. Mater., 2021, 120, 108680 CrossRef CAS.
- R. K. Singh, P. S. Kumar, K. Amreen, S. K. Dubey and S. Goel, IEEE Trans Nanobioscience, 2022, 1 Search PubMed.
- P. Rewatkar, D. Nath, P. S. Kumar, M. E. Suss and S. Goel, J. Power Sources, 2022, 521, 230938 CrossRef CAS.
- P. S. Kumar, S. Bhand, A. K. Das and S. Goel, Talanta, 2022, 236, 122858 CrossRef CAS PubMed.
- G. Yan, Z. Cao, D. Devine, M. Penning and N. M. Gately, Polymers, 2021, 13, 3723 CrossRef CAS PubMed.
- N. Thombare, S. Kumar, U. Kumari, P. Sakare, R. K. Yogi, N. Prasad and K. K. Sharma, Int. J. Biol. Macromol., 2022, 215, 203–223 CrossRef CAS PubMed.
- R. S. Singh, M. Jansen, D. Ganguly, G. U. Kulkarni, S. Ramaprabhu, S. K. Choudhary and C. Pramanik, Renew. Energy, 2022, 181, 1008–1022 CrossRef CAS.
- I. Miccoli, F. Edler, H. Pfnür and C. Tegenkamp, J. Phys.: Condens. Matter, 2015, 27, 223201 CrossRef CAS PubMed.
- S. K. Pavar, D. Velpula, M. Sakarya, S. C. Chidurala and A. Chinthakuntla, Mater. Today Proc., 2021, 47, 1787–1791 CrossRef CAS.
- S. Kaushal, V. Kumari and P. P. Singh, Environ. Sci. Pollut. Res., 2023, 30, 65602–65617 CrossRef CAS PubMed.
- J. Ahmed, T. Ahamad and S. M. Alshehri, New J. Chem., 2023, 47, 13903–13910 RSC.
- P. Rathnavel, C. Murukesh and R. Umamaheswari, J. Mater. Sci.: Mater. Electron., 2023, 34, 1000 CrossRef CAS.
- P. Das, A. B. Deoghare and S. R. Maity, Arab. J. Sci. Eng., 2021, 46, 5467–5475 CrossRef CAS.
- A. Kaushal, S. K. Dhawan and V. Singh, AIP Conf. Proc., 2019, 2115, 30106 CrossRef CAS.
- S. Y. T. Trolles-Cavalcante, A. Dutta, Z. Sofer and A. Borenstein, Nanoscale Adv., 2021, 3, 5292–5300 RSC.
- S. H. Huh, Carbon N. Y., 2014, 78, 617–621 CrossRef CAS.
- B. Naresh, K. G. Krishna, D. Rajasekhar, C. Kuchi, S. K. Kummara and P. S. Reddy, Surf. Interfaces, 2023, 40, 103012 CrossRef CAS.
- A. E. D. Mahmoud, M. Hosny, N. El-Maghrabi and M. Fawzy, Sustainable Environ. Res., 2022, 32, 22 CrossRef CAS.
- A. E. D. Mahmoud, N. El-Maghrabi, M. Hosny and M. Fawzy, Environ. Sci. Pollut. Res., 2022, 29, 89772–89787 CrossRef CAS PubMed.
- J. Gaidukevic, R. Aukstakojyte, J. Barkauskas, G. Niaura, T. Murauskas and R. Pauliukaite, Appl. Surf. Sci., 2022, 592, 153257 CrossRef CAS.
- S. Mahari and S. Gandhi, Bioelectrochemistry, 2022, 144, 108036 CrossRef CAS PubMed.
- F. Bu, W. Zhou, Y. Xu, Y. Du, C. Guan and W. Huang, npj Flex. Electron., 2020, 4, 31 CrossRef.
- M. Prauzek, J. Konecny, M. Borova, K. Janosova, J. Hlavica and P. Musilek, Sensors, 2018, 18, 2446 CrossRef PubMed.
- M. R. R. Abdul-Aziz, A. Hassan, A. A. R. Abdel-Aty, M. R. Saber, R. Ghannam, B. Anis, H. Heidari and A. S. G. Khalil, IEEE Access, 2020, 8, 200573–200580 Search PubMed.
- H. Awasthi, H. Renuka, A. K. Srivastava and S. Goel, Energy Storage, 2023, 5, e405 CrossRef CAS.
- J. Affi, M. Handayani, M. Anggoro, A. Esmawan, H. Sabarman, A. Satriawan, W. Shalannanda, R. Siburian and I. Anshori, J. Mater. Sci.: Mater. Electron., 2023, 34, 1638 CrossRef CAS.
- G. Petmezas, L. Stefanopoulos, V. Kilintzis, A. Tzavelis, J. A. Rogers, A. K. Katsaggelos and N. Maglaveras, JMIR Med Inf., 2022, 10, e38454 CrossRef PubMed.
- R. Xing, R. Huang, R. Su and W. Qi, New J. Chem., 2023, 47, 11063–11070 RSC.
- X. Xiao, G. Wu, H. Zhou, K. Qian and J. Hu, Polymers, 2017, 9, 259 CrossRef PubMed.
- A. E. Ali, V. Jeoti and G. M. Stojanović, Sci. Technol. Adv. Mater., 2021, 22, 772–793 CrossRef PubMed.
Footnote |
| † Electronic supplementary information (ESI) available. See DOI: https://doi.org/10.1039/d4ma00151f |
| This journal is © The Royal Society of Chemistry 2024 |

