 Open Access Article
Creative Commons Attribution 3.0 Unported Licence
Extracting recalcitrant redox data on fluorophores to pair with optical data for predicting small-molecule, ionic isolation lattices†
Michaela K.
Loveless‡
 a,
Minwei
Che‡
a,
Alec J.
Sanchez
a,
Vikrant
Tripathy
a,
Bo W.
Laursen
a,
Minwei
Che‡
a,
Alec J.
Sanchez
a,
Vikrant
Tripathy
a,
Bo W.
Laursen
 b,
Sudhakar
Pamidighantam
 acd,
Krishnan
Raghavachari
 a and
Amar H.
Flood
 *a
*a
aDepartment of Chemistry, Indiana University, 800 E Kirkwood Avenue, Bloomington, IN 47405, USA. E-mail: aflood@iu.edu
bNano-Science Center, Department of Chemistry, University of Copenhagen, Universitetsparken 5, 2100 Copenhagen, Denmark
cCenter for AI in Science and Engineering (ARTISAN), Georgia Institute of Technology, 1283B CODA Building, 756 W Peachtree St NW, Atlanta, GA 30308, USA
dInstitute for Data Engineering and Science (IDEaS), Georgia Institute of Technology, 1283B CODA Building, 756 W Peachtree St NW, Atlanta, GA 30308, USA
First published on 3rd September 2024
Abstract
Redox and optical data of organic fluorophores are essential for using design rules and property screening to identify new candidate dyes capable of forming optical materials. One such optical material is small-molecule, ionic isolation lattices (SMILES), which have properties defined by the optical and electrochemical properties of the fluorophores used. While optical data are available and readily extracted, the promise of digital discovery to mine the data and identify new dye candidates for making new fluorescent compounds is limited by experimental electrochemical data, which is reported with varying quality. We report methods to extract data from 20![[thin space (1/6-em)]](https://www.rsc.org/images/entities/char_2009.gif) 000+ literature-reported dyes for generating a library of both redox and optical data constituted by 206 dye-solvent entries. Wide heterogeneity in data collection and reporting practices predicated use of a workflow involving manual data extraction, expert annotations of data quality and validation. Chemometric analysis shows distributions of solvents, electrolytes, and reference electrodes used in electrochemistry and the distributions of dye families and molecular weights. Data were extracted and screened to identify fluorophores predicted to form fluorescent solids based on SMILES. Screening used three design rules requiring dyes to be cationic, have a redox window within −1.9 and +1.5 V (vs. ferrocene), and a size less than 2 nm. A set of 47 dyes are compliant with all design rules showcasing the potential for using paired electrochemical-optical data in a workflow for designing optical materials.
000+ literature-reported dyes for generating a library of both redox and optical data constituted by 206 dye-solvent entries. Wide heterogeneity in data collection and reporting practices predicated use of a workflow involving manual data extraction, expert annotations of data quality and validation. Chemometric analysis shows distributions of solvents, electrolytes, and reference electrodes used in electrochemistry and the distributions of dye families and molecular weights. Data were extracted and screened to identify fluorophores predicted to form fluorescent solids based on SMILES. Screening used three design rules requiring dyes to be cationic, have a redox window within −1.9 and +1.5 V (vs. ferrocene), and a size less than 2 nm. A set of 47 dyes are compliant with all design rules showcasing the potential for using paired electrochemical-optical data in a workflow for designing optical materials.
1 Introduction
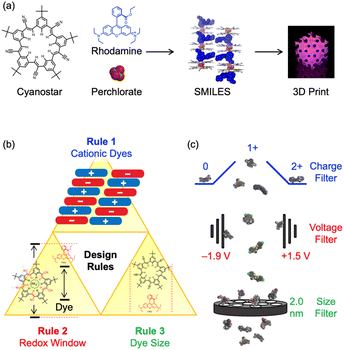
Optically active materials composed of molecular building blocks1–4 have garnered attention for their potential applications in lasers,5 solar energy harvesting,6 and fluorescent sensors.7,8 The delivery of target properties to the materials, e.g., light absorption and emission, energy and electron transfer, can benefit from well-defined design rules, working models, and structure–property relationships.9 This knowledge of the design criteria provides a basis for selection of molecular fluorophores to create new materials. For this reason, use of large datasets,10–15 cheminformatics,11,12 and machine learning13,14 approaches involving dyes and their key properties11,16–18 can enhance the development of optical materials.Small-molecule, ionic isolation lattices (SMILES) are a class of new optical materials (Fig. 1a), with well-defined design rules (Fig. 1b).19 These rules can be used to select the set of dyes that impart specific properties (e.g., color,20 degree of absorption,21 emission lifetimes,22,23 brightness2) onto a solid-state material. Rule 1 requires the dyes to be cationic. This charged state is responsible for directing alternating charge-by-charge packing when mixed with the anion-binding cyanostar.2 Rule 2 involves the nesting of the highest occupied molecular orbital (HOMO) and lowest unoccupied molecular orbital (LUMO) of the dye inside the frontier molecular orbitals of the cyanostar–anion complex. These orbital energies are approximated by the oxidation and reduction potentials and must therefore sit between +1.5 and −1.9 V vs. Fc/Fc+. This alignment ensures that there are no electron transfer processes or charge-transfer states20 generated after photoexcitation. A corollary of this rule is that the optical gap of the dye must be less than the cyanostar–anion complex. Rule 3 requires the dye to be smaller than the ∼2 nm diameter of the cyanostar–anion complex to allow spatial isolation and exciton decoupling of the dyes.22,24
A dataset containing cationic dyes that include charge states, redox data, optical data, and size would be valuable for screening dyes for use in creating SMILES materials (Fig. 1c). The dye's charge and size can be assigned in a straightforward way, with pen and paper, if necessary, but the redox and optical data need to be determined experimentally or using calibrated computational methods. The literature holds a wealth of experimental data from decades of research across many fields.25–30 Often, however, the literature is too extensive to extract the data by hand. Therefore, an automated process for data extraction using natural language processing (NLP) is preferred.31–33 Previous work has successfully extracted optical data on dyes from the literature,17,18 and recent advancements have extended this to include electrochemical data from tables. These tools, like ChemDataExtractor17,18 and ChemDataExtractor 2.0,17,18 help address the challenges of parsing and structuring data directly from primary sources, especially when dealing with large datasets and complex formats. There have been several reports where ChemDataExtractor34–38 and similar software39–41 have been used to inform the selection of dyes for targeting specific materials properties, such as, use in dye-sensitized solar cells.42
The extraction of optical data is easily automated using NLP methods.17,18,36 Electrochemical data are rarely extracted despite the importance of the optical and redox properties for topical areas of research, such as, photoredox catalysis.28,29,43–45 Even if the cyclic voltammograms (CVs) are provided, figures are currently inaccessible to current NLP methods. Electrochemical data are only accessible to these existing NLP methods if it is reported in tables or in the text with its full experimental context. Collections of these data in the related literature have been presented but mostly as tables in publications.46–50 Another topical area is redox flow batteries. We found an example that outlined data infrastructure, D3TaLES, providing for redox potentials to be sourced from experiment and computations.51 Most databases of their redox potentials appear to be comprised of computed values.25,52 The rarity of databases of experimental electrochemical properties likely stems from several challenges in the variety of the reporting practices.53 Unlike optical data, which is recorded on instruments that are internally calibrated and require little user modification or interpretation to obtain wavelengths of light absorption and emission, electrochemical data requires user-defined calibration of the reference electrode and an assessment of reversibility (vide infra). This calibration occurs both during experimentation and when reporting the data. These metadata, e.g., reference electrode, are often reported separately from the electrochemical data and are not always complete. This reporting style causes difficulty for automated extraction software to put the data in its context, leading to incomplete or incorrect data extraction. Recently, a model involving a convolutional neural network (CNN) and the large language model (LLM) GPT-3.5 (ref. 54) has been developed to extract tabular oxidation potentials, showing promise in overcoming some of these challenges by improving the accuracy and completeness of the data extraction process. However, like NLP models, it cannot extract data from figures (such as CV curves) and therefore cannot assess the reversibility of the reported potentials. A recent report of carbon dioxide electrocatalytic reduction processes55 overcame this issue by extracting their data on electrocatalytic reduction from the literature by using expert annotations in a semi-manual process. This process required that people examine the primary literature, assess and extract quality-controlled data. This method resulted in a dataset that could be applied to the discovery of new and effective catalysts.
The need for expert annotations also stems from the reversibility of electrochemical processes measured using CV. The CV provides data on oxidation and reduction processes that can be classified as either reversible or irreversible. While there are well-described methods56 to make this classification, these are not always undertaken. There are also a variety of ways in which these classifications are reported in the primary literature. This limitation requires expert annotations of the data. A recent editorial authored by multiple journal editors lays out the case for systematic reporting of electrochemical data.53
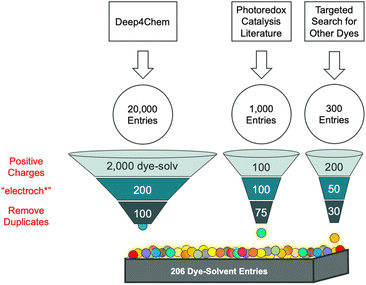
Herein, a dataset is generated that contains paired redox and optical data on cationic dyes from the literature with the goal of using the data to inform the selection of candidate dyes for making fluorescent SMILES materials. A three-step approach was ultimately adopted consisting of extraction, validation, and analysis (Fig. 2). This process resulted in a collection of optical and electrochemical data and size. The dataset included 206 entries, spanning 13 dye families. The workflow we followed led to a sequential buildup of data that is not intended to be representative of the literature but instead to examine the literature as a potential source of electrochemical data. Significant heterogeneity in the reporting of electrochemical data required expert evaluations, annotations of high/medium/low data quality, and hand extraction of the data that constituted a substantial bottleneck. Cheminformatic analysis of this dataset was performed to identify trends and patterns in the data and to provide an understanding of the scope of chemical diversity from among the literature we surveyed. The immediate goal, described herein, is use of validated electrochemical data and screening (Fig. 1c) to identify 47 dyes that have the potential to form fluorescent SMILES materials. In the future, the dataset of 206 dyes can serve as a validated collection against which theoretical methods can be calibrated for the calculation of redox properties.
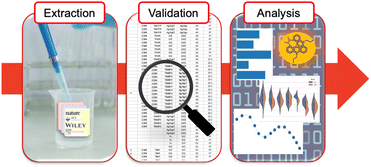 | ||
| Fig. 2 A graphical representation of the three-step workflow involving extraction, validation, and analysis that was developed during our study. | ||
2 Methods
Data collection
The data selection criteria were guided by the established design rules for SMILES materials and the need for paired optical and redox data. We prioritized entries that met the +1 charge requirement and which contained both optical and electrochemical data. This systematic filtering ensured that the dataset was tailored to the study's objectives, despite the inherent limitations in the availability of such paired data in the literature. The data used in the study was obtained from the scientific literature (Fig. 3) using various means. A search of the literature using Web of Science and a topic of “molecular dyes” shows over 36![[thin space (1/6-em)]](https://www.rsc.org/images/entities/char_2009.gif) 000 publications. The dataset generated in this work represents a subset of these papers although not representative of all the data in the literature. We found too few examples where optical and redox data were paired, such that we had to alter our data extraction process in an ad hoc manner. Thus, the final dataset is not necessarily representative of the literature, but it provides a starting point for evaluating our workflow and identifying the bottlenecks in collecting paired redox and optical data.
000 publications. The dataset generated in this work represents a subset of these papers although not representative of all the data in the literature. We found too few examples where optical and redox data were paired, such that we had to alter our data extraction process in an ad hoc manner. Thus, the final dataset is not necessarily representative of the literature, but it provides a starting point for evaluating our workflow and identifying the bottlenecks in collecting paired redox and optical data.
Our exploration of the data available began with a dataset of optical properties generated by Deep4Chem using CDE.34 This dataset has 20![[thin space (1/6-em)]](https://www.rsc.org/images/entities/char_2009.gif) 000 entries constituted by unique dye-solvent pairs from ∼800 papers in the primary literature. These entries were down selected using an automated process that parses the SMILES string of the fluorophore to retain only those with a net charge of +1. This selection process conforms to the first design rule for making SMILES materials. This sorting resulted in approximately 1700 dye-solvent entries from fewer than 100 papers and represents a ∼10% yield. These entries were further down selected by expert assessment of the ∼100 papers to identify those that contained electrochemical data. This reduced the dataset by another order of magnitude to ∼100 dye-solvent entries. Our anecdotal observation is that 10% of publications on dyes report their electrochemical data. After applying these two rules, we obtained a ∼0.5% yield from the original dataset.
000 entries constituted by unique dye-solvent pairs from ∼800 papers in the primary literature. These entries were down selected using an automated process that parses the SMILES string of the fluorophore to retain only those with a net charge of +1. This selection process conforms to the first design rule for making SMILES materials. This sorting resulted in approximately 1700 dye-solvent entries from fewer than 100 papers and represents a ∼10% yield. These entries were further down selected by expert assessment of the ∼100 papers to identify those that contained electrochemical data. This reduced the dataset by another order of magnitude to ∼100 dye-solvent entries. Our anecdotal observation is that 10% of publications on dyes report their electrochemical data. After applying these two rules, we obtained a ∼0.5% yield from the original dataset.
This intermediate dataset (∼100 entries) was evaluated and found to contain a restricted number of dye classes. To diversify the dataset, we undertook various approaches. One approach was to conduct manual searches on Web of Science and SciFindern, using “cyanine” and “rhodamine” as search keywords, aiming to identify established classes of cationic fluorophores.57,58 While this approach yielded valuable papers on cyanines, the search for rhodamines generated many papers focused on bioimaging, thereby limiting the effectiveness of this method with this class of dyes. Furthermore, only a limited number of the identified papers contained electrochemical data, prompting us to explore a different approach. We directed our attention towards triangulenium dyes due to the routine collection of both optical and electrochemical data by one of us (BWL).45,59–63 Additionally, we targeted papers within the emerging field of photoredox catalysis,28,29,43–45 where both optical and redox data are essential for examining the reactivity of the photocatalysts. The expected wealth of electrochemical data within these paper collections was confirmed, significantly enriching our dataset. Following the removal of duplicate entries, the final dataset provided a collection of 206 entries from nearly 30 papers.
The output of this optical data extraction was a dataset that included 25 entity labels: tag, SMILES string, DOI, molecular weight, name of data entry person, name of compound, frequency of occurrences of the keyword “electroch” in the main text, reduction potential, reduction half-wave (h) or peak (p), reduction solvent, reduction electrolyte, oxidation potential, oxidation half-wave (h) or peak (p), oxidation solvent, oxidation electrolyte, reference electrode quoted against, reference electrode measured against, electrochemical method, temperature, data location in paper, expert validation of electrochemistry, reduction potential quality, oxidation potential quality, size and notes.
The CDE was used to extract optical data from a subset of the papers and effectively extracted optical data for 118 entries with an F-score of 86.8%,5 where 100% is perfect precision and recall of data from the papers. We have taken steps to adapting CDE for electrochemical data, which have, so far, been unsuccessful. Optical data has numerous advantages for extraction over electrochemical data. Raw results do not require calibration (absorption peak position reported in nanometers are obtained directly from the measurement) nor does the data acquired require an assignment of the underlying process (absorption spectra are measured using a UV-Vis spectrometer while emission spectra are measured on a different instrument). Electrochemical data require the voltages to be calibrated to a reference electrode, and the reversibility of the electron transfer processes need to be assigned. As a result, our findings suggest that electrochemical data do not reach the same precision or recall as optical data extraction. For instance, identification of the reference electrode and accurately identifying if the redox process is reversible or not. Thus, even a modified NLP extraction process fails to reach the levels of precision and recall required to produce a useable dataset.
The electrochemical data and metadata for the 206 entries in the dataset were manually extracted from the papers. Expert annotations (vide infra) were used to classify the data as high, medium, or low quality.
To ensure the accuracy of the data extraction, a validation process was enacted in which data extracted by one member of the team was reviewed and verified by another. Validation identified errors in less than five percent of the manually extracted data. The output of this electrochemical data collection campaign was a dataset that included ten entity labels for redox data: potential, half wave or peak position, solvent, electrolyte, quality (×5) for both oxidation and reduction (×2).
A procedure to estimate the size of the dyes was implemented using the mol-ellipsize64 Python package. This package fits an ellipsoid to each conformer and calculates its diameter. The size of each dye is obtained by the mean ellipsoid diameter of five conformers generated using the RDKit package.65
When each of the unique 206 dye-solvent pairs are combined with the 12 optical and 10 entity labels, a maximum of 4796 data points are included in the final dataset.
Quality validation
Expert annotations were used to assess the quality of the electrochemical data. The entries were categorized based on the assessment of the electrochemical experiments (Fig. 4). This quality assessment sorts the CV data and associated metadata into high, medium, and low quality. These assessments are made based on the reversibility of the CV curve and the availability of metadata that places the curve in its experimental context. Ensuring data quality is crucial, as it directly impacts the confidence in subsequent analyses and the potential for these data to be used in calibrating computational models. High quality (HQ) data were identified based on two criteria: (1) the reference electrode associated with the data is clearly reported, and (2) the voltammograms conform to a reversible electrochemical process. The latter was assessed using various accepted methods,56i.e., the CVs display a well-defined and reversible pair of redox waves, colloquially referred to as “clean ducks”. This criterion also benefits future use of these data for calibrating the redox potentials calculated using quantum chemistry methods. For HQ data, half-wave potentials (Fig. 4a) were reported in the dataset.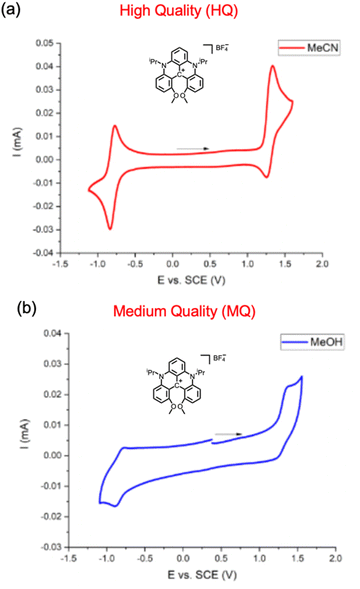 | ||
| Fig. 4 Literature examples of (a) high quality (HQ) electrochemical data and (b) medium quality (MQ) electrochemical data. HQ data has a clear reference electrode and reversible CV “ducks,” while the ducks in MQ data are distorted in some manner. Reprinted with permission from ref. 43. Copyright 2024 American Chemical Society. | ||
Data of medium quality (MQ) possess a well-defined reference electrode and a CV indicative of irreversible electron transfer (Fig. 4b). For CVs that display irreversible redox processes (e.g., imperfect “ducks”), peak positions were reported. These peaks do not accurately reflect the reversible half-wave potentials.66,67 MQ data will still be analyzed but are understood to provide less accurate estimates of the formal reduction and oxidation potentials.
In instances where there was no clear description of the reference electrode, voltammograms were not available, or curve shapes were imperfect, the electrochemical data were defined as low quality (LQ). Additionally, there were instances where the reduction potential of one compound was classified as HQ while the oxidation potential was classified as MQ.
Out of a total of 302 electrochemical potentials 107, 76 and 131 were classified as HQ, MQ and LQ, respectively. Within the subset of 116 oxidation and 186 reduction potentials, 31 and 76 were classified as HQ, 36 and 40 as MQ, and 56 and 75 as LQ (Fig. 5).
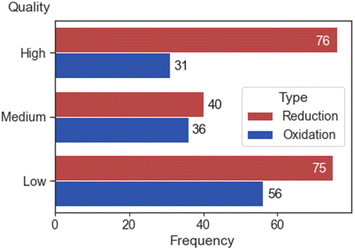 | ||
| Fig. 5 A bar plot that displays the frequency of high, medium, and low-quality electrochemical data (nreduction = 191, noxidation = 123). | ||
Post processing
The manually extracted data undergoes a cleansing process to improve accuracy. The SMILES strings of all entries were converted into canonical SMILES strings using the cheminformatics toolkit RDKit. These canonical SMILES strings, along with the reference column containing DOIs, are examined for any instances of duplication. The duplicated entries serve as a convenient sample corpus for accuracy validation. In total, 28 duplicates were identified in this process. Any discrepancies found during this review of the duplicates are corrected using original papers. After addressing identified discrepancies, redundant records are removed from the dataset. Violin plots of the electrochemical properties are generated. Five outliers were identified by having unphysical values. These data were corrected.3 Results
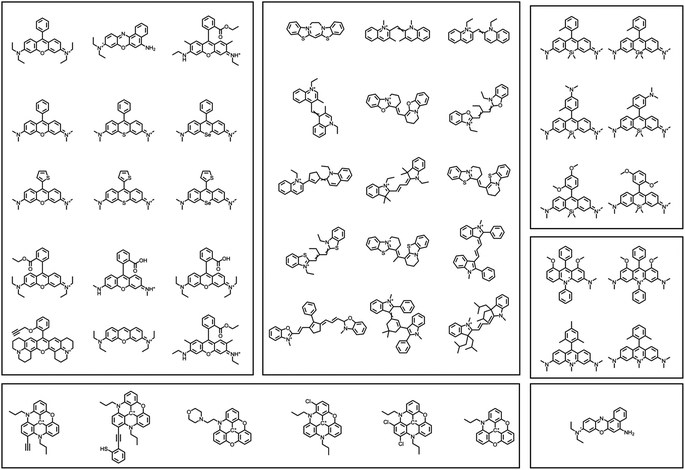
An analysis of data on dye class, molecular weights, sizes, aromaticity, optical properties, and electrochemical properties is undertaken as a basis to inform SMILES design rules. An analysis of distributions of the dye families (Fig. 6) reveals that this dataset consists of 13 categories of cationic dyes, with acridinium and cyanine dyes dominating the collection (Fig. 7a). The prevalence of any one family does not guarantee availability of both reduction and oxidation potentials. We identify instances where both reduction and oxidation potentials are present for a specific dye-solvent system, which we term a “redox pair” (Fig. 7b). In this case, while acridinium dyes are present in large number, only a few are redox pairs. In this dataset, there are a total of 75 dyes that have redox pairs among the 206 entries.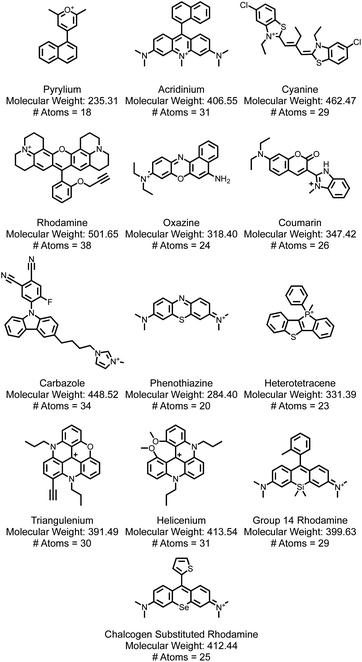 | ||
| Fig. 6 A selection of a representative dye from each of the 13 dye families explored in this report. With the dyes is the molecular weight and the number of heavy (i.e., non-hydrogen) atoms. | ||
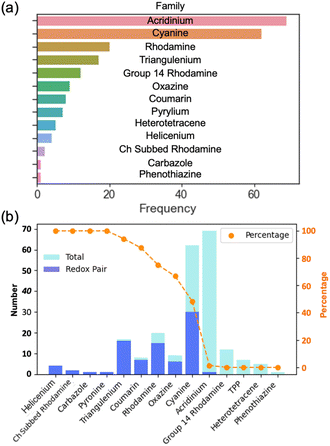 | ||
| Fig. 7 Bar charts showing the (a) dye family distribution and (b) the distribution of redox pairs in each dye family, presented in both numerical and percentage terms. | ||
Most of the dyes (79.4%) studied have a molecular weight between 300 and 500 g mol−1 (Fig. 8). Only a few had a mass of over 600 g mol−1 including highly functionalized cyanine dyes. The optical gap and electronic properties have been demonstrated to correlate well with the number of rings for conjugated dye systems, such as, polycyclic aromatic hydrocarbons.68–71 An analysis of the number of rings (Fig. 9) shows that 4, 5, or 6, were most common with rhodamine and triangulenium families being in this range. These analyses show that the data collected and reported in this work represent a broad chemical diversity within the 13 dye families. These data are also known to be correlated to optical and electrochemical properties of organic fluorophores,72 making them valuable to the practical use of this data in future work. In addition, the correlation between optical and electrochemical data provides an empirical basis for using the optical data to predict some missing electrochemical data.”
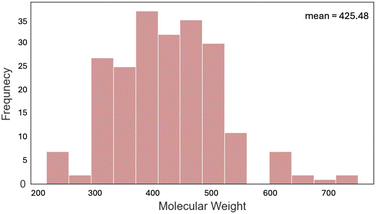 | ||
| Fig. 8 Histogram representing the distribution of molecular weights for all the dyes in the dataset. | ||
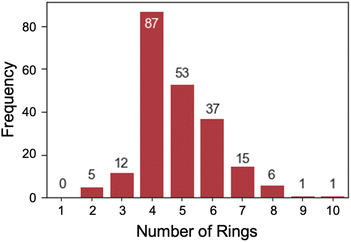 | ||
| Fig. 9 Bar chart which represents distribution in the number of rings in an entry determined by RDKit's smallest set of smallest rings (SSSR). | ||
To better understand the methods of data collection used in the literature, an analysis of metadata was performed. Only electrochemical data of high and medium quality was analyzed. Thus, we only include redox potentials that have clearly defined reference electrodes, and may either be electrochemically reversible (high quality, HQ) or irreversible (medium quality, MQ). Data that was poorly referenced or for which the CV data had non-ideal behavior (low quality, LQ) was excluded. See Methods section for more details on classification of quality.
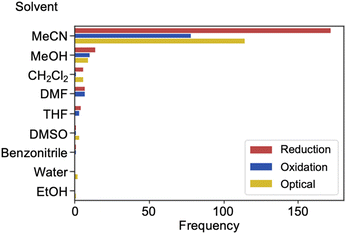
The metadata of a reduced HQ and MQ dataset of 116 reductions and 67 oxidations from 175 and 123 total entries, respectively, was analyzed. The solvent in which the sample is dissolved influences both optical and electrochemical results. The majority of the data was collected in acetonitrile (Fig. 10). This observation is true for all measurements we analyzed (reduction, oxidation, optical) and most likely originates from this solvent having a wide window of electrochemical stability, also offering reasonable polarity to dissolve salts like the cationic dyes being analyzed here. Other common solvents include methanol, dichloromethane, and dimethylformamide. A few other solvents are used sparingly with only one or two reported examples of their use in the literature sources we surveyed.
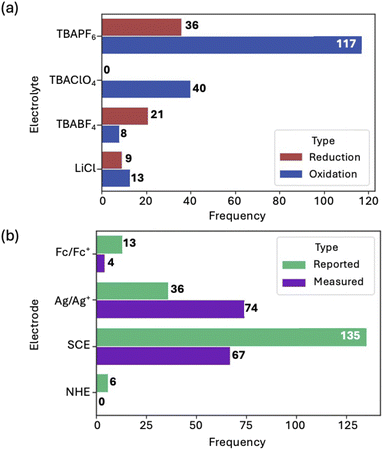
The electrolytes and reference electrodes used and reported in the data were analyzed. TBAPF6 and TBAClO4 are the most common electrolytes for measuring the reduction potential of molecular dyes (Fig. 11a). To measure the oxidation potential, TBABF4 is the most common. LiCl was also used but was the least common. During the analysis of the reference electrodes used in this dataset, it was observed that some authors opted to use one reference electrode during the electrochemical measurement, while reporting the potentials relative to a different reference electrode (Fig. 11b). It is also common73 to add ferrocene to the solution being analyzed as an internal standard, and then to adjust the reference electrode to another one when reporting the data in the literature. Comparison of data to ferrocene ensures the accuracy of the peak positions collected from the CV experiment. Thus, the data reported below is referenced to ferrocene.
One additional problem with electrochemical data is that only one of the reduction and oxidation potentials are reported when both are needed for SMILES compliance (vide infra). Fortunately, the more prevalent optical data can be used together with one of the redox potentials to estimate the location of the missing potential. For this purpose, we rely on the observation that the optical gap, Eop (eV), is often seen to correlate74–80 with the potential difference, ΔEredox (V) between the first oxidation, Eox, and reduction, Ered, processes (eqn (1)):
| Eop ≈ ΔEredox = Eox − Ered | (1) |
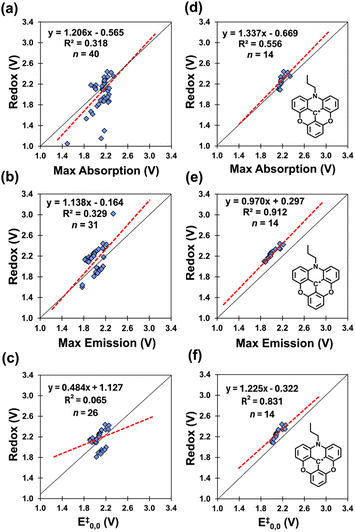
The redox gap can be approximated by utilizing optical experimental data (Fig. 12). This relationship also provides a means to extend the data, which can be used to estimate missing redox potentials (vide infra). Hence, our dual data extraction method addresses the challenge of incomplete data reporting and enhances our ability to screen for SMILES-compliant materials efficiently. These data include absorption and emission maxima, both of which can be reliably extracted from the literature. In order to examine these correlations, we need a collection of dyes for which we have the redox gap (Eox and Ered), as well as the optical gaps approximated by EAbs and EEm, and by the E0,0 (see next).
The E0,0 value is frequently used to estimate the adiabatic energy difference between ground and excited states of the dyes.81 The literature and thus our dataset does not explicitly include E0,0. As a consequence, we generate estimates, E‡0,0, from the numerical mean of the absorption and emission energies (eqn (2)):
 | (2) |
This relationship (eqn (2)) assumes that the reported absorption band corresponds to the S0–S1 transition.
Our data correlating redox window (ΔEredox) to absorption maxima (Fig. 12a) only include 40 data points that include both optical data and paired redox data. From the original dataset, 155 of the 206 dyes have absorption maxima and 75 of the 206 dyes have both Eox and Ered (Fig. 7b). The same limitation arises with the emission maxima and E‡0,0 for which we have 31 (Fig. 12b) and 26 (Fig. 12c) datapoints, respectively, limiting the total number of entries to analyze.
We see that the correlations are poor. However, we note that the data is dominated by two dye families, the trianguleniums and rhodamines totaling 23 out of the 40 examples. These two families account for the two regions in the plots (see Fig. 12c).
For this reason, we examined these correlations by plotting the data based on these two dye families (Fig. 12d and S1a,†n = 14 and 9, respectively), and observe higher correlations (R2 = 0.556 and 0.773). Similar trends can be found in the literature correlating the electrochemical and optical gap for polyquinolines and polyanthrazolines.82 This finding suggests that higher correlations can be obtained when investigating similar classes/families, aka, homologous series.
The poor correlation is also likely due to slight variations in data collection methods and techniques across different laboratories. The same improvements (0.657 ≤ R2 ≤ 0.784, see Fig. S2c–e†) can be seen when examining dyes from within a single paper (containing more than four dyes, n > 4), for 3 of the 4 paper specific plots. For one of the papers (Fig. S2b†), the R2 = 0.040, however this is due to opposing trends in the collected data. Nevertheless, these findings suggest that electrochemical and absorption data are dependent on the dye family and experimental conditions, which may not be consistent across papers.
We observe the same trends for correlations of the redox gap to the emission maxima (Fig. 12b, R2 = 0.329, n = 31) and E‡0,0 values (Fig. 12c, R2 = 0.065, n = 26). We observe the plots to be bimodal and that the dye-specific correlations separate these into distinct datasets showing clear improvements, 0.511 ≤ R2 ≤ 0.912 (Fig. 12e and S1b,†n = 14 and 8), as do paper specific correlations, 0.861 ≤ R2 ≤ 0.926 (Fig. S3b–d†) and 0.800 ≤ R2 ≤ 0.893 (Fig. S4b–d†). These relations between optical and redox gaps allow us to estimate values of missing redox potentials.
Extending the data
A proportion of the data (133 of 206) included just one of the two redox potentials. For example, acridiniums typically have only a reduction or oxidation potential reported due to their use in photoredox catalysis28,29,50,83 such that only one of these potentials is important. The dataset can be extended84,85 by various means to add these missing entries.In order to extend the data for use in data mining for SMILES compliance, we use the correlation between the optical data and the gap (eqn (1)) to estimate the missing data, either the oxidation or reduction potential. For this purpose, we either used the estimated E‡0,0 when both absorption and emission maxima are available or the absorption maximum, EAbs (eV) in its place, and following equations:
| E‡red = Eox (V) − E‡0,0 (eV) | (3) |
| E‡ox = Ered (V) − E‡0,0 (eV) | (4) |
4 Discussion
Analysis of electrochemical data
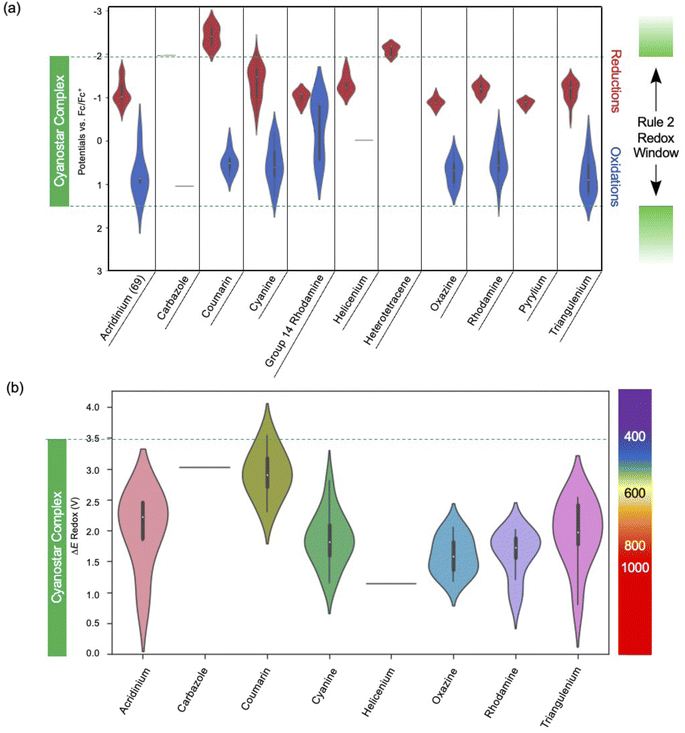
An analysis of the electrochemical data was performed to identify candidate dyes for forming SMILES materials. All the dyes in consideration are cationic and fulfill rule 1 (Fig. 1b). The next assessment was to fulfill rule 2 by identifying those dyes with both reduction and oxidation potentials sitting inside the redox window of the cyanostar complex.A visualization approach to assess compliance can be conducted using violin plots (Fig. 13a) where the oxidation and reduction potentials of all dyes in a family with blue and red violins respectively. These plots were constructed and compared to the redox potentials of the cyanostar–anion complex. They provide valuable information on the types of dyes that are expected to make emissive SMILES materials based on rules 1 and 2. For example, both the reduction and oxidation potentials for many triangulenium dyes are within the bounds defined by the redox window of the cyanostar–anion complex (green). Consequently, triangulenium dyes are good candidates for SMILES materials, which has been demonstrated in previous reports.2
Violin plots of the gap (eqn (1)) based on the redox window (Fig. 13b) show that most of the dyes in the dataset are predicted to have an optical transition of lower energy than cyanostar's. Thus, the width of these windows and alignment relative to the redox properties of the cyanostar complex could be tuned by functional group modulation. The data suggest that some coumarin dyes may be suitable for use in SMILES materials, however, the ΔEredox is quite wide, and it approaches the width of cyanostar's redox window (green). Thus, any fine-tuning of the redox window of a coumarin to fit within cyanostar's needs to account for these small tolerances closer to the edges of the window.
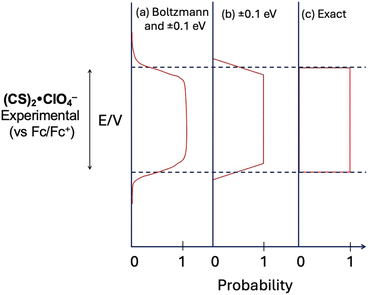
The edges of the window are subject to uncertainties. There exists experimental error (±0.1 V) arising from the uncertainties in the measurements. If computational chemistry is used to estimate redox properties in the future, chemical accuracy often offers a larger error (±0.25 eV). Furthermore, while the redox window is set by the electrochemical potentials, the possibility for “uphill” electron transfer can also occur if there are charge-transfer (CT) products in which coulombic interactions in the proximal D+A− pair provide thermodynamic stability.86
Screening of the data for SMILES compliance
The original and extended dataset set of data provide the redox potentials can be combined with estimates of dye sizes to identify the subset of dyes that are compliant with the SMILES design rules. We can consider the compliance with the second design rule using probability curves (Fig. 14). Each curve represents an approximation of this probability. The first (Fig. 14a) includes the possibility of Boltzmann weighted distributions of electron transfer products and experimental error in the measurements. The second (Fig. 14b) approximates this distribution with a simple linear form. The simplest (Fig. 14c) is a hard cut-off at the edge of the redox window and is the criterion we used during screening.Compliance with rule 3 was determined using an estimation of molecular size by mol-ellipsize (Fig. 15).64 These data can be compared to the size of cyanostar (2 nm diameter). This analysis was performed on each of the 170 unique dyes in the dataset, revealing 120 dyes that are smaller than cyanostar. These 120 dyes adhere to rule 3. This list can be compared to the list of redox-aligned dyes to produce a collection of dyes that adhere to all three design rules.
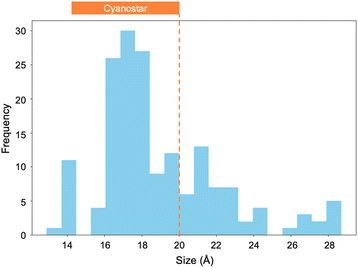 | ||
| Fig. 15 By fitting the molecular dyes to an ellipse, an approximation of their size can be made. This size approximation can also be performed on cyanostar (orange) (n = 170). | ||
Testing dyes for SMILES compliance
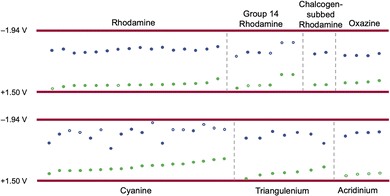
Cyanines make up a large percentage (28.4%) of the dataset and typically have both reduction and oxidation data reported. By plotting the redox window of cyanine dyes against the redox window of the cyanostar–anion complex, we see that 34 of the 48 cyanine dyes fit the electrochemical design rule (Fig. 16) as defined by the simplest hard cut off.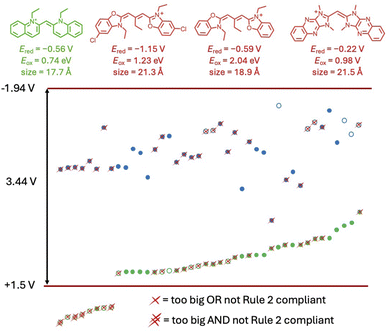 | ||
| Fig. 16 The reduction (blue) and oxidation (green) potentials of cyanine dyes plotted from lowest to highest oxidation potential. Any reduction potentials that were obtained by extending the data using eqn (3) or (4) are denoted as open circles. Dyes that do not follow rule 3 are marked with a single X. Dyes that do not follow rules 2 and 3 are marked with a double X. | ||
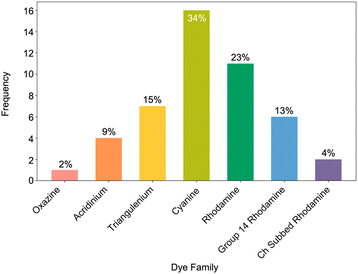
Across all the 206 dye-solvent pairs, we found a total of 57 pairs (Fig. 17) that were compliant with all design rules leading to 47 (Fig. 18) unique dyes. The distribution of SMILES-compliant dyes (Fig. 19) shows the prevalence of three dye families constituted by rhodamine-like dyes (40%), cyanines (34%), and trianguleniums (15%) totaling 89%. Focusing on rule 2, 183 of the 206 dyes are compliant and fit inside the redox window but many are too large in size which leads to the decrease in the final number. Considering rule 3 alone, we find 120 dyes are of the right size to serve as building blocks for making SMILES. When taking rule 2 into account this number again drops to 57 dye-solvent pairs and unique dyes.
Looking to SMILES compliance and beyond
The dataset shared here provides a set of paired optical and electrochemical data for a variety of fluorophores that can be used in various ways to advance the science, engineering, and digital discovery of SMILES materials. Given the paucity of electrochemical studies on fluorophores, this validated dataset can serve as a test set for calculating redox potentials using quantum chemical methods. These calculated potentials can then be used to estimate electrochemical properties in future literature extraction campaigns to augment any of the missing redox data. In addition, the workflow defined here may also be utilized or modified toward other goals. For example, the production of redox flow batteries25,26 requires the selection of molecules with specific oxidation and reduction potentials as well as high reversibility, which is constituted by the dyes tagged with the HQ signifier. Another use is for selection of photoredox catalysts (redox potentials, optical properties).28,43,455 Conclusions
A data extraction workflow has been used to generate a library of 206 dye-solvent combinations bearing both optical and electrochemical data from which properties screening identified 47 candidates that are predicted to form emissive SMILES materials. In these concluding remarks, we address recommendations for electrochemical data reporting, a summary of the key cheminformatic findings, and provide insights as to how these data can be used for improving materials design workflows.The extraction of electrochemical data from the literature relied on expert annotations, which restricted our workflow. This method was used to circumvent a series of serious limitations to extraction that arise because of the nonuniform reporting of electrochemical data. The workflow used here can be improved upon by relying on data that has been reported in a more uniform format. For example, we recommend following the advice of American Chemical Society editors53 to use systematic procedures for reporting electrochemical data and to promote use of natural language processing for extracting these properties. Submission of the data to appropriate databases is also recommended. Such databases include D3TaLES51 for experimental electrochemical data and RedDB87 for computational electrochemical data. Recent papers18,38 have highlighted the importance of domain-specific corpuses for data extraction, thus the creation of a molecule-centric schema for organizing the data collected herein represents the next logical step in this work. These remedies would allow the data to be presented in a way that is easily managed by automated tools such as web scraping and NLP. In addition to data extraction and validation, we used a method for estimating missing redox potentials from optical data.
The library of 206 dyes represented 13 different dye families. Our analyses show that the majority of cationic dyes present in the literature we sampled are acridiniums, followed closely by cyanines. We note a variety in the experimental conditions used to collect electrochemical data with some commonalities. The majority of the data extracted came from experiments run in acetonitrile, likely due to its wide solvent window and reasonable polarity.
The set of 47 candidate dyes include six dye families that have not previously been utilized in SMILES materials showcasing the use of mining methods to enable digital discovery. In future screening campaigns, and particularly when using larger datasets, the order of the rules can be changed to more efficiently identify SMILES dye candidates. Finally, the dataset can be utilized by members of the scientific community to identify candidates for a variety of applications beyond optical materials including photoredox catalysts and redox flow batteries. With input from others, this dataset can be expanded to be more representative of the dyes published across the literature.
Data availability
The data collected for this analysis is available at Figshare (https://doi.org/10.6084/m9.figshare.25852909). Two datasets are shared here. DyeData206 contains the 206 dye-solvent combinations of cationic dyes extracted from the literature and the 25 data entities that describe this pair. DyeData58 is a subset of DyeData206 that retains only the dye-solvent pairs that adhere to all of the SMILES rules. The deposited data also contains DOI links to the literature papers from which the data were extracted.Author contributions
M. K. L., M. C., A. J. S., and V. T. collected the data from the literature, validated these data, and performed the analyses. S. P. provided the data upload infrastructure. B. W. L. edited the paper. M. K. L., M. C., and A. H. F. co-wrote the paper.Conflicts of interest
The authors have no conflicts of interest to report.Acknowledgements
We acknowledge the National Science Foundation (DMR-2118423) and the Danish Council of Independent Research (DFF-0136-00122B) for financial support. M. K. L. thanks the NASA-INSGC for their support. We would like to thank James Law of CAS for his input on the data collection workflow.Notes and references
- T. Kinoshita, Y. Haketa, H. Maeda and G. Fukuhara, Chem. Sci., 2021, 12, 6691–6698 RSC.
- C. R. Benson, L. Kacenauskaite, K. L. VanDenburgh, W. Zhao, B. Qiao, T. Sadhukhan, M. Pink, J. S. Chen, S. Borgi, C. H. Chen, B. J. Davis, Y. C. Simon, K. Raghavachari, B. W. Laursen and A. H. Flood, Chem, 2020, 6, 1978–1997 CAS.
- A. H. Ashoka, I. O. Aparin, A. Reisch and A. S. Klymchenko, Chem. Soc. Rev., 2023, 52, 4525–4548 RSC.
- A. Reisch, P. Didier, L. Richert, S. Oncul, Y. Arntz, Y. Mély and A. S. Klymchenko, Nat. Commun., 2014, 5, 9 Search PubMed.
- Y. X. Song, G. C. Pan, C. C. Zhang, C. Wang, B. Xu and W. J. Tian, Mater. Chem. Front., 2023, 7, 5104–5119 RSC.
- V. Gray, K. Moth-Poulsen, B. Albinsson and M. Abrahamsson, Coord. Chem. Rev., 2018, 362, 54–71 CrossRef CAS.
- M. Saleem, M. Rafiq and M. Hanif, J. Fluoresc., 2017, 27, 31–58 CrossRef CAS.
- Y. Koide, Y. Urano, K. Hanaoka, T. Terai and T. Nagano, ACS Chem. Biol., 2011, 6, 600–608 CrossRef CAS PubMed.
- S. Broderick and K. Rajan, Sci. Technol. Adv. Mater., 2015, 16, 8 CrossRef.
- H. Binyamin and H. Senderowitz, npj Comput. Mater., 2022, 8, 17 CrossRef.
- T. N. Williams, M. A. Kuenemann, G. A. Van den Driessche, A. J. Williams, D. Fourches and H. S. Freeman, ACS Sustain. Chem. Eng., 2018, 6, 2344–2352 CrossRef CAS.
- T. N. Williams, G. A. Van den Driessche, A. R. B. Valery, D. Fourches and H. S. Freeman, ACS Sustain. Chem. Eng., 2018, 6, 14248–14256 CrossRef CAS.
- J. Q. Mai, T. Lu, P. C. Xu, Z. H. Lian, M. J. Li and W. C. Lu, Dyes Pigm., 2022, 206, 9 CrossRef.
- Y. H. Xia, G. C. Wang, Y. Z. Lv, C. J. Shao and Z. Q. Yang, Chem. Phys. Lett., 2024, 836, 8 CrossRef.
- A. Su and K. Rajan, Sci. Data, 2021, 8, 10 CrossRef.
- S. Kajita, T. Kinjo and T. Nishi, Commun. Phys., 2020, 3, 11 CrossRef.
- M. C. Swain and J. M. Cole, J. Chem. Inf. Model., 2016, 56, 1894–1904 CrossRef CAS.
- J. Mavracic, C. J. Court, T. Isazawa, S. R. Elliott and J. M. Cole, J. Chem. Inf. Model., 2021, 61, 4280–4289 CrossRef CAS.
- S. Lee, C. H. Chen and A. H. Flood, Nat. Chem., 2013, 5, 704–710 CrossRef CAS.
- B. Qiao, B. E. Hirsch, S. Lee, M. Pink, C. H. Chen, B. W. Laursen and A. H. Flood, J. Am. Chem. Soc., 2017, 139, 6226–6233 CrossRef CAS.
- J. S. Chen, S. M. A. Fateminia, L. Kacenauskaite, N. Bærentsen, S. G. Stenspil, J. Bredehoeft, K. L. Martinez, A. H. Flood and B. W. Laursen, Angew. Chem., Int. Ed., 2021, 60, 9450–9458 CrossRef CAS PubMed.
- L. Kacenauskaite, S. G. Stenspil, A. H. Olsson, A. H. Flood and B. W. Laursen, J. Am. Chem. Soc., 2022, 144, 19981–19989 CrossRef CAS PubMed.
- S. G. Stenspil, J. S. Chen, M. B. Liisberg, A. H. Flood and B. W. Laursen, Chem. Sci., 2024, 15, 5531–5538 RSC.
- J. S. Chen, S. G. Stenspil, S. Kaziannis, L. Kacenauskaite, N. Lenngren, M. Kloz, A. H. Flood and B. W. Laursen, ACS Appl. Nano Mater., 2022, 5, 13887–13893 CrossRef CAS.
- M. R. Gerhardt, L. C. Tong, R. Gómez-Bombarelli, Q. Chen, M. P. Marshak, C. J. Galvin, A. Aspuru-Guzik, R. G. Gordon and M. J. Aziz, Adv. Energy Mater., 2017, 7, 9 Search PubMed.
- K. J. Kim, Y. J. Kim, J. H. Kim and M. S. Park, Mater. Chem. Phys., 2011, 131, 547–553 CrossRef CAS.
- K. Gong, Q. R. Fang, S. Gu, S. F. Y. Li and Y. S. Yan, Energy Environ. Sci., 2015, 8, 3515–3530 RSC.
- T. P. Yoon, M. A. Ischay and J. N. Du, Nat. Chem., 2010, 2, 527–532 CrossRef CAS PubMed.
- M. H. Shaw, J. Twilton and D. W. C. MacMillan, J. Org. Chem., 2016, 81, 6898–6926 CrossRef CAS PubMed.
- M. D. Hughes, Y. J. Xu, P. Jenkins, P. McMorn, P. Landon, D. I. Enache, A. F. Carley, G. A. Attard, G. J. Hutchings, F. King, E. H. Stitt, P. Johnston, K. Griffin and C. J. Kiely, Nature, 2005, 437, 1132–1135 CrossRef CAS PubMed.
- S. S. BuHamra, A. N. Almutairi, A. K. Buhamrah, S. H. Almadani and Y. A. Alibrahim, Front. Public Health, 2022, 10, 1070870 CrossRef PubMed.
- A. S. Behr, M. Völkenrath and N. Kockmann, Knowl. Inf. Syst., 2023, 65, 5503–5522 CrossRef.
- D. Gunter, P. Puac-Polanco, O. Miguel, R. E. Thornhill, A. Y. X. Yu, Z. Y. A. Liu, M. Mamdani, C. Pou-Prom and R. I. Aviv, Neuroradiology, 2022, 64, 2357–2362 CrossRef.
- J. F. Joung, M. Han, M. Jeong and S. Park, Sci. Data, 2020, 7, 6 CrossRef.
- C. J. Court and J. M. Cole, Sci. Data, 2018, 5, 12 Search PubMed.
- S. Huang and J. M. Cole, Sci. Data, 2020, 7, 13 CrossRef.
- D. Y. Huang and J. M. Cole, Sci. Data, 2024, 11, 9 CrossRef PubMed.
- T. Isazawa and J. M. Cole, Sci. Data, 2023, 10, 11 CrossRef.
- Q. Y. Dong and J. M. Cole, J. Chem. Inf. Model., 2023, 63, 7045–7055 CrossRef CAS PubMed.
- Y. Zhang, C. Wang, M. Soukaseum, D. G. Vlachos and H. Fang, J. Chem. Inf. Model., 2022, 62, 3316–3330 CrossRef CAS PubMed.
- J. Guo, A. S. Ibanez-Lopez, H. Y. Gao, V. Quach, C. W. Coley, K. F. Jensen and R. Barzilay, J. Chem. Inf. Model., 2021, 61, 4124 CrossRef CAS PubMed.
- M. K. Son, H. Seo, K. J. Lee, S. K. Kim, B. M. Kim, S. Park, K. Prabakar and H. J. Kim, Thin Solid Films, 2014, 554, 114–117 CrossRef CAS.
- L. Y. Mei, J. M. Veleta and T. L. Gianetti, J. Am. Chem. Soc., 2020, 142, 12056–12061 CrossRef CAS PubMed.
- J. H. Kuhlmann, M. Uygur and O. G. Mancheño, Org. Lett., 2022, 24, 1689–1694 CrossRef CAS PubMed.
- M. H. Nowack, J. Moutet, B. W. Laursen and T. L. Gianetti, Synlett, 2024, 35, 307–312 CrossRef CAS.
- N. A. Romero and D. A. Nicewicz, Chem. Rev., 2016, 116, 10075–10166 CrossRef CAS PubMed.
- N. Holmberg-Douglas and D. A. Nicewicz, Chem. Rev., 2022, 122, 1925–2016 CrossRef CAS PubMed.
- Y. Y. Wu, D. Kim and T. S. Teets, Synlett, 2022, 33, 1154–1179 CrossRef CAS.
- A. Vega-Peñaloza, J. Mateos, X. Companyó, M. Escudero-Casao and L. Dell'Amico, Angew. Chem., Int. Ed., 2021, 60, 1082–1097 CrossRef PubMed.
- B. Zilate, C. Fischer and C. Sparr, ChemComm, 2020, 56, 1767–1775 RSC.
- R. Duke, V. Bhat, P. Sornberger, S. A. Odom and C. Risko, Digital Discovery, 2023, 2, 1152–1162 RSC.
- C. B. Cooper, E. J. Beard, A. Vázquez-Mayagoitia, L. Stan, G. B. G. Stenning, D. W. Nye, J. A. Vigil, T. Tomar, J. W. Jia, G. B. Bodedla, S. Chen, L. Gallego, S. Franco, A. Carella, K. R. J. Thomas, S. Xue, X. J. Zhu and J. M. Cole, Adv. Energy Mater., 2019, 9, 10 Search PubMed.
- S. Minteer, J. G. Chen, S. Lin, C. Crudden, S. Dehnen, P. V. Kamat, M. Kozlowski, G. Masson and S. J. Miller, J. Org. Chem., 2023, 88, 4036–4037 CrossRef CAS PubMed.
- S. Lee, S. Heinen, D. Khan and O. A. von Lilienfeld, Mach. Learn.: Sci. Technol., 2024, 5, 025058 Search PubMed.
- L. D. Wang, Y. Gao, X. Q. Chen, W. J. Cui, Y. C. Zhou, X. Y. Luo, S. S. Xu, Y. Du and B. Wang, Sci. Data, 2023, 10, 11 CrossRef PubMed.
- L. R. Faulkner and A. J. Bard, Electrochemical Methods: Fundamentals and Applications, Wiley, 111 River Street, Hoboken, NJ, 2nd edn, 2001 Search PubMed.
- T. Geiger, H. Benmansour, B. Fan, R. Hany and F. Nüesch, Macromol. Rapid Commun., 2008, 29, 651–658 CrossRef CAS.
- Y. Ooyama and Y. Harima, ChemPhysChem, 2012, 13, 4032–4080 CrossRef CAS PubMed.
- R. K. Jakobsen and B. W. Laursen, ChemPhotoChem, 2023, 8, e202300215 CrossRef.
- L. Kacenauskaite, N. Bisballe, R. Mucci, M. Santella, T. Pullerits, J. S. Chen, T. Vosch and B. W. Laursen, J. Am. Chem. Soc., 2021, 143, 1377–1385 CrossRef CAS PubMed.
- B. W. Laursen and T. J. Sorensen, J. Org. Chem., 2009, 74, 3183–3185 CrossRef CAS PubMed.
- B. P. Maliwal, R. Fudala, S. Raut, R. Kokate, T. J. Sorensen, B. W. Laursen, Z. Gryczynski and I. Gryczynski, PLoS One, 2013, 8, 19 CrossRef PubMed.
- T. J. Sorensen and B. W. Laursen, J. Org. Chem., 2010, 75, 6182–6190 CrossRef PubMed.
- A. Tarzia, D. M. Huang and C. Doonan, Mol-ellipsize (Version v1.0.1), Zenodo, 2021 Search PubMed.
- G. Landrum, RDKit (Release 2022_09_5), Zenodo, 2022 Search PubMed.
- N. Elgrishi, K. J. Rountree, B. D. McCarthy, E. S. Rountree, T. T. Eisenhart and J. L. Dempsey, J. Chem. Educ., 2018, 95, 197–206 CrossRef CAS.
- Various factors may contribute to the appearance of irreversibility in the CV, including slow electron transfer rates, instability of chemical species, and involvement of reversible chemical reactions. The first relates to the formal definition of an irreversible electron transfer in which the rate of electron transfer is slow, leading to the leading peak in the CV being shifted farther from the formal redox potential. Alternatively, the chemical product of the electron-transfer process is unstable and subject to decomposition, leading to a shift in the observed peak away from the formal potential as well as the absence of a return wave. Another alternative is that the product of electron transfer participates in a reversible chemical reaction, leading to the appearance of an irreversible CV.
- S. L. Gilat, S. H. Kawai and J. M. Lehn, Chem.–Eur. J., 1995, 1, 275–284 CrossRef CAS.
- Y. J. Li, T. F. Liu, H. B. Liu, M. Z. Tian and Y. L. Li, Acc. Chem. Res., 2014, 47, 1186–1198 CrossRef CAS PubMed.
- A. Menon, J. A. H. Dreyer, J. W. Martin, J. Akroyd, J. Robertson and M. Kraft, Phys. Chem. Chem. Phys., 2019, 21, 16240–16251 RSC.
- R. Rakhi and C. H. Suresh, ChemistrySelect, 2021, 6, 2760–2769 CrossRef CAS.
- S. Chakraborty, E. Yanes and R. Gershoni-Poranne, Beilstein J. Org. Chem., 2024, 20, 1817–1830 CrossRef PubMed.
- R. R. Gagne, C. A. Koval and G. C. Lisensky, Inorg. Chem., 1980, 19, 2854–2855 CrossRef CAS.
- D. Adler and J. Feinleib, Phys. Rev. B: Solid State, 1970, 2, 3112–3134 CrossRef.
- A. E. Cherkashin, F. I. Vilesov, N. P. Keier and N. N. Bulgakov, Phys. Solid State, 1969, 11, 506–517 Search PubMed.
- W. P. Doyle and G. A. Lonergan, Discuss. Faraday Soc., 1958, 27–33, 10.1039/df9582600027.
- H. J. Jiang, Z. Q. Gao, F. Liu, Q. D. Ling, W. Wei and W. Huang, Polymer, 2008, 49, 4369–4377 CrossRef CAS.
- F. F. Muhammad, A. I. A. Hapip and K. Sulaiman, J. Organomet. Chem., 2010, 695, 2526–2531 CrossRef CAS.
- H. Nejatipour and M. Dadsetani, J. Lumin., 2016, 172, 14–22 CrossRef CAS.
- S. Visniakova, I. Urbanaviciute, L. Dauksaite, M. Janulevicius, B. Lenkeviciute, I. Sychugov, K. Arlauskas and A. Zilinskas, J. Lumin., 2015, 167, 261–267 CrossRef CAS.
- P. F. Loos and D. Jacquemin, ChemPhotoChem, 2019, 3, 684–696 CrossRef CAS.
- R. Holze, Organometallics, 2014, 33, 5033–5042 CrossRef CAS.
- A. R. White, L. F. Wang and D. A. Nicewicz, Synlett, 2019, 30, 827–832 CrossRef CAS PubMed.
- A. S. Bondarenko, Anal. Chim. Acta, 2012, 743, 41–50 CrossRef CAS PubMed.
- H. Neugebauer, F. Bohle, M. Bursch, A. Hansen and S. Grimme, J. Phys. Chem. A, 2020, 124, 7166–7176 CrossRef CAS PubMed.
- C. W. Schlenker and M. E. Thompson, ChemComm, 2011, 47, 3702–3716 RSC.
- E. Sorkun, Q. Zhang, A. Khetan, M. C. Sorkun and S. Er, Sci. Data, 2022, 9, 9 CrossRef PubMed.
Footnotes |
| † Electronic supplementary information (ESI) available. See DOI: https://doi.org/10.1039/d4dd00137k |
| ‡ These authors contribute equally. |
| This journal is © The Royal Society of Chemistry 2024 |

