 Open Access Article
Exploitation of multi-walled carbon nanotubes/Cu(II)-metal organic framework based glassy carbon electrode for the determination of orphenadrine citrate
Ahmed K. Kammoun a,
Mona H. Abdelrahmanb,
Ahdab N. Khayyata,
Samar S. Elbaramawi
 c,
Tarek S. Ibrahima and
Nehad A. Abdallah
 *de
*de
aDepartment of Pharmaceutical Chemistry, Faculty of Pharmacy, King Abdulaziz University, Jeddah 21589, Saudi Arabia
bDepartment of Pharmaceutical Analytical Chemistry, Faculty of Pharmacy, Ain Shams University, Cairo 11566, Egypt
cDepartment of Medicinal Chemistry, Faculty of Pharmacy, Zagazig University, Zagazig 44519, Egypt
dPharmacognosy and Pharmaceutical Chemistry Department, Faculty of Pharmacy, Taibah University, Al-Madinah Al-Munawarah, 41477, Kingdom of Saudi Arabia
eExperimental and Advanced Pharmaceutical Research Unit (EAPRU), Faculty of Pharmacy, Ain Shams University, Cairo, 11566, Egypt. E-mail: nehad.amin@gmail.com
First published on 23rd October 2023
Abstract
Metal organic frameworks (MOFs), with structural tunability, high metal content and large surface area have recently attracted the attention of researchers in the field of electrochemistry. In this work, an unprecedented use of multi-walled carbon nanotubes (MWCNTs)/copper-based metal–organic framework (Cu-BTC MOF) composite as an ion-to-electron transducer in a potentiometric sensor is proposed for the determination of orphenadrine citrate. A comparative study was conducted between three proposed glassy carbon electrodes, Cu-MOF, (MWCNTs) and MWCNTs/Cu-MOF composite based sensors, where Cu-MOF, MWCNTs and their composite were utilized as the ion-to-electron transducers. The sensors were developed for accurate and precise determination of orphenadrine citrate in pharmaceutical dosage form, spiked real human plasma and artificial cerebrospinal fluid (ACSF). The sensors employed β-cyclodextrin as a recognition element with the aid of potassium tetrakis(4-chlorophenyl)borate (KTpCIPB) as a lipophilic ion exchanger. The sensors that were assessed based on the guidelines recommended by IUPAC and demonstrated a linear response within the concentration range of 10−7 M to 10−3 M, 10−6 M to 10−2 M and 10−8 M to 10−2 M for Cu-MOF, MWCNTs and MWCNTs/Cu-MOF composite based sensors, respectively. MWCNTs/Cu-MOF composite based sensor showed superior performance over other sensors regarding lower limit of detection (LOD), wider linearity range and faster response. The sensors demonstrated their potential as effective options for the analysis of orphenadrine citrate in quality control laboratories and in different healthcare activities.
1. Introduction
The use of solid-contact ion-selective electrodes (SC-ISEs) as wearable sensors has become a topic of significant interest for monitoring human health conditions. These sensors allow for real-time, non-destructive, and non-invasive analysis of ions in biological fluids. By removing the inner filling solution and inner reference electrode, SC-ISEs can be designed with more flexibility and require simpler production processes, making them compatible with modern planar processing technologies.1The glassy-carbon electrode is a new-generation solid-contact ion-selective electrode (SC-ISE) that features a layered device architecture. This electrode comprises an electrical contact that is coated with an ion-to-electron transducer and followed by an ion-selective membrane (ISM). Its primary goal is to deliver efficient analytical performance with a stable and robust design that can be applied for long-term analysis without any deterioration in performance. Any SC-ISE comprises two primary components: the ion recognition element and the transducer layer. The function of the transducer layer is to convert the ionic current to electronic current and stabilize the potential at the interface between the membrane and the substrate. Meanwhile, the recognition element (e.g., ionophores) is used to impart selectivity against a particular ion, which is achieved through various interactions such as the target's nature (charge and size), the ability to form weak interaction-based supramolecular assemblies (host-guest), and/or hydrophobic/hydrophilic forces.2
A variety of solid-contact functional materials have been introduced into SC-ISEs as ion-to-electron transducers such as conducting polymers, carbon nanotubes, graphene and recently metal–organic frameworks (MOFs).3 MOFs represent an intriguing class of porous and crystalline materials that constructed from the assembly between metal ions and functional organic ligands.4 They were first studied and investigated in 1965 by Tomic.5 Their unique properties such as the large surface area, tailored pore size, high stability, and high porosity enable them to be good candidates in various applications including sensing,6 gas storage,7 catalysis,8 chiral separation,9 and other interesting analytical applications.10
The use of MOFs in electrochemical sensing may be restricted due to their low electronic conductivity and instability in aqueous solutions. As a result, MOFs have been scarcely employed as electrode modifiers in electroanalysis, with only a few studies investigating their application.11–13 In recent times, there has been a growing trend of incorporating highly-conductive nanostructured materials with MOFs to enhance their electrocatalytic abilities and conductivity towards target analytes.14–18 To address the limitations of MOFs, the incorporation of highly-conductive materials has been identified as an effective strategy. Carbon-based materials, such as multi-walled carbon nanotubes (MWCNTs), have garnered significant interest in the electrochemical field owing to their remarkable physical and chemical properties, such as excellent electrical conductivity, high stability, and good mechanical strength.17 The inclusion of MWCNTs in the sensor design not only reduces electrical impedance but also enhances the electrochemical reactivity of analytes when compared to a single metallic environment.
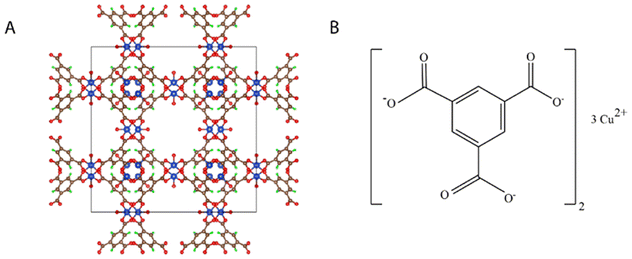
Basolite® C 300, Cu-BTC MOF or copper benzene-1,3,5-tricarboxylate is one of the MOFs family with rigid crystal structure, space group P1.19 The chemical and crystal structures of Cu-BTC MOF are shown in Fig. 1. It has a characteristic pyramidal skeleton with prominent edges. The surface area of Cu-BTC MOF is 343.32 m2 g−1 and it has a significant thermal stability.20
Carbon nanotubes (CNTs) is a class of sp2 hybridized carbon nano-materials which was first discovered by Iijima in 1991.21 MWCNTs are formed of multiple layers of graphene are wrapped concentrically. MWCNTs are characterized by being always metallic and the electronic transfer occurs across the carbon nanotube allowing the passage of current with minimum heating effect. The surface area of MWCNTs is approximately 10–20 m2 g−1.22 They have outstanding physicochemical characteristics, for instance excellent electrical conductivity, high thermal stability and high surface area.23 Owing to their promising properties, MWCNTs were exploited recently in many fields either alone or in nanocomposites, especially in electroanalysis.24,25
In this work, a comparative study was applied between three GCEs that were proposed for the accurate, precise and sensitive determination of orphenadrine citrate (ORPH) in different matrices including real human plasma samples, pharmaceutical dosage form and ACSF samples. The developed sensors were based on the incorporation of Cu-MOFs, MWCNTs and MWCNTs/Cu-MOFs composite as different transducers with β-cyclodextrin ionophore as a recognition element and potassium tetrakis(4-chlorophenyl)borate (KTpCIPB) as a lipophilic ion exchanger and investigated to be facile, non-invasive and rapid sensors for monitoring the concentration of orphenadrine citrate without applying time-consuming extraction methods.
To the best of our knowledge, there is no potentiometric method in literature that explored the incorporation of either Cu-BTC MOF or MWCNTs/Cu-MOFs in a potentiometric sensor for the determination of orphenadrine citrate. Moreover, it is the first time to harness Cu-BTC MOF as an ion-to-electron transducer for the analysis of a pharmaceutical drug in different matrices. The proposed sensors provide a promise for the analysis of orphenadrine citrate in real life applications.
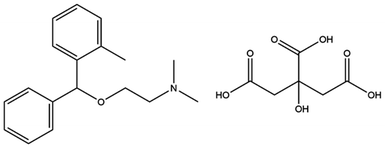
Orphenadrine citrate or (RS)-(dimethyl-2-(2-methylbenzhydroxy)ethyl) amine citrate; Fig. 2 is an anti-cholinergic drug that is commonly used to treat muscle spasm owing to its potent central and peripheral effects.26 Muscle spasms significantly affect the quality of life of patients suffering from liver cirrhosis. Orphenadrine citrate represents a very effective drug with prolonged therapeutic effect.27 It can be used as an analgesic with different co-administered drugs such as paracetamol, ibuprofen and diclofenac potassium.28,29 Orphenadrine citrate is considered a member of the centrally acting skeletal muscle relaxants, their use is limited by somnolence and the potential for abuse and dependency. The drug's effects on the central nervous system (CNS) may include dizziness, confusion, blurred vision, agitation, hallucinations, and headaches. In cases of excessive dosage, significant toxicity may occur, leading to CNS depression, which can manifest as stupor, respiratory depression, coma, and even death.30 Therefore, an accurate, facile and precise method of analysis is needed for the rapid analysis of orphenadrine citrate in plasma and in cerebrospinal fluid as the drug can pass the blood–brain barrier which is very critical in case of drug abuse.30
A review of the literature indicates that various techniques have been used for the quantitative analysis of orphenadrine citrate, including potentiometry,31–33 voltammetry,34 chromatography,35–39 and spectrophotometry.40,41 The potentiometric sensors reported in the literature were based on the use of either conventional liquid contact-ISE or coated wire electrodes (CWs) with the application of a plasticized membrane containing the orphenadrine–tetraphenyl borate/reineckate ion-pair complex as the electroactive material. The absence of an intermediate layer between the membrane and inner electrode in these sensors could result in potential instability owing to the formation of a water layer. Furthermore, the sensors described in the literature were only utilized for detecting orphenadrine citrate in bulk, tablets, and spiked human plasma.
2. Experimental
2.1. Apparatus
The equipment used included a CLEAN digital ion analyzer PH 600, model 007747 (China), a model 900201 Ag/AgCl double junction reference electrode (Thermo-Orion), and a Heidolph MR Hei-Standard magnetic stirrer, model 100818877.2.2. Materials and chemicals
Basolite® C 300 (Cu-BTC MOF), Cu3(C9H3O6)2, multi-walled carbon nanotubes (MWCNTs) (O.D × L 6–13 nm × 2.5–20 μm), 2-nitrophenyl octyl ether (NPOE) and N,N-dimethylformamide (N,N-DMF) were purchased from Sigma Aldrich, USA. Potassium tetrakis(4-chlorophenyl)borate (KTpCIPB), poly(vinyl chloride) (PVC) and beta-cyclodextrin β-CD were purchased from Acros Organics. Tetrahydrofuran (THF) was obtained from Fluka Chemical. The standard materials of orphenadrine citrate, paracetamol, ibuprofen, and diclofenac potassium were kindly supplied by experiments and advanced research unit, Cairo, Egypt. All the chemicals were of analytical grade purity. Norflex® tablets (labeled amount 100 mg orphenadrine citrate) manufactured by (Rudolstadt, Germany) was obtained from the local market.2.3. Standard solutions
A standard solution of orphenadrine citrate (1 × 10⁻¹ M) was prepared by dissolving the necessary quantity of pure orphenadrine citrate in 100 mL of acetate buffer (pH 5) freshly. The working solutions of orphenadrine citrate were then generated by diluting the stock solution using acetate buffer (pH 5) to obtain concentrations ranging from 1 × 10⁻² M to 1 × 10⁻¹⁰ M.2.4. Procedures
For MWCNTs/Cu-MOFs composite, 25 mg of each of Cu-BTC MOF and carboxylated MWCNTs were dispersed in 50 mL of N,N-DMF and ultrasonicated for 10 h at 25 °C to get homogeneous dispersion.
2.5. Sensor's calibration
An electrochemical cell was designed and the potential of the proposed sensors was measured against Ag/AgCl double junction reference electrode (Thermo-Orion). About 20 mL aliquots of orphenadrine citrate ranging in concentration from 1 × 10⁻² to 1 × 10⁻¹⁰ M were transferred into a series of 50 mL beakers. The emf readings were recorded by immersing the each of proposed sensors separately with the reference electrode in each solution with continuous stirring till attaining a constant potential reading. Graphs were created by plotting the electrode potential readings against the negative logarithmic concentration of orphenadrine citrate. A graphical depiction of the sensor's assembly is presented in Fig. 3.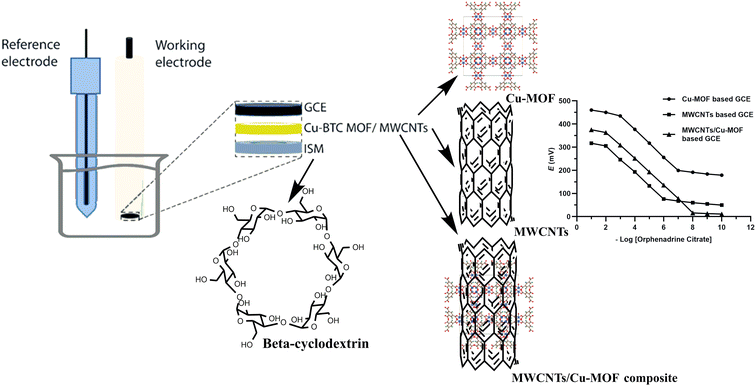 | ||
| Fig. 3 Schematic representation of the electrodes' assembly, GCE: glassy carbon electrode, ISM: ion selective membrane. | ||
2.6. Molecular docking
Molecular docking and visualization were conducted in silico for orphenadrine as the guest and the selected CD-ionophore as the host using Molecular Operating Environment (MOE; 2019.0102).43 The canonical SMILES of orphenadrine was obtained from the PubChem database (https://pubchem.ncbi.nlm.nih.gov/; accessed on 8 June 2023). The 3D structure of orphenadrine was constructed from its 2D structure and then energy minimized using the EHT forcefield with a 0.1 kcal mol−1 Å−2 gradient RMS in MOE.Three-dimensional structure of the selected CD-ionophore was extracted from the appropriate protein complex; retrieved from the protein data bank (https://www.rcsb.org/; accessed on 8 June 2023). The α-CD was extracted from B. thetaiotaomicron SusE with alpha-cyclodextrin (pdb: 4FEM, 2.50 Å),44 the β-CD was extracted from B. thetaiotaomicron SusD with beta-cyclodextrin (pdb: 3CK8, 2.10 Å)45 and the γ-CD was extracted from E. coli branching enzyme with gamma cyclodextrin (pdb: 5E70, 2.33 Å).46 In order to prepare the CD-ionophore structures for the docking process, the Quick-Prep panel in MOE was utilized. This preparation involved energy minimization, protonation at pH = 5, fixing and tethering atoms, deleting unnecessary water molecules, and initial refinement at a gradient RMS of 0.1 kcal mol−1 Å−2. Following this, the docking process for orphenadrine with the chosen CD-ionophores was conducted using alpha triangle placement with Amber10: EHT forcefield. The resulting docked structures were then refined using forcefield and scored using the Affinity dG scoring system.
2.7. Pharmaceutical sample analysis
To determine the average weight of one Norflex® tablet, twenty tablets were weighed. A precise amount of finely ground powder tablets, equivalent to 0.461 g of orphenadrine citrate, was then transferred into a 100 mL volumetric flask and filled with acetate buffer at pH 5 to prepare a 1 × 10⁻² M stock solution. Appropriate dilutions were made from the prepared stock to obtain different concentrations of orphenadrine samples.2.8. Determination of orphenadrine citrate in real human plasma samples
For plasma samples preparation, 0.5 mL of plasma was spiked with different concentrations of standard orphenadrine citrate followed by the addition of 0.5 mL of acetonitrile to precipitate the plasma proteins. Following centrifugation at 10![[thin space (1/6-em)]](https://www.rsc.org/images/entities/char_2009.gif) 000 rpm for 3 minutes, 0.5 mL of the resulting supernatant was transferred into a 10 mL volumetric flask and diluted with acetate buffer at pH 5 to generate samples of different concentrations. The developed sensors were then employed to determine orphenadrine citrate concentrations using the corresponding regression equation.
000 rpm for 3 minutes, 0.5 mL of the resulting supernatant was transferred into a 10 mL volumetric flask and diluted with acetate buffer at pH 5 to generate samples of different concentrations. The developed sensors were then employed to determine orphenadrine citrate concentrations using the corresponding regression equation.
2.9. Determination of orphenadrine citrate in ACSF
ACSF solution was prepared according to a previous procedure adopted from elsewhere.47 Two distinct solutions, A and B, were combined to create the prepared solution. Solution (A) was prepared by mixing 738.66 mg of D-(+)-glucose, 7012.8 mg of NaCl, 155.4 mg of CaCl2, 162.6 mg of MgCl2·6H2O, and 337.34 mg of Na acetate in 1 liter of acidic electrolyte solution with a pH of 3.9. Solution (B) was prepared by mixing 2184.3 mg of NaHCO3, 223.65 mg of KCl, and 62.4 mg of NaH2PO4 in 1 liter of alkaline electrolyte solution with a pH of 8. The two solutions were individually filtered and then mixed equally at a temperature of 25 °C to form ACSF. Orphenadrine citrate standard solutions of various concentrations were prepared by combining 1 mL of each solution with 1 mL of ACSF in a 10 mL volumetric flask. These resulting solutions were then diluted with acetate buffer pH 5 up to the mark to obtain samples with concentrations of 1 × 10⁻³ M, 1 × 10⁻⁴ M, 1 × 10⁻⁵ M, and 1 × 10⁻⁶ M.3. Results and discussion
3.1. Molecular docking
To gain insights into orphenadrine–cyclodextrin ionophore interactions (guest–host interactions); molecular docking studies were performed. Results of the molecular docking showed that orphenadrine fits perfectly within each of the α-CD, β-CD and γ-CD ionophores developing an inclusion complex with reasonable binding affinity (Table 1).| Guest | Docking energy score; kcal mol−1 | Interactions | Host |
|---|---|---|---|
| Orphenadrine | −4.8673 | 1 H-bond | α-CD |
| −5.8370 | 1 H-bond, 2 pi–H | β-CD | |
| −5.3642 | 1 H-bond, 1 pi–H | γ-CD |
Docking energy score of orphenadrine–β-CD-ionophore is −5.8370 kcal mol−1; indicating that β-CD-ionophore is the most stable one in the inclusion complex. This is followed by orphenadrine–γ-CD-ionophore (−5.3642 kcal mol−1) and finally orphenadrine–α-CD-ionophore (−4.8673 kcal mol−1).
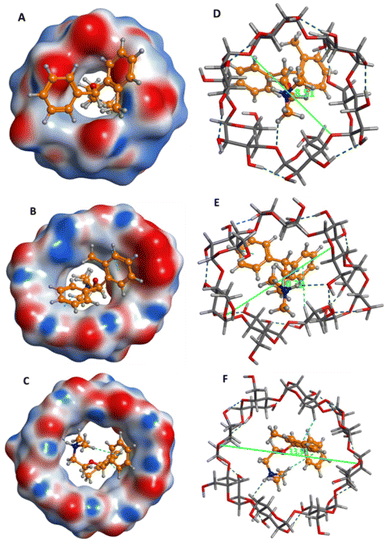
Furthermore, the average molecular diameters for α-CD, β-CD and γ-CD are 8.51, 10.32, 13.91 Å, respectively and the average diameter of orphenadrine is 9.10 Å; indicating that β-CD is ideally suited to orphenadrine for perfect fitting (Fig. 4).
In molecular interactions, orphenadrine showed H-bond interaction with the α-CD pocket. With the β-CD, amino group of orphenadrine formed H-bond interaction, while both phenyl rings showed pi–H bond interactions, indicating good binding interactions. Finally, amino group and one phenyl ring exhibited H-bond and pi–H bond interactions, respectively with the γ-CD pocket.
Practically, PVC-coated graphite electrodes were fabricated utilizing the prepared PVC membrane in Section 2.4.2 with the incorporation of α-CD, β-CD and γ-CD, separately and were applied separately for the determination of ORPH in aqueous solutions. The α-CD, β-CD and γ-CD based electrodes exhibited Nernstian responses of 48.78, 55.76 and 52.06 mV per concentration decade, respectively over the concentration range of 1 × 10⁻² M to 1 × 10⁻⁵ M. Intriguingly, docking results were correlated with Nernstian responses; revealing that orphenadrine–β-CD inclusion complex is the most stable one.
3.2. Sensor's performance characteristics
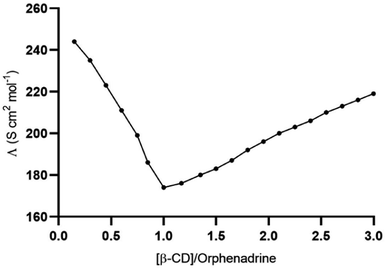
The sensing of the potentiometric CPE towards the target analyte is governed by the presence of β-CD as a recognition element. The accessibility of orphenadrine molecule to the cavity of β-CD and the formation of selective hydrogen bonding into their cavities resulting in the formation of stable host–guest complexes. The potentiometric response was produced as a result of the generation of the phase boundary potential due to the formation of such inclusion complexes. The charge separation, whose magnitude is concentration-dependent, is formed at the interface between the electrode paste and the aqueous sample. This results in the generation of the potential difference (emf) between the reference electrode (concentration-independent potential) and the SC-ISE.In addition to the molecular docking study, the conductometric measurement was executed to affirm the effective interaction between β-CD and orphenadrine. Fig. 5 illustrates a plot of the conductance (Λm) vs. β-CD/EP.HCl mole ratio. The conductance was gradually decreased with the addition of β-CD and it leveled out at a molar ratio of β-CD to orphenadrine molecule of around one. It indicates the formation of a rather stable (1![[thin space (1/6-em)]](https://www.rsc.org/images/entities/char_2009.gif) :
:![[thin space (1/6-em)]](https://www.rsc.org/images/entities/char_2009.gif) 1) stoichiometry combination of orphenadrine and β-CD. This complex seems to have lower mobility than free, uncomplexed orphenadrine, which would limit its ability to transfer charges and reduce the solution's conductivity.
1) stoichiometry combination of orphenadrine and β-CD. This complex seems to have lower mobility than free, uncomplexed orphenadrine, which would limit its ability to transfer charges and reduce the solution's conductivity.
The construction and performance characteristics of the studied GCEs based on the drop casting of the PVC membrane containing the recognition element β-CD over the transducer film. To study the effect of the transducer layer thickness on the electrode response, 3 different electrodes were fabricated with different volumes of the drop casted transducer layer (5 μL, 7 μL and 10 μL). The optimum potentiometric response was attained with a transducer layer thickness of 5 μL, 7 μL and 7 μL for Cu-BTC-MOF, MWCNTs, and MWCNTs/Cu-MOF based sensors, respectively as being represented in Fig. 6. When using the drop casting technique to increase the thickness of the transducer layer, it is possible that the material may form “islands.” These islands can negatively impact the electrical contact between the transducer and the electrode, ultimately hindering it.11
 | ||
| Fig. 6 The effect of the ion-to-electron transducer layer on the potentiometric response of the GCE, (a) Cu-MOF, (b) MWCNTs and (c) MWCNTs/Cu-MOF composite. | ||
The proposed sensors' performance characteristics were assessed in line with the IUPAC recommendation48 and the results were compiled in Table 2.
| Parameter | Cu-MOF based GCE | MWCNTs based GCE | MWCNTs/Cu-MOF based GCE |
|---|---|---|---|
| a The mean of five measurements taken at five different concentration levels.b The mean of five determinations of three QC samples.c The mean of five determinations of three QC samples of using three independently fabricated sensors. | |||
| Concentration range (M) | 1 × 10⁻³ to 1 × 10⁻⁷ | 1 × 10⁻² to 1 × 10⁻⁶ | 1 × 10⁻² to 1 × 10⁻⁸ |
| Slope (mV per decade) | 58.85 ± 0.45 | 57.19 ± 0.33 | 60.05 ± 0.16 |
| Intercept | 609.3 | 419.33 | 388.23 |
| Correlation coefficient (r2) | 0.992 | 0.991 | 0.996 |
| LOD (mol L−1) | 2 × 10⁻⁸ | 7 × 10⁻⁷ | 4 × 10⁻⁹ |
| Response time (s) | 15 ± 2.8 | 13 ± 2.1 | 8 ± 1.3 |
| Stability (days) | 47 | 55 | 69 |
| Working pH range | 3–7 | 3–8 | 3–7 |
| Average recoverya | 100.09 ± 0.921 | 100.02 ± 0.821 | 100.56 ± 0.476 |
| Intraday precisionb (RSD%) | 0.585 | 0.637 | 0.605 |
| Interday precisionb (RSD%) | 0.835 | 0.850 | 0.955 |
| Reproducibilityc (RSD%) | 1.21 | 1.67 | 1.01 |
The MWCNTs, Cu-BTC-MOF and MWCNTs/Cu-MOF based GCEs exhibited a Nernstian mono-valent cation ideal responses of 57.19 ± 0.33, 58.85 ± 0.45 and 60.05 ± 0.16 mV per concentration decade over the concentration range of 1 × 10⁻² M to 1 × 10⁻⁶ M, 1 × 10⁻³ M to 1 × 10⁻⁷ M and 1 × 10⁻² M to 1 × 10⁻⁸ M, respectively. It revealed the superior sensitivity of the MWCNTs/Cu-MOF based sensor with LOD value of 4 × 10⁻⁹ M that was measured by the intersection of the two extrapolated linear portions of the curves. The potentiometric behavior of the proposed sensors is represented in Fig. 7. MWCNTs/Cu-MOF based sensor exhibited better linearity (r2 = 0.996) and faster response time (5 s ± 1.3) compared to MWCNTs based sensor (r2 = 0.991) with response time (7 s ± 2.1) and Cu-BTC MOF based sensor (r2 = 0.992) with response time (5 s ± 1.8). The faster response time of the Cu-BTC MOF and MWCNTs/Cu-MOF based sensors is owing to the large surface area of the Cu-BTC MOF molecule (343.32 m2 g−1) compared to that of MWCNTs (10–20 m2 g−1) which allows higher contact between GCE and the ISM that enhances ion-to-electron transduction at the interface.
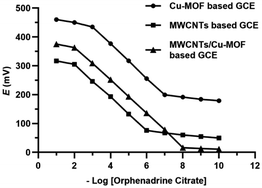 | ||
| Fig. 7 Profile of the potential (mV) versus −log concentrations of orphenadrine citrate (M) for the proposed sensors. | ||
The lifetime and stability of the studied sensors was monitored through continuous measuring their linearity range, the calibration slope, response time and LOD to ensure their precision within ±2% of their original values. The MWCNTs/Cu-MOF based sensor showed the maximum stability and longer lifetime for 69 days.
Reversibility of the proposed sensors was investigated by measuring the potential values of ORPH samples from high to low concentrations and from low to high concentrations as shown in Fig. 8. It was found the response of the three proposed sensors is reversible and the time taken for equilibrium from high to low concentration is longer than from low to high concentration. By comparing the dynamic response of the three sensors, it was found that superior response of MWCNTs/Cu-MOF based GCE relative to the others. The time need to attain equilibrium from high to low concentration was about 22 s ± 1.5 and that from low to high concentration was about 8 s ± 1.3.
 | ||
| Fig. 8 The dynamic response time from low to high and high to low concentrations in (a) Cu-MOF based GCE, (b) MWCNTs based GCE and (c) MWCNTs/Cu-MOF based GCE. | ||
3.3. Water layer test
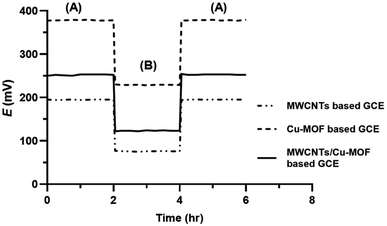
The water layer test is used to identify any possible drift in the response of SC-ISEs due to the formation of a water layer between the transducer and the ISM. For this test, the potential reading of 1 × 10⁻⁴ M orphenadrine citrate was monitored for 2 hours as the primary ion, followed by 1 × 10⁻⁴ M melitracen hydrochloride as an interfering ion for another 2 hours, and then back to 1 × 10⁻⁴ M orphenadrine citrate for 2 hours. Fig. 9 shows that the response of the proposed sensors did not change after conditioning with the interfering ion for 2 hours, indicating the absence of a water layer in all sensors. This could be attributed to the hydrophobic nature of the prepared transducer layer that prevents the formation of a water layer at the interface with the ISM.49,503.4. Effect of pH
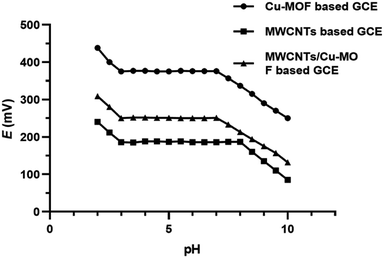
The impact of pH on the response of the proposed sensors was studied by using 1 × 10⁻⁴ M orphenadrine citrate solution. The pH values of the investigated solutions were adjusted in the range from 2 to 10 using aliquots of diluted hydrochloric acid or sodium hydroxide solutions. The proposed Cu-BTC-MOF, MWCNTs and MWCNTs/Cu-MOF based GCEs showed stable constant readings over the range 3–7, 3–8 and 3–7, respectively as shown in Fig. 10. Therefore, pH 5 was adopted as the working pH value for the proposed sensors using acetate buffer, where orphenadrine citrate is protonated. Above pH 8, it was observed that the potential readings decreased owing to the presence of orphenadrine citrate in a non-protonated form. Nevertheless, below pH 3, the sensors are saturated with hydrogen ions that disturbs the performance of the sensors.3.5. Sensor's selectivity
To evaluate the selectivity of the proposed sensors in the presence of interferents and co-administered drugs, the matched potential method48 was employed. This involved adding a known amount of orphenadrine citrate solution (aA′) to a reference solution (1 × 10⁻⁴ M orphenadrine citrate) and measuring the resulting potential change (ΔE). Next, the reference solution was supplemented with a solution of an interfering ion with an activity of (aB) to generate an equivalent potential change (ΔE), and the selectivity coefficient (log![[thin space (1/6-em)]](https://www.rsc.org/images/entities/char_2009.gif) Kpotorphenadrine,interferent) was calculated using the following equation:
Kpotorphenadrine,interferent) was calculated using the following equation:Table 3 lists the selectivity coefficients of the tested samples, which demonstrate the high selectivity of the sensors towards orphenadrine citrate.
![[thin space (1/6-em)]](https://www.rsc.org/images/entities/char_2009.gif) Kpotorphenadrine,interferent) for the proposed sensors
Kpotorphenadrine,interferent) for the proposed sensors
| Interfering ions | (log![[thin space (1/6-em)]](https://www.rsc.org/images/entities/char_2009.gif) Kpotorphenadrine,interferent) Kpotorphenadrine,interferent) |
||
|---|---|---|---|
| Cu-MOF based GCE | MWCNTs based GCE | MWCNTs/Cu-MOF based GCE | |
| Starch | −4.32 | −4.08 | −4.13 |
| Glucose | −5.08 | −4.64 | −3.87 |
| Magnesium stearate | −2.34 | −2.53 | −3.25 |
| KCl | −3.55 | −3.16 | −3.02 |
| NaCl | −2.45 | −2.78 | −3.97 |
| Paracetamol | −2.89 | −3.15 | −4.02 |
| Ibuprofen | −3.54 | −2.87 | −3.76 |
| Diclofenac potassium | −3.23 | −3.36 | −3.82 |
Table 4 compares the response characteristics of the proposed GCEs with those of the previously reported selective potentiometric sensors for orphenadrine citrate. The results demonstrated that the suggested sensors exhibited better response characteristics and stability than the other reported ones. The MWCNTs/Cu-MOF based GCE showed should wider linearity range, shorter response time, longer stability and higher sensitivity than the other reported sensors.
| Electrode composition | Linearity range (M) | LOD (M) | Slope (mV per decade) | Response time (s) | Lifetime | pH range | Ref. |
|---|---|---|---|---|---|---|---|
| CPE with orphenadrine–sodium tetraphenylborate complex | 1 × 10⁻² to 1 × 10⁻⁶ | 1.016 × 10⁻⁶ | 57.20 ± 0.7 | 9 s | 4–5 weeks | 3.5–8 | 31 |
| PCV based electrode with orphenadrine–sodium tetraphenylborate complex | 1 × 10⁻² to 1 × 10⁻⁶ | 0.984 × 10⁻⁶ | 56.81 ± 1.6 | 13 s | 2–3 weeks | 3.5–7.5 | |
| Screen printed electrode with orphenadrine–sodium tetraphenylborate complex | 1 × 10⁻² to 1 × 10⁻⁶ | 0.991 × 10⁻⁶ | 57.09 ± 0.2 | 7 s | 18–25 weeks | 3–8 | |
| Coated graphite electrode with orphenadrine–tetrakis(4-chlorophenyl)borate complex | 1 × 10⁻² to 1 × 10⁻⁵ | 6.8 × 10⁻⁶ | 54.8 | 5 s | 42 days | 4–7 | 32 |
| Coated platinum wire electrode with orphenadrine–tetrakis(4-chlorophenyl)borate complex | 1 × 10⁻² to 1 × 10⁻⁴ | 5.8 × 10⁻⁵ | 51.6 | 7 s | 18 days | 4–7 | |
| PVC based electrode with orphenadrine–ammonium reineckate complex | 1 × 10⁻² to 9 × 10⁻⁶ | 1 × 10⁻⁵ | 58.5 | 35 s | 8 weeks | 4–9 | 33 |
3.6. Analytical applications
The proposed sensors have been applied for the determination of orphenadrine citrate in Norflex® tablets, spiked samples of human plasma and ACSF without any sample extraction or pretreatment steps. As being reported in Table 5, the proposed electrodes exhibited high recovery values for the determination of orphenadrine in different matrices. The results indicate the high efficiency and accuracy of the proposed GCEs especially MWCNTs/Cu-MOF based GCE. The results of proposed CPEs of the quantitation of orphenadrine citrate in pharmaceutical tablets and human plasma were statistically compared to the official USP method and other reported method,35 respectively. As shown in Table 5, no significant differences were detected between the reported methods and the proposed sensors using the Student's t-test and F-test at p = 0.05.| Cu-MOF based GCE | MWCNTs based GCE | MWCNTs/Cu-MOF based GCE | ||
|---|---|---|---|---|
| Recovery (%) | Recovery (%) | Recovery (%) | ||
a The official method of USP 2023 of the pharmaceutical tablets was RP-HPLC with UV detection at 257 nm. The mobile phase was formed of acetonitrile![[thin space (1/6-em)]](https://www.rsc.org/images/entities/char_2009.gif) : :![[thin space (1/6-em)]](https://www.rsc.org/images/entities/char_2009.gif) phosphate buffer (pH 3.6) (50 phosphate buffer (pH 3.6) (50![[thin space (1/6-em)]](https://www.rsc.org/images/entities/char_2009.gif) : :![[thin space (1/6-em)]](https://www.rsc.org/images/entities/char_2009.gif) 50) with a flow rate of 2 mL min−1. The average recovery of six concentrations of orphenadrine was 99.57 ± 0.85.b The applied reported method of the human plasma matrix was RP-HPLC with UV detection at 215 nm. The mobile phase was formed of Acetonitrile 50) with a flow rate of 2 mL min−1. The average recovery of six concentrations of orphenadrine was 99.57 ± 0.85.b The applied reported method of the human plasma matrix was RP-HPLC with UV detection at 215 nm. The mobile phase was formed of Acetonitrile![[thin space (1/6-em)]](https://www.rsc.org/images/entities/char_2009.gif) : :![[thin space (1/6-em)]](https://www.rsc.org/images/entities/char_2009.gif) water (50 water (50![[thin space (1/6-em)]](https://www.rsc.org/images/entities/char_2009.gif) : :![[thin space (1/6-em)]](https://www.rsc.org/images/entities/char_2009.gif) 50), pH = 2.6 using propylparaben sodium as internal standard. The average recovery of six concentrations was 100.07 ± 1.14.c The figures in parenthesis are the theoretical values of t and F at p = 0.05. 50), pH = 2.6 using propylparaben sodium as internal standard. The average recovery of six concentrations was 100.07 ± 1.14.c The figures in parenthesis are the theoretical values of t and F at p = 0.05. |
||||
| Norflex tabletsa | 1 × 10⁻³ M | 99.63 | 98.76 | 100.25 |
| 1 × 10⁻⁴ M | 100.74 | 99.34 | 99.87 | |
| 1 × 10⁻⁵ M | 99.56 | 99.78 | 101.03 | |
| 1 × 10⁻⁶ M | 98.77 | 100.04 | 100.04 | |
| 1 × 10⁻⁷ M | 98.98 | — | 99.46 | |
| 1 × 10⁻⁸ M | — | — | 99.05 | |
| Average recovery ± SD | 99.54 ± 0.767 | 99.48 ± 0.560 | 99.95 ± 0.681 | |
| Variance | 0.588 | 0.314 | 0.464 | |
| N | 5 | 4 | 6 | |
| Student's t-testc | 0.06 (2.26) | 0.20 (2.31) | 0.85 (2.23) | |
| F-Testc | 1.23 (6.26) | 2.3 (9.01) | 1.56 (5.05) | |
| Spiked human plasmab | 1 × 10⁻² M | — | 98.31 | 99.33 |
| 1 × 10⁻³ M | 97.92 | 98.84 | 99.78 | |
| 1 × 10⁻⁴ M | 99.43 | 97.48 | 100.17 | |
| 1 × 10⁻⁵ M | 99.51 | 100.65 | 101.84 | |
| 1 × 10⁻⁶ M | 100.37 | 98.98 | 99.88 | |
| 1 × 10⁻⁷ M | 98.66 | — | 98.82 | |
| Average recovery ± SD | 99.18 ± 0.928 | 98.85 ± 1.165 | 99.97 ± 1.031 | |
| Variance | 0.861 | 1.357 | 1.063 | |
| N | 5 | 5 | 6 | |
| Student's t-testc | 1.43 (2.26) | 1.75 (2.26) | 0.16 (2.23) | |
| F-Testc | 1.51 (6.26) | 0.96 (6.26) | 1.22 (5.05) | |
| ACSF | 1 × 10⁻³ M | 98.22 | 97.67 | 99.87 |
| 1 × 10⁻⁴ M | 97.65 | 98.04 | 99.56 | |
| 1 × 10⁻⁵ M | 99.32 | 98.59 | 101.21 | |
| 1 × 10⁻⁶ M | 99.77 | 99.43 | 99.52 | |
| Average recovery | 98.74 ± 0.98 | 98.43 ± 0.76 | 100.04 ± 0.79 | |
4. Conclusion
In this study, three GCEs were evaluated for their ability to detect orphenadrine citrate in pharmaceutical formulations, real human plasma, and ACSF solutions. Cu-BTC MOF was used for the first time as an ion-to-electron transducer in a potentiometric sensor. To enhance the transducer's limited conductivity, it was mixed with MWCNTs. The MWCNTs/Cu-MOF-based sensor outperformed the Cu-MOF or MWCNTs-based sensors in terms of linearity range, response time, sensitivity, and stability. All sensors provided precise and accurate recovery values, allowing them to detect orphenadrine citrate at concentrations as low as 1 × 10⁻⁷ M, 1 × 10⁻⁶ M, and 1 × 10⁻⁸ M for Cu-MOF, MWCNTs, and MWCNTs/Cu-MOF-based sensors, respectively. The investigated sensors exhibited high selectivity and could be considered as suitable candidates for orphenadrine citrate analysis in quality control labs. The high sensitivity of the proposed sensors in biological matrix promotes them to be applied for the quantitation of the drug in bioavailability and bioequivalence studies. The future perspective of our research is the chemical synthesis of more sensitive and stable ion-to-electron transducer composites to be applied in different electrochemical measurements.Conflicts of interest
There are no conflicts of interest to declare.Acknowledgements
The Deanship of Scientific Research (DSR) at King Abdulaziz University, Jeddah, Saudi Arabia has funded this project under grant no. (RG-34-166-43). The authors, therefore, acknowledge with thanks the DSR for technical and financial support.References
- Y. Ishige, S. Klink and W. Schuhmann, Angew Chem. Int. Ed. Engl., 2016, 55, 4831–4835 CrossRef CAS PubMed.
- N. A. Abdallah, Y. M. Alahmadi, R. Bafail and M. A. Omar, J. Appl. Electrochem., 2022, 52, 311–323 CrossRef CAS.
- M. Fibbioli, W. E. Morf, M. Badertscher and N. F. d. R. E. Pretsch, Electroanalysis, 2000, 12, 1286–1292 CrossRef CAS.
- P. Rocío-Bautista, I. Taima-Mancera, J. Pasán and V. Pino, Separations, 2019, 6, 33 CrossRef.
- E. Tomic, J. Appl. Polym. Sci., 1965, 9, 3745–3752 CrossRef CAS.
- H.-Y. Li, S.-N. Zhao, S.-Q. Zang and J. Li, Chem. Soc. Rev., 2020, 49, 6364–6401 RSC.
- H. Li, K. Wang, Y. Sun, C. T. Lollar, J. Li and H.-C. Zhou, Mater. Today, 2018, 21, 108–121 CrossRef CAS.
- D. Yang and B. C. Gates, ACS Catal., 2019, 9, 1779–1798 CrossRef CAS.
- S. Das, S. Xu, T. Ben and S. Qiu, Angew Chem. Int. Ed. Engl., 2018, 57, 8629–8633 CrossRef CAS PubMed.
- Z. Y. Gu, C. X. Yang, N. Chang and X. P. Yan, Acc. Chem. Res., 2012, 45, 734–745 CrossRef CAS PubMed.
- L. Mendecki and K. A. Mirica, ACS Appl. Mater. Interfaces, 2018, 10, 19248–19257 CrossRef CAS PubMed.
- S. E. Elashery and H. Oh, Anal. Chim. Acta, 2021, 1181, 338924 CrossRef CAS PubMed.
- M. Abdollahzadeh, B. Bayatsarmadi, M. Vepsäläinen, A. Razmjou and M. Asadnia, Sens. Actuators, B, 2022, 350, 130799 CrossRef CAS.
- N. A. Abdallah, Int. J. Electrochem. Sci., 2023, 18, 100140 CrossRef.
- P. George and P. Chowdhury, Microporous Mesoporous Mater., 2019, 288, 109591 CrossRef CAS.
- K. A. Milakin, N. Gavrilov, I. A. Pašti, Z. Morávková, U. Acharya, C. Unterweger, S. Breitenbach, A. Zhigunov and P. Bober, Polymer, 2020, 208, 122945 CrossRef CAS.
- W. Xiong, Z. Zeng, X. Li, G. Zeng, R. Xiao, Z. Yang, Y. Zhou, C. Zhang, M. Cheng, L. Hu, C. Zhou, L. Qin, R. Xu and Y. Zhang, Chemosphere, 2018, 210, 1061–1069 CrossRef CAS PubMed.
- W. Yao, H. Guo, H. Liu, Q. Li, R. Xue, N. Wu, L. Li, M. Wang and W. Yang, J. Electrochem. Soc., 2019, 166, B1258 CrossRef.
- S. N. Nobar, Mater. Chem. Phys., 2018, 213, 343–351 CrossRef.
- N. M. Mahmoodi and J. Abdi, Microchem. J., 2019, 144, 436–442 CrossRef.
- S. Iijima, Nature, 1991, 354, 56–58 CrossRef CAS.
- R. H. Baughman, A. A. Zakhidov and W. A. de Heer, Science, 2002, 297, 787–792 CrossRef CAS PubMed.
- E. A. Al-Harbi, M. H. Abdelrahman and A. M. El-Kosasy, Sensors, 2019, 19, 2357 CrossRef CAS PubMed.
- V. Pifferi, G. Cappelletti, C. Di Bari, D. Meroni, F. Spadavecchia and L. Falciola, Electrochim. Acta, 2014, 146, 403–410 CrossRef CAS.
- M. Ali, M. A. U. Khalid, Y. S. Kim, A. M. Soomro, S. Hussain, Y. H. Doh and K. H. Choi, J. Electrochem. Soc., 2021, 168, 037507 CrossRef CAS.
- S. Abd-Elsalam, F. El-Kalla, L. A. Ali, S. Mosaad, W. Alkhalawany, B. Elemary, R. Badawi, A. Elzeftawy, A. Hanafy and A. Elfert, United Eur. Gastroenterol. J., 2018, 6, 422–427 CrossRef CAS PubMed.
- S. S. Mehta and M. B. Fallon, Clin. Gastroenterol. Hepatol., 2013, 11, 1385–1391 CrossRef PubMed.
- H. O. Hoivik and N. Moe, Curr. Med. Res. Opin., 1983, 8, 531–535 CrossRef CAS PubMed.
- M. Borsodi, E. Nagy and K. Darvas, Orv. Hetil., 2008, 149, 1847–1852 Search PubMed.
- H. J. Waldman, J. Pain Symptom Manage., 1994, 9, 434–441 CrossRef CAS PubMed.
- E. Y. Frag, T. A. Ali, G. G. Mohamed and Y. H. Awad, Int. J. Electrochem. Sci., 2012, 7, 4443–4464 CrossRef CAS.
- M. Nebsen, M. K. Abd El-Rahman, M. Amira, M. Y. Salem and G. Mohamed, Port. Electrochim. Acta, 2011, 29, 165–176 CrossRef CAS.
- E. M. Elnemma, F. M. El Zawawy and S. S. M. Hassan, Microchim. Acta, 1993, 110, 79–88 CrossRef CAS.
- T. Kokab, A. Shah, M. A. Khan, M. Arshad, J. Nisar, M. N. Ashiq and M. A. Zia, ACS Appl. Nano Mater., 2021, 4, 4699–4712 CrossRef CAS.
- M. S. Arayne, N. Sultana and F. A. Siddiqui, J. Chin. Chem. Soc., 2009, 56, 169–174 CrossRef CAS.
- S. Y. Lee, H. J. Oh, J. W. Kim, Y. G. Kim, C. J. Moon and E. H. Lee, J. Chromatogr. B: Anal. Technol. Biomed. Life Sci., 2006, 839, 118–123 CrossRef CAS PubMed.
- M. A. Saracino, C. Petio, M. Vitali, L. Franchini and M. A. Raggi, J. Pharm. Biomed. Anal., 2009, 50, 501–506 CrossRef CAS PubMed.
- K. Darwish, I. Salama, S. Mostafa and M. El-Sadek, Chem. Pharm. Bull., 2012, 60, 1426–1436 CrossRef CAS PubMed.
- S. M. Selkirk, A. F. Fell, G. Smith and J. H. Miller, J. Chromatogr. A, 1984, 288, 431–444 CrossRef CAS.
- M. I. Walash, F. F. Belal, M. I. Eid and S. A. Mohamed, Chem. Cent. J., 2011, 5, 60 CrossRef CAS PubMed.
- A. M. Yehia and M. K. Abd El-Rahman, Spectrochim. Acta, Part A, 2015, 138, 21–30 CrossRef CAS PubMed.
- N. A. Abdallah, J. Electrochem. Soc., 2020, 167, 047504 CrossRef CAS.
- Molecular Operating Environment (MOE 2019.0102), Montreal Quebec Canada, 2019.0102, http://www.chemcomp.com.
- E. A. Cameron, M. A. Maynard, C. J. Smith, T. J. Smith, N. M. Koropatkin and E. C. Martens, J. Biol. Chem., 2012, 287, 34614–34625 CrossRef CAS PubMed.
- N. M. Koropatkin, E. C. Martens, J. I. Gordon and T. J. Smith, Structure, 2008, 16, 1105–1115 CrossRef CAS PubMed.
- L. Feng, R. Fawaz, S. Hovde, F. Sheng, M. Nosrati and J. H. Geiger, Acta Crystallogr., Sect. D: Struct. Biol., 2016, 72, 641–647 CrossRef CAS PubMed.
- W. H. Zheng, C. Yan, T. Chen and D. Z. Kang, J. Physiol. Pharmacol., 2020, 71, 919–925 CAS.
- Y. Umezawa, P. Bühlmann, K. Umezawa, K. Tohda and S. Amemiya, Pure Appl. Chem., 2000, 72, 1851–2082 CrossRef CAS.
- F. Liu and H. Xu, Talanta, 2017, 162, 261–267 CrossRef CAS PubMed.
- L. A. Hussein, N. Magdy and H. Z. Yamani, Sens. Actuators, B, 2017, 247, 436–444 CrossRef CAS.
| This journal is © The Royal Society of Chemistry 2023 |

