 Open Access Article
Processing on crystal growth, structure, thermal property, and nuclear magnetic resonance of organic–inorganic hybrid perovskite type [NH3(CH2)6NH3]ZnCl4 crystal†
Ae Ran Lim *ab and
Sun Ha Kimcd
aGraduate School of Carbon Convergence Engineering, Jeonju University, Jeonju 55069, Korea
bDepartment of Science Education, Jeonju University, Jeonju 55069, Korea. E-mail: aeranlim@hanmail.net; arlim@jj.ac.kr
cKorea Basic Science Institute, Seoul Western Centre, Seoul 03759, South Korea
dDepartment of Chemistry, Kyungpook National University, Daegu 41566, South Korea
First published on 26th October 2023
Abstract
Organic–inorganic hybrid compounds have recently gained significant attention in recent years due to their diverse applications. Herein, [NH3(CH2)6NH3]ZnCl4 crystals were grown, and their triclinic structure, phase transition temperature (TC = 408 K), and high thermal stability (Td = 584 K) was determined using X-ray diffraction (XRD), differential scanning calorimetry, and thermogravimetry measurements. By analyzing the chemical in response to temperature changes, we observed that the coordination geometry around 1H and 13C were highly symmetric below TC, whereas their symmetry was lowered above TC. The change of N–H⋯Cl hydrogen bond from XRD results and the change of 14N NMR chemical shifts was due to the changes to the coordination geometry of Cl− around Zn2+ in the ZnCl4 anion. The activation energy of 1H was three times greater than that of 13C, and this result indicates that the energy transfer of 13C was easier than those of 1H. We compared the results for [NH3(CH2)nNH3]ZnCl4 (n = 6) studied here with those for n = 2, 3, 4, and 5 obtained from previous studies. The characteristics of the length of CH2 in the methylene chain are expected to be used for potential applications in the near future.
1. Introduction
The research on organic–inorganic hybrid compounds has garnered significant interest lately due to their wide range of applications and rapid advancement. The structural flexibility and optical properties of these organic–inorganic hybrid compounds are determined by organic cations,1,2 while the inorganic anions govern their thermal and mechanical properties. These materials are receiving increasing attention due to their unique ability to selectively harness the benefits of both organic and inorganic materials, creating diverse and exceptional materials.The development of ferroelastic semiconductors is hindered by the significant challenge associated with fabricating hybrid perovskites.3 Moreover, the successful incorporation of ferroelectric properties in hybrid perovskites renders them ideal for application in flexible wearable devices.4,5 Organic–inorganic hybrid compounds utilizing CH3NH3PbX3 (X = Cl, Br, or I) have demonstrated successful applications in solar cells.6–8 Nonetheless, the toxic nature of Pb in these perovskites and its susceptibility to decomposition in humid air necessitates the exploration of environmentally friendly alternatives. A class of environmentally friendly free-Pb hybrid organic–inorganic compounds, [NH3(CH2)nNH3]MX4 (n = 2, 3, 4, …; M = Co, Zn, Mn, Cd, Fe, Cu; X = Cl, Br), has emerged.9–14 These compounds are characterized by organic [NH3(CH2)nNH3] cations arranged along the longest axis, with inorganic MX4 anions positioned between them. The physical and chemical properties of the organic–inorganic hybrid perovskites depend on the characteristics of the organic cations, the geometry of the inorganic anions (metal halide ions; (MX6)2− or (MX4)2−), and reaction stoichiometry. When M is Mn, Cu, or Cd, the structure comprises alternating corner-shared octahedral (MX6)2− units with organic layers. However, in the case of M = Co or Zn, the structures consist of tetrahedral (MX4)2− units sandwiched between layers of organic cations.15–24 Recently, researches of  with different halogen ions were reported by Abdel-Aal et al.25–27 The organic and inorganic layers form infinite 0D or 2D structures, connected by N–H⋯Cl hydrogen bonds.28–31 In particular, the structural rearrangements due to changes along the length of cations are also very important factors.
One interesting hybrid compound is 1,6-hexanediammonium tetrachlorozincate (II), ([NH3(CH2)6NH3]ZnCl4), which contains a [NH3(CH2)6NH3] cation and a ZnCl4 anion, and has phase transition temperatures of 289 K, 342 K, and 385 K as measured by differential scanning calorimetry (DSC). The structure of the [NH3(CH2)6NH3]ZnCl4 crystal at room temperature is triclinic with unit cell parameters of a = 7.2816 Å, b = 10.0996 Å, c = 10.0972 Å, α = 74.368°, β = 88.046°, γ = 85.974°, and Z = 2.32 The terminal ammonium ions of the [NH3(CH2)6NH3] cation are connected by hydrogen bonds with the Cl ions (i.e., N–H⋯Cl) in the ZnCl4 anion.
The growth and structures of [NH3(CH2)nNH3]ZnCl4 (n = 2–5) single crystals along the length of cations have been previously confirmed by X-ray diffraction analyses.19,33–36 The thermal stabilities and spin–lattice relaxation times with temperature change were mainly utilized to study the physicochemical properties and structural dynamics of the single crystals.35–38 Despite the numerous applications of these compounds, there has been limited discussion regarding the thermal properties and structural dynamics attributed to variations in the methylene chain length.
In this study, organic–inorganic hybrid [NH3(CH2)6NH3]ZnCl4 single crystals replacing with eco-friendly were grown using the aqueous solution method, and their crystal structures, phase transition temperatures (TC), and thermal properties were studied. The effect of temperature on coordination geometry, which can provide valuable insights into the physical and chemical properties of compounds, was discussed based on information obtained from 1H, 13C, and 14N nuclear magnetic resonance (NMR) chemical shifts. The energy transfer was investigated by employing the spin–lattice relaxation time (T1ρ). Moreover, the interplay of N–H⋯Cl hydrogen bonds connecting the organic cation and inorganic anion was considered. The results of this study demonstrated comparability and provided explanations for research on structural dynamics of [NH3(CH2)nNH3]ZnCl4 (n = 2, 3, 4, 5, and 6) where the methylene length chain length varies as a parameter.
2. Experimental
[NH3(CH2)6NH3]ZnCl4 single crystals were grown by the slow evaporation method at 300 K after dissolving NH2(CH2)6NH2·2HCl (Aldrich, 99%) and ZnCl2 (Aldrich, 98%) in a ratio of 1![[thin space (1/6-em)]](https://www.rsc.org/images/entities/char_2009.gif) :
:![[thin space (1/6-em)]](https://www.rsc.org/images/entities/char_2009.gif) 1 in distilled water. The single crystal grown here had a size of about 7 mm × 3 mm × 2 mm and was colorless and transparent.
1 in distilled water. The single crystal grown here had a size of about 7 mm × 3 mm × 2 mm and was colorless and transparent.
The lattice constants at 250, 300, and 350 K were obtained by single-crystal X-ray diffraction (SCXRD) at the Seoul Western Center of the Korea Basic Science Institute (KBSI). Single crystal experiments were performed using a Bruker diffractometer (D8 Venture PHOTON III M14) with Mo-Kα radiation source and a nitrogen cold flow (−50 °C). Data collection was obtained using SMART APEX3 (Bruker 2016) and SAINT (Bruker, 2016) software. The structure was analyzed by full-matrix least-squares on F2 using SHELXTL.39 All hydrogen atoms were represented in geometric positions. Additionally, powder X-ray diffraction (PXRD) patterns were obtained at various temperatures using an XRD system equipped with a Mo-Kα as the same target used in SCXRD.
Differential scanning calorimetry experiments (TA, DSC 25) were performed at temperatures ranging from 193 to 573 K at a heating rate of 10 °C min−1 under N2 gas.
Thermogravimetry analysis (TGA) and differential thermal analysis (DTA) measurements were conducted from 300 to 873 K under N2 gas at a heating rate of 10 °C min−1 using a thermogravimetric analyzer (TA Instrument).
Temperature-dependences for NMR spectra and spin-lattice relaxation times (T1ρ) were measured using a 400 MHz (AVANCE III HD) solid-state NMR spectrometer (Bruker, Germany) in the same laboratory as above. The Larmor frequency for the 1H magic angle spinning (MAS) NMR experiment was 400.13 MHz, and TMS (tetramethylsilane) was used as the standard material to accurately measure the 1H NMR chemical shifts. The Larmor frequency for the 13C MAS NMR experiment was 100.619 MHz, and adamantane was used as the standard material for measuring the 13C NMR chemical shifts. Static 14N NMR chemical shifts were measured using the one-pulse method at a Larmor frequency of 28.90 MHz, and NH4NO3 was used as the reference material. Meanwhile, the spin–lattice relaxation time T1ρ values were measured using a π/2–τ pulse by a spin-lock pulse of duration τ, where the pulse width of π/2 for 1H and 13C were 4.0 and 3.6 μs, respectively. The spinning rate to minimize the sideband of the NMR signal was 10 kHz. N2 gas flow and heater current were used to adjust and maintain the desired temperature.
3. Results and discussion
3.1 Single-crystal XRD measurements
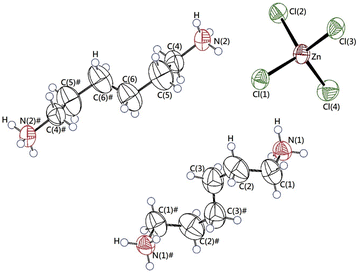
The single-crystal XRD patterns of [NH3(CH2)6NH3]ZnCl4 were obtained at 250, 300, and 350 K. The SCXRD result at three temperatures showed a triclinic system with P1 (bar) space group and the cell constants of a = 7.2844 (2) Å, b = 10.1024 (3) Å, c = 10.1051 (3) Å, α = 74.3060 (10)°, β = 85.9270 (10)°, γ = 88.0170 (10)°, and Z = 2 at 300 K. These results were in good agreement with data at 300 K reported by Mostafa and El-khiyami.32 On the other hand, the structures and lattice parameters were unchanged at 250, 300, and 350 K, as shown in Table 1, and it between 300 K and 350 K does not change to be significantly at the phase transition temperature of 340 K previously reported.32 Fig. 1 shows the structure of the [NH3(CH2)6NH3] cation and ZnCl4 anion, the atomic numbering scheme, and the thermal ellipsoids of the H atoms in the [NH3(CH2)6NH3]ZnCl4 crystal. In ZnCl4, the Zn atom is surrounded by four Cl atoms, forming a tetrahedron. Infinite chains consisting of face-shared ZnCl4 tetrahedra and four doubly bridging chloride ions link the adjacent Zn centers. This crystal is characterized by the N–H⋯Cl hydrogen bonds, connecting the cation to the anion. Bond lengths for Zn–Cl, N–C, C–C, C–H, N–H at three temperatures, are shown in Table 2. At 250 and 300 K, three N–H⋯Cl hydrogen bonds were formed, however, one N–H⋯Cl was broken at 350 K, and two N–H⋯Cl hydrogen bonds remained. The CIF files results of SCXRD for the crystal structures at 250, 300, and 350 K are shown in the ESI (1, 2, and 3†).| Temperature | 250 K | 300 K | 350 K |
| Chemical formula | C6H18N2ZnCl4 | C6H18N2ZnCl4 | C6H18N2ZnCl4 |
| Weight | 325.39 | 325.39 | 325.39 |
| Crystal system | Triclinic | Triclinic | Triclinic |
| Space group | P1 (bar) | P1 (bar) | P1 (bar) |
| a (Å) | 7.2757 (4) | 7.2844 (2) | 7.2972 (3) |
| b (Å) | 10.0165 (6) | 10.1024 (3) | 10.1542 (4) |
| c (Å) | 10.0348 (6) | 10.1051 (3) | 10.1812 (3) |
| α (°) | 75.028 (2) | 74.3060 (10) | 73.8420 (10) |
| β (°) | 86.496 (2) | 85.9270 (10) | 87.9390 (10) |
| γ (°) | 88.354 (2) | 88.0170 (10) | 85.6380 (10) |
| Z | 2 | 2 | 2 |
| V (Å3) | 705.10 (7) | 714.01 (4) | 722.41 (5) |
| Radiation type | Mo-Kα | Mo-Kα | Mo-Kα |
| Wavelength (Å) | 0.71073 | 0.71073 | 0.71073 |
| Reflections collected | 14![[thin space (1/6-em)]](https://www.rsc.org/images/entities/char_2009.gif) 848 848 |
26![[thin space (1/6-em)]](https://www.rsc.org/images/entities/char_2009.gif) 702 702 |
27![[thin space (1/6-em)]](https://www.rsc.org/images/entities/char_2009.gif) 217 217 |
| Independent reflections | 3539 (Rint = 0.0242) | 3538 (Rint = 0.0272) | 3595 (Rint = 0.0295) |
| Goodness-of-fit on F2 | 1.039 | 1.042 | 1.021 |
| Final R indices [I > 2 sigma(I)] | R1 = 0.0283, wR2 = 0.0687 | R1 = 0.0359, wR2 = 0.0964 | R1 = 0.0446, wR2 = 0.1405 |
| R indices (all data) | R1 = 0.0369, wR2 = 0.0740 | R1 = 0.0480, wR2 = 0.1046 | R1 = 0.0656, wR2 = 0.1613 |
| Temperature | 250 K | 300 K | 350 K |
|---|---|---|---|
| Zn–Cl (1) | 2.2454 (7) | 2.2795 (8) | 2.2749 (10) |
| Zn–Cl (2) | 2.2787 (6) | 2.2776 (8) | 2.2765 (11) |
| Zn–Cl (3) | 2.2828 (6) | 2.2686 (8) | 2.2449 (12) |
| Zn–Cl (4) | 2.2691 (6) | 2.2442 (9) | 2.2707 (11) |
| N (1)–C (1) | 1.480 (3) | 1.479 (4) | 1.458 (6) |
| N (2)–C (4) | 1.487 (3) | 1.467 (4) | 1.466 (6) |
| C (1)–C (2) | 1.479 (4) | 1.482 (6) | 1.365 (9) |
| C (2)–C (3) | 1.556 (4) | 1.578 (7) | 1.585 (11) |
| C (3)–C (3)# | 1.496 (6) | 1.454 (9) | 1.476 (19) |
| C (4)–C (5) | 1.507 (4) | 1.435 (6) | 1.431 (10) |
| C (5)–C (6) | 1.547 (4) | 1.584 (7) | 1.620 (12) |
| C (6)–C (6)# | 1.498 (6) | 1.465 (11) | 1.399 (15) |
| C–H | 0.980 | 0.970 | 0.970 |
| N–H | 0.900 | 0.890 | 0.890 |
| N (1)–H (1)–Cl (2) | 3.287 | ||
| N (2)–H (2)–Cl (2) | 3.479 | ||
| N (2)–H (2)–Cl (4) | 3.738 |
3.2 Phase transitions and powder XRD measurements
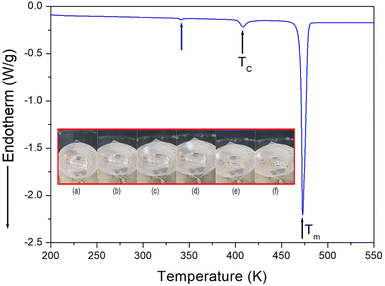
The phase transition temperature of the [NH3(CH2)6NH3]ZnCl4 crystal was investigated using a DSC experiment which involved heating the crystal from 200 K to 550 K at a rate of 10 °C min−1, with a sample size of 8.8 mg. The DSC curve, shown in Fig. 2, revealed the presence of two weak endothermic peaks at 340 K and 408 K, respectively, along with a strong endothermic peak at 473 K. The endotherm peak at 340 K was relatively small, making it challenging to accurately measure the enthalpy. However, at 408 K and 473 K, the enthalpy values of 796 J mol−1 and 21 kJ mol−1 were obtained, respectively. The temperature-induced variations in the single crystal were examined using an optical polarization microscope to accurately confirm the three peaks seen in DSC. It was observed that the crystal exhibited minimal changes in the temperature range of 300–450 K, and melting of the single crystal began at near 470 K (i.e., Tm = 470 K) as shown in the inset of Fig. 2.The temperature-dependent PXRD experiment was conducted, and the corresponding results are presented in Fig. 3, covering a range of 8–60° (2θ). The PXRD patterns below 400 K, indicated by red color, exhibited slight differences compared to those recorded at 410 K, represented by the olive color. This difference was attributed to TC (= 408 K). Notably, the PXRD results were well consistent with the DSC findings. The PXRD patterns did not exhibit any changes corresponding to the small endothermic peak near 340 K observed in the DSC analysis. Also, the triclinic structure derived from SCXRD results at 300 K and 350 K remained unchanged. And, the simulated XRD pattern based on the CIF file at 300 K is shown is represented in Fig. 3, and this result agrees well with the pattern obtained from PXRD experiment.
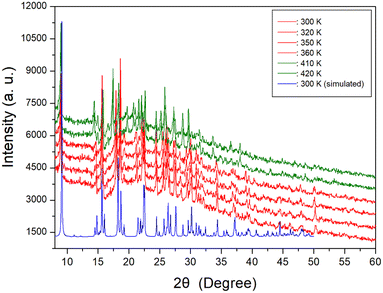 | ||
| Fig. 3 Powder X-ray diffraction (PXRD) patterns at various temperatures, and the blue color is simulated PXRD pattern at 300 K. | ||
Therefore, the phase transition temperature (TC) determined from DSC, PXRD, SCXRD, and optical polarizing microscopy experiments, was found to be 408 K. These results were not consistent with the previously reported values of 289 K, 342 K, and 385 K.32
3.3 Thermal properties
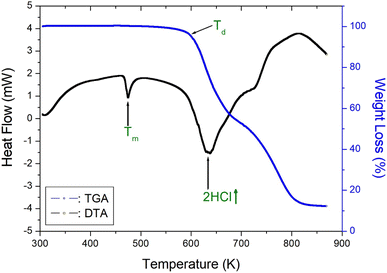
To understand the thermal characteristics, the [NH3(CH2)6NH3]ZnCl4 crystal were assessed through TGA and DTA experiments at the heating rate of 10 °C min−1 with a method similar to that of the DSC experiment. As shown in Fig. 4, the endothermic peak at 408 K in the DSC curve of Fig. 2 is very small, so there is almost no change in the TGA and DTA curves. In other words, it shows thermal stability near the phase transition temperature of 408 K. And, the DTA curve exhibited a peak around 474 K, which correlates with the melting temperature determined from the DSC and optical polarizing microscope analyses. The TGA and DTA results indicated that the crystal displayed thermal stability up to approximately 584 K, referred to as the partial thermal decomposition temperature (Td). Beyond this temperature, [NH3(CH2)6NH3]ZnCl4 experienced weight loss, and the amount of solid residue was determined using the molecular weight. The weight loss rapidly declined between 600 and 800 K, and approximately 22% weight loss occurred near 636 K due to the decomposition of 2HCl. Around 800 K, a weight loss of 90% was observed, resulting from the decomposition of NH2(CH2)6NH2·2HCl, leaving behind only the inorganic ZnCl2 anions.403.4 1H and 13C MAS NMR spectra
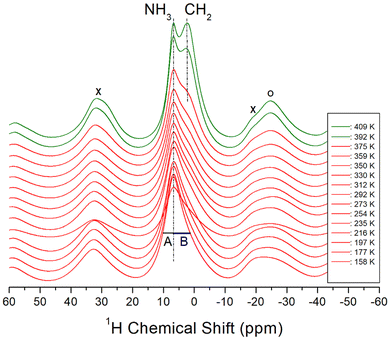
The 1H MAS NMR spectra of the [NH3(CH2)6NH3]ZnCl4 crystal were acquired in situ as a function of temperature, and the corresponding 1H chemical shifts are shown in Fig. 5. The TMS reference signal was used as the standard for 1H chemical shifts. At lower temperatures, a single resonance signal with an asymmetric shape was observed, resulting from the overlapping 1H resonance lines of NH3 and CH2 in the organic [NH3(CH2)6NH3] cations. The left (A) and right (B) sides of the resonance signal exhibited unequal half-full width at half maximum (FWHM). At 158 K, a single resonance line was detected at a chemical shift of 6.07 ppm. With increasing the temperature to 410 K, the NMR line displayed a separation into two distinct resonance lines at chemical shifts of 6.79 and 2.13 ppm for NH3 and CH2, respectively. The NH3 spinning sidebands are marked with crosses, and the sidebands for CH2 are marked with open circles in Fig. 5. Above 392 K, near TC, the 1H NMR signals for NH3 and CH2 began to separate. In addition, the narrow line width of the left signal (i.e., NH3) and the broader line width of the right signal (i.e., CH2) aligned well with the respective number of 1H in the NH3 and CH2 groups. The 1H chemical shifts for NH3 remained almost unchanged as the temperature increased, whereas those of CH2 experienced changes. These observations suggest that the surrounding environments of 1H of the NH3 changes little and that of the CH2 changes slightly.The variations of 13C chemical shifts in the MAS NMR spectra with temperature are shown in Fig. 6. The adamantane reference signal was used as the standard for the 13C chemical shifts. In the [NH3(CH2)6NH3] cation illustrated in Fig. 1, the CH2 groups positioned adjacent to the NH3 are designated as C (1) and C (1)#, while the centrally located CH2 groups are denoted as C (3) and C (3)#. The CH2 groups situated between C (1) and C (3) are labeled as C (2) and C (2)#, respectively. At 292 K, three distinct 13C NMR signals were observed; C (1) at 41.76 ppm, C (2) at 27.23 ppm, and C (3) at 25.71 ppm. As the temperature increased, the chemical shifts of C (1) remained largely unchanged, while those of C (2) and C (3) shifted positively. Near the TC temperature, C (1) was resolved into C (1)# with a different environment, and C (2) was separated into C (2)# with a different environment. No notable changes were observed in C (1), C (2), and C (3) around 340 K. And, the difference of the chemical shift between (2) and C (2)# is larger than that between C (1) and C (1)#. Separation into C (1) and C (1)# and C (2) and C (2)# above TC means that the symmetry of cations above TC is lowered.
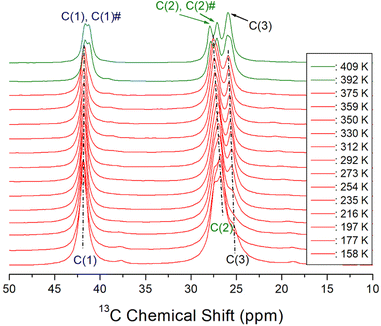 | ||
| Fig. 6 13C MAS NMR chemical shifts for C (1), C (1)#, C (2), C (2)#, and C (3) in [NH3(CH2)6NH3]ZnCl4 as a function of temperature, and the spinning rate is 10 kHz. | ||
3.5 14N static NMR spectrum
The 14N static NMR spectrum of [NH3(CH2)6NH3]ZnCl4 single crystal was obtained in the temperature range of 180–420 K (Fig. 7). The 14N chemical shift range exhibited a significantly wider span compared to the 1H chemical shift range, making it valuable for determining the surrounding environment of 14N. In this study, the external magnetic field was measured in an arbitrary direction of the single crystal. Considering the spin number of 14N as I = 1, the NMR spectrum predicts two resonance lines due to the quadrupole interaction.41 However, due to the very low Larmor frequency of 28.90 MHz for obtaining the 14N NMR spectrum, the signal acquisition was challenging. The 14N NMR chemical shifts shown in Fig. 7 disappeared above 340 K. The SCXRD results listed in Table 2 indicated the formation of three N–H⋯Cl hydrogen bonds at 250 and 300 K. However, one N–H⋯Cl at 350 K was broken, leaving two N–H⋯Cl hydrogen bonds intact. This observation aligned with the disappearance of the 14N NMR signal above 340 K. The continuous change in the 14N chemical shifts with increasing temperature indicated a variation in the local environment and coordination geometry of the 14N atoms.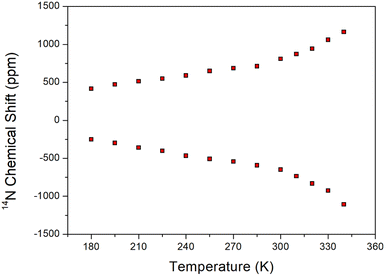 | ||
| Fig. 7 Static 14N NMR chemical shifts of [NH3(CH2)6NH3]ZnCl4 single crystal as a function of temperature. | ||
3.6 1H and 13C spin–lattice relaxation times
The spin–lattice relaxation time T1ρ for 1H and 13C was determined by acquiring an FID after applying the spin-lock pulse. The intensity changes of the measured magnetization are described by the following equation:42| S(t)/S(0) = exp(−τ/T1ρ), | (1) |
| (T1ρ)−1 = R[4f1(ω1) + f2(ωC − ωH) + 3f3(ωC) + 6f4(ωC + ωH) + 6f5(ωH)], f1 = τC/[1 + ω12τC2], f2 = τC/[1 + (ωC − ωH)2τC2], f3 = τC/[1 + ωC2τC2], f4 = τC/[1 + (ωC + ωH)2τC2], f5 = τC/[1 + ωH2τC2], | (2) |
| τC = τC (0) exp(−Ea/kBT) | (3) |
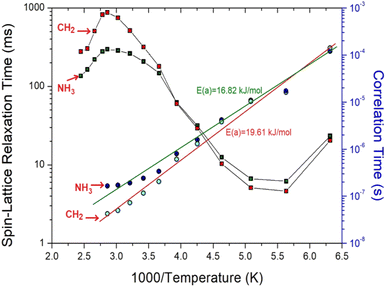
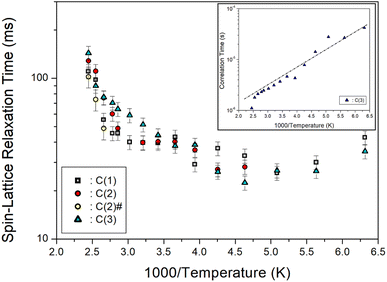
Furthermore, the T1ρ values of C (1), C (2), C (2)#, and C (3) for 13C in [NH3(CH2)6NH3]ZnCl4 were measured, and their results are represented in Fig. 9 as a function of the 1000/temperature. The T1ρ values for 13C of all three types kinds exhibited a slight decrease as the temperature rose and showed a slow increase at temperatures above 216 K. Notably, the T1ρ values of C (1), C (2), C (2)#, and C (3) demonstrated trends similar to each other. Regarding the T1ρ value of 1H, C (3) exhibits a minimum value of 22 ms, and their 13C T1ρ patterns underwent active molecular motion. The logarithmic plot of the τC versus 1000/T for 13C is shown as an inset in Fig. 9. The slope of the dotted line in the figure yielded Ea = 6.56 ± 0.63 kJ mol−1, and the values for C (1), C (2), and C (2)# were nearly identical within the margin of error.
3.7 [NH3(CH2)nNH3]ZnCl4 (n = 2, 3, 4, 5, and 6) crystals
We then conducted a comparison between our study on [NH3(CH2)nNH3]ZnCl4 (n = 6) and previous studies on n = 2, 3, 4, and 5.35–38 The structures, space groups, and lattice constants of [NH3(CH2)nNH3]ZnCl4 (n = 2, 3, 4, 5, and 6) crystals were shown in Table 3. Correspondingly, the crystal structure was found to be monoclinic for odd values of n, triclinic for even values of n, and orthorhombic for n = 2. By analyzing the physicochemical properties of these organic–inorganic compounds, we examined the impact of the methylene chain length. With an increase in the length of the methylene chain, the thermal stability is enhanced, and it is related to intermolecular forces. This trend is clearly illustrated in Fig. 10, where the results showed an increase to 534, 549, 559, 581, and 584 K for n = 2, 3, 4, 5, and 6, respectively. The changes of Td can be considered as electronic configuration; the 3d electron of the M shell is filled, and the valence electron is 4s2.| n | 2 | 3 | 4 | 5 | 6 |
|---|---|---|---|---|---|
| Structure | Orthorhombic | Monoclinic | Triclinic | Monoclinic | Triclinic |
| Space group | P212121 | P21/n | P1 (bar) | C2/c | P1 (bar) |
![[thin space (1/6-em)]](https://www.rsc.org/images/entities/char_2009.gif) |
|||||
| Lattice constant | |||||
| a (Å) | 8.832 | 10.670 | 7.2839 | 21.4175 | 7.2844 |
| b (Å) | 9.811 | 10.576 | 8.1354 | 7.3574 | 10.1024 |
| c (Å) | 11.089 | 10.755 | 10.4592 | 19.1079 | 10.1051 |
| α (°) | 77.6527 | 74.3060 | |||
| β (°) | 118.477 | 80.3358 | 120.5190 | 85.9270 | |
| γ (°) | 82.8355 | 88.0170 | |||
| Z | 4 | 4 | 2 | 8 | 2 |
| Ref. | 33 | 31 and 34 | 35 | 36 | 32, present |
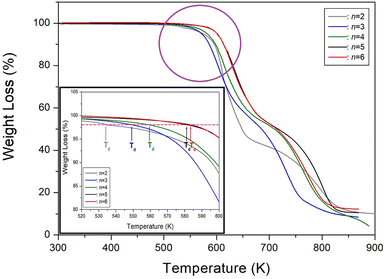 | ||
| Fig. 10 Thermogravimetry analysis (TGA) curves of [NH3(CH2)nNH3]ZnCl4 (n = 2, 3, 4, 5, and 6) according to the methylene chain length. | ||
On another note, as n increased, the 1H T1ρ below 300 K became shorter, while the behavior of T1ρ above 300 K varied, as shown in Fig. 11. Similarly, Fig. 12 illustrates the overall temperature-dependent behavior of 13C T1ρ. The substantial difference between 13C T1ρ (10 times less) and 1H T1ρ indicates that energy transfer for 13C is more efficient. However, when n is 2, both 1H and 13C T1ρ displayed different characteristics compared to when n = 3, 4, 5, and 6. Furthermore, the length of the chain (i.e., n) did not distinctly affect the temperature dependence of 1H and 13C T1ρ, but it increased the temperature dependence of Td.
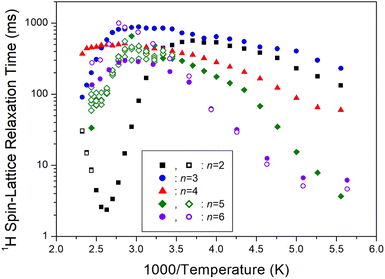 | ||
| Fig. 11 1H spin–lattice relaxation times T1ρ of [NH3(CH2)nNH3]ZnCl4 (n = 2, 3, 4, 5, and 6) for various methylene chain lengths as a function of 1000/temperature. | ||
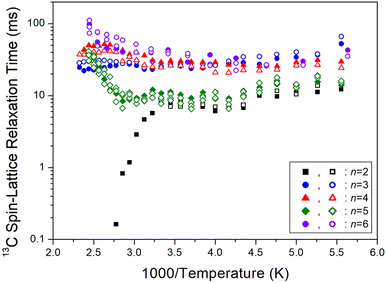 | ||
| Fig. 12 13C spin–lattice relaxation times T1ρ of [NH3(CH2)nNH3]ZnCl4 (n = 2, 3, 4, 5, and 6) for different methylene chain lengths as a function of 1000/temperature. | ||
4. Conclusion
Studying the physical properties of [NH3(CH2)6NH3]ZnCl4 crystals is essential for their practical application. In this study, we successfully grew these crystals with triclinic structures. Through comprehensive examinations utilizing DSC, SCXRD, and PXRD, we established that the phase transition temperature of these crystals occurred at 408 K. Remarkably, this phase transition temperature was different from those observed in other groups, indicating that slight differences in crystal growth conditions may be the underlying cause.Additionally, exceptionally high thermal stability was observed, with the crystals exhibiting remarkable stable up to approximately 584 K. The NMR analyses of the [NH3(CH2)6NH3]ZnCl4 crystal showed that the chemical shifts caused by the local field surrounding 1H, 13C, and 14N of the cation and anion as the temperature increases, and the surrounding environment of their atoms also changes. Based on the temperature-dependent chemical, it was found that the coordination geometry around 1H and 13C exhibited high symmetry below TC, whereas it showed low symmetry above TC. The structural analysis using SCXRD revealed no changes in the structure below 350 K. However, at 250 and 300 K, three N–H⋯Cl hydrogen bonds were identified. At 350 K, one N–H⋯Cl hydrogen broke, leaving two intact. This finding appears to be connected to the significant change observed in the 14N chemical shifts. The variations in the N–H⋯Cl hydrogen bond arises from alterations in the coordination geometry of Cl− around Zn2+ in the ZnCl4 anion. Notably, the activation energy of 1H was three times higher than that of 13C, suggesting that the energy transfer of 13C is smaller than that of 1H.
As a result, the effect of cation length can be attributed to an increase in the decomposition temperature Td by the intermolecular forces. These findings suggest that the characteristics of the CH2 chain length hold promise for potential future applications.
Author contributions
A. R. Lim performed X-ray experiments, and wrote the manuscript. S. H. Kim measured NMR experiments.Conflicts of interest
There are no conflicts to declare.Acknowledgements
This work was supported by the national Research Foundation of Korea (NRF) grant funded by the Korea government (MSIT) (2023R1A2C2006333). This research was also supported by the Basic Science Research Program through the National Research Foundation of Korea (NRF), funded by the Ministry of Education, Science, and Technology (2016R1A6A1A03012069).References
- W. Zang and R.-G. Xiong, Chem. Rev., 2012, 112, 1163 CrossRef PubMed.
- A. R. Lim and S. H. Kim, ACS Omega, 2021, 6, 27568 CrossRef CAS PubMed.
- C. Su, M. Lun, Y. Chen, Y. Zhou, Z. Zhang, M. Chen, P. Huang, P. D. Fu and Y. Zhang, CCS Chem., 2022, 4, 2009 CrossRef CAS.
- Y. Xie, Y. Ai, Y.-L. Zeng, W.-H. He, X.-Q. Huang, D.-W. Fu, J.-X. Gao, X.-G. Chen and Y.-Y. Tang, J. Am. Chem. Soc., 2020, 142, 12486 CrossRef CAS PubMed.
- D.-W. Fu, J.-X. Gao, W.-H. He, X.-Q. Huang, Y.-H. Liu and Y. Ai, Angew. Chem., Int. Ed., 2020, 59, 17477 CrossRef CAS PubMed.
- S. K. Abdel-Aal, A. S. Abdel-Rahman, G. G. Kocher-Oberlehner, A. Ionov and R. Mozhchil, Acta Crystallogr., Sect. A: Found. Adv., 2017, 70, C1116 Search PubMed.
- Y. Liu, L. Collins, R. Proksch, S. Kim, B. R. Watson, B. Doughty, T. R. Calhoun, M. Ahmadi, A. V. levlev, S. Jesse, S. T. Retterer, A. Belianinov, K. Xiao, J. Huang, B. G. Sumpter, S. V. Kalinin, B. Hu and O. S. Ovchinnikova, Nat. Mater., 2018, 17, 1013 CrossRef CAS PubMed.
- J. Lee, W. Lee, K. Kang, T. Lee and S. K. Lee, Chem. Mater., 2021, 33, 370 CrossRef CAS.
- C. Sourisseau, G. Lucazeau and A. J. Dianoux, J. Phys., 1983, 44, 967 CrossRef CAS.
- K. Chhor, J. F. Bocquet and C. Pommier, J. Chem. Thermodyn., 1985, 17, 379 CrossRef CAS.
- V. V. Eremenko, V. I. Fomin and V. S. Kurnosov, Phys. B, 1994, 194–196, 187 CrossRef CAS.
- J.-C. Bissey, N. Filloleau, N.-B. Chanh, R. Berger and S. Flandrois, Solid State Commun., 1998, 106, 385 CrossRef CAS.
- M. M. Bogdan, M. I. Kobets and E. N. Khats'ko, Low Temp. Phys., 1999, 25, 192 CrossRef CAS.
- S. J. Lee, M. Y. Choi and A. R. Lim, ACS Omega, 2021, 6, 15392 CrossRef CAS PubMed.
- N. Narita and I. Yamada, J. Phys. Soc. Jpn., 1996, 65, 4054 CrossRef CAS.
- D. B. Mitzi, K. Chondroudis and C. R. Kagan, IBM J. Res. Dev., 2001, 45, 29 CAS.
- H. Manaka, I. Yamada and T. Goto, J. Phys. Soc. Jpn., 2002, 71, 2822 CrossRef CAS.
- Y. Wei, P. Audebert, L. Galmiche, J. S. Lauret and E. Deleporte, Materials, 2014, 7, 4789 CrossRef PubMed.
- D. B. Mitzi, J. Chem. Soc., Dalton Trans., 2001, 1, 1 RSC.
- S. Ahmad, C. Hanmandlu, P. K. Kanaujia and G. Vijaya Prakash, Opt. Mater. Express, 2014, 4, 1313 CrossRef CAS.
- I. Saikumar, S. Ahmad, J. J. Baumberg and G. Vijaya Prakash, Scr. Mater., 2012, 67, 834 CrossRef CAS.
- K. Pradeesh, G. S. Yadav, M. Singh and G. Vijaya Prakash, Mater. Chem. Phys., 2010, 124, 44 CrossRef CAS.
- K. Pradeesh, J. Baumberg and G. Vijaya Prakash, Appl. Phys. Lett., 2009, 95, 173305 CrossRef.
- S. K. Abdel-Aal and A. S. Abdel-Rahman, J. Cryst. Growth, 2017, 457, 282 CrossRef CAS.
- S. K. Abdel-Aal and A. Ouasri, J. Mol. Struct., 2022, 1251, 131997 CrossRef CAS.
- S. K. Abdel-Aal, M. F. Kandeel, A. F. El-Sherif and A. S. Abdel-Rahman, Phys. Status Solidi A, 2021, 218, 2100136 Search PubMed.
- S. K. Abdel-Aal, A. S. Abdel-Rahman, W. M. Gamal, M. Abdel-Kader, H. S. Ayoub, A. F. El-Sherif, M. F. Kandeel, S. Bozhko, E. E. Yakimov and E. B. Yakimov, Acta Crystallogr., Sect. B: Struct. Sci., Cryst. Eng. Mater., 2019, 75, 880 CrossRef CAS PubMed.
- S. K. Abdel-Aal, G. Kocher-Oberlehner, A. Ionov and R. N. Mozhchil, Appl. Phys. A, 2017, 123, 531 CrossRef.
- W. Liu, J. Xing, J. Zhao, X. Wen, K. Wang, P. Lu and Q. Xiong, Adv. Opt. Mater., 2017, 5, 1601045 CrossRef.
- J.-C. Bissey, N. Filloleau, N.-B. Chanh, R. Berger and S. Flandrois, Solid State Commun., 1998, 106, 385 CrossRef CAS.
- A. R. Lim, S. H. Kim and Y. L. Joo, Sci. Rep., 2021, 11, 8408 CrossRef CAS PubMed.
- M. F. Mostafa and S. S. El-khiyami, J. Solid State Chem., 2014, 209, 82 CrossRef CAS.
- W. T. A. Harrison, Acta Crystallogr., Sect. E: Struct. Rep. Online, 2005, 61, m1951–m1952 CrossRef CAS.
- A. Kallel, J. Fail, H. Fuess and A. Daoud, Acta Crystallogr., Sect. B: Struct. Crystallogr. Cryst. Chem., 1980, 36, 2788 CrossRef.
- A. R. Lim, RSC Adv., 2021, 11, 37824 RSC.
- A. R. Lim and J. Cho, Sci. Rep., 2022, 12, 16901 CrossRef CAS PubMed.
- A. R. Lim, ACS Omega, 2020, 5, 31417 CrossRef CAS PubMed.
- A. R. Lim, S. H. Kim and Y. L. Joo, Sci. Rep., 2021, 11, 8408 CrossRef CAS PubMed.
- SHELXTL v6.10, Bruker AXS, Inc., Madison, Wisconsin, USA, 2000 Search PubMed.
- A. R. Lim and S. H. Kim, ACS Omega, 2021, 6, 27568 CrossRef CAS PubMed.
- A. Abragam, The Principles of Nuclear Magnetism, Oxford University press, 1961 Search PubMed.
- J. L. Koenig, Spectroscopy of Polymers, Elsevier, 1999 Search PubMed.
- N. Bloembergen, E. M. Purcell and R. V. Pound, Phys. Rev., 1948, 73, 679 CrossRef CAS.
- R. K. Harris, Nuclear Magnetic Resonance Spectroscopy, Pitman Pub, 1983 Search PubMed.
Footnote |
| † Electronic supplementary information (ESI) available. CCDC 2278866, 2302890 and 2302891. See DOI: https://doi.org/10.1039/d3ra05752f |
| This journal is © The Royal Society of Chemistry 2023 |

