 Open Access Article
Photocatalytic performance of biochar-modified TiO2 (C/TiO2) for ammonia–nitrogen removal†
Jiawei Wang a,
Guoqiao Wanga,
Tian Yua,
Nengjie Dinga,
Meicheng Wangb and
Yao Chen
 *a
*a
aCollege of Architecture and Environment, Sichuan University, Chengdu 610065, China. E-mail: chenyao@scu.edu.cn; Fax: +86-28-8540-5613; Tel: +86-28-8540-3016
bChina Construction Third Engineering Bureau Group Co., Ltd, Wuhan 430000, China
First published on 14th August 2023
Abstract
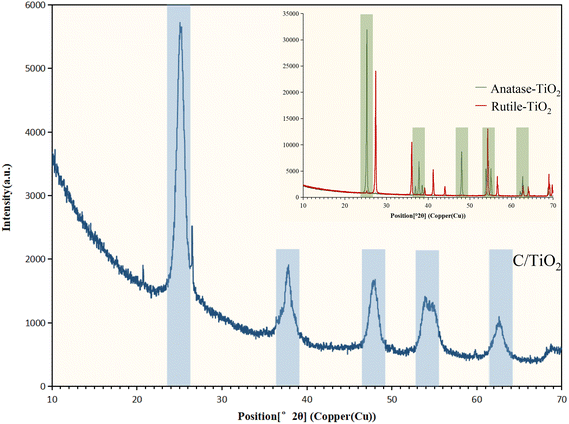
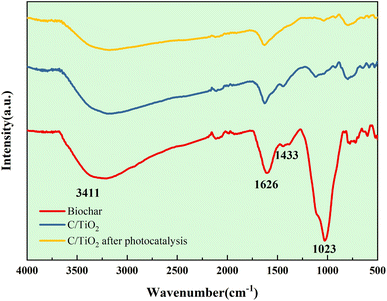
Biochar-modified TiO2 (C/TiO2) was prepared by a sol–gel method in this study to improve the photocatalytic capacity for ammonia–nitrogen (NH3–N) removal from aqueous solutions. The results showed that biochar was successfully modified on TiO2 and helped improve its photocatalytic performance for pollutant degradation. The removal capacity of ammonia–nitrogen on the synthesized photocatalyst performed well at pH 10 with 1 g L−1 C/TiO2 under both 60 (12.25 mg g−1) and 120 min (16.31 mg g−1) irradiation (xenon lamp, AM1.5, 25 A). Characterization of C/TiO2 through scanning electron microscopy-energy dispersive spectroscopy (SEM-EDS), Brunauer–Emmett–Teller (BET), X-ray diffraction (XRD), X-ray photoelectron spectroscopy (XPS), and Fourier-transform infrared spectrometry (FT-IR) analyses showed the successful introduction of biochar on TiO2. SEM-EDS and BET analyses displayed that C/TiO2 had a larger surface area and more pores than the raw materials. XRD spectroscopy illustrated that C/TiO2 had typical characteristic peaks of anatase-TiO2 and presented a good photocatalytic degradation performance. It was confirmed from XPS and FT-IR analyses that –COOH groups were present in C/TiO2 and originated from biochar modification, and these enhanced the photocatalytic performance. Through radical quenching experiments, it was found that superoxide radicals (˙O2−) played a dominant role in NH3–N photocatalytic reactions with hydroxyl radicals (˙OH) and valence band holes (h+) playing a synergistic role. N2 was the main degradation product after 6 h NH3–N photocatalytic degradation, which was much larger than NO3−/NO2− (both almost undetected) and NH3 (ca. 2 times lower than N2). The new composite C/TiO2 has potential for ammonia–nitrogen degradation in wastewater treatment and favorable for treating sewage sludge.
1. Introduction
In recent years, water pollution has become and increasing concern attracting widespread attention. Population growth and industrial development have led to a range of serious environmental problems, including pollution from ever-increasing wastewater discharges. In 2020, 984-thousand tons of NH3–N was discharged in China, which came from industrial, agricultural, and domestic wastewaters. Among this, more than 70% of NH3–N originated from domestic wastewater (707-thousand tons).1 An excess of NH3–N in water can have detrimental consequences, including causing algal bloom, red tide, and the reproduction of algae, which can indirectly harm peoples' health.2,3 It is thus essential to treat NH3–N-contaminated water appropriately.Blow-off, adsorption, and chemical precipitation are some common treatment methods for treating such waters, especially for low-concentration NH3–N polluted wastewaters. However, there are some limitations to these methods. For example, free NH3 can lead to air pollution, which is a health risk to people.4 Adsorption is a reversible process, which can thus limit its application because of both efficiency and cost concerns.5,6 Taking the deficiencies of traditional methods into consideration, it is crucial to explore new technologies.7 Effectively changing NH3–N into innocuous nitrogen is regarded by many as a perfect way to treat NH3–N polluted wastewater.
Photocatalytic methods involve a newly developed advanced oxidation process, and have been proved to be the most promising technology nowadays due to their high efficiency, low toxicity, and environmental friendliness.8,9 Semiconductor powders are widely used as photocatalysts.10 Specifically, TiO2 has notable advantages, including stable chemical properties, high photocatalytic activity, nontoxicity, strong oxidizing ability, and low cost.11,12 It is the most used conventional photocatalyst and has shown good achievements in treating NH3–N pollutants in water.7 There are some research reports confirming that NH3–N can be removed efficiently by TiO2 photocatalysts from aqueous solutions.4,13 TiO2 has three main crystalline phases: anatase, rutile, and brookite. Among these, anatase TiO2 shows the most prominent photocatalytic activity.14 However, it still has some drawbacks. TiO2 is limited by its large bandgap (Eg > 3.2 eV); thus, it can only be excited by about 7% energy of the solar light. Moreover, it is also limited by fast electron–hole recombination.15,16 Thus, it is essential to overcome these difficulties to facilitate the use of TiO2 as per its potential.
Researchers have devoted effort to modifying TiO2, for instance by ion doping, semiconductor composite modification, noble metal deposition, etc. to enhance the performance of photocatalysts. Non-metal anion doping has been demonstrated to be an effective way to improve the photoactivity, with C-doping the most common one reported. Compared to traditional TiO2, carbon-doped TiO2 has a much narrower bandgap, which extends its photoresponse to visible light for enhancement of its photocatalytic activity and inhibits the generation of electron–hole pairs.10,17,18
Recently, various allotropes of carbon materials have been adopted to modify TiO2. Biochar is a carbonaceous material with a high surface area, porous structure, low cost, and good sustainability.19,20 There is a large amount of municipal sewage sludge generated as a by-product of wastewater treatment plants, which deserves urgent attention. The beneficial utilization of those solid wastes is an important and advanced way to solve environmental issues compared to traditional methods for its disposal, like incineration, landfill, etc. Thus, transforming sewage sludge into biochar was attractive and feasible.21 Biochar provides a versatile and efficient platform for the synthesis of functionalized carbon materials. Compared to conventional activated carbon, biochar performs much better in TiO2 modification due to its greater number of inner elements, such as N, S, and more abundant surface functional groups like carbonyl and carboxyl groups.
In our study, the feasibility of biochar-modified TiO2 for the photocatalytic decomposition of NH3–N in wastewater was evaluated. Dehydrated sewage sludge-based biochar was used to prepare a C/TiO2 composite photocatalyst through a sol–gel method. The removal capacity of NH3–N was studied under different operations. SEM-EDS, BET, XRD, XPS, and FT-IR characterizations of the photocatalysts were performed and discussed in detail for better understanding the performance of the biochar-modified TiO2 for NH3–N removal. It was hoped it would achieve a combination of adsorption and photocatalytic activity for NH3–N treatment, considering that various elements in biochar have integrated effects on photocatalytic reactions compared to a single element material. Moreover, Li Zhang et al. proved that with the help of adsorptive biochar, pollutants could easily gather around the photocatalysts and be efficiently removed by the accelerated photocatalytic reactions.22 It was expected that this would be helpful for the innovative modification of titanium dioxide for use as a photocatalyst to realize resource utilization through NH3–N degradation.
2. Materials and methods
2.1 Preparation of C/TiO2 photocatalyst
Dehydrated sewage sludge from a local municipal wastewater treatment plant (WWTP) was collected as the raw material to prepare the biochar, as described in our previous work, for further utilization.23,24First, 20 mL ethanol and 7.2 mL butyl titanate were mixed in a container and shaken for 0.5 h (450 rpm). Hydrochloric acid was then added into the solution and stirred together for 0.5 h in order to maintain an acidic condition. Next, 0.2 g biochar powder was added to the above solution and stirred (450 rpm) for another 0.5 h to ensure a thorough mixing. Finally, 5.6 mL deionized water and 4.4 mL ethanol were added to the solution and kept stirring until gel formation.
After achievement of the wet gel, it was sealed for 24 h and then put into an oven (105 °C) for 12 h drying. The xerogel was subsequently ground into powder, and then calcined in a tubular furnace at 500 °C (heating rate: 2 °C min−1) for 4 h in a nitrogen atmosphere. After that, the manufactured product was taken out to cool down to room temperature. The product was washed by deionized water several times and dried to obtain the final compound, named as C/TiO2, with a TiO2 and biochar composition.23
2.2 Experiments
Ammonium chloride (NH4Cl) was dissolved in deionized water to prepare NH3–N bulk solution. As illuminated in Fig. S1 (ESI†), a high-pressure xenon lamp (PL-XQ 500 W) was used as the light source. The details of the xenon lamp are provided in the ESI (Fig. S1†). Here, 100 mL NH3–N solution (50 mg L−1) and a certain amount of the composed photocatalyst were mixed in a 200 mL sealed beaker with magnetic stirring (450 rpm). An outer circulation cooling water system was applied to maintain the reaction system under room temperature. Fig. S2† shows a schematic diagram of the reaction system reaction (see the ESI†). At designed time intervals, samples were taken out and filtered, and the NH3–N concentration of the supernatant was analyzed via a standard method. Excessive doses of dilute sulfuric acid and phenolphthalein solution were provided for tail gas treatment, and the mass of ammonia was determined by the weight deviation after exhaust adsorption.Quenching agents were added into a series 100 mL NH3–N (50 mg L−1) solutions with 1 g L−1 C/TiO2 under a high-pressure xenon lamp (AM1.5, 25 A) for 1 h stirring (450 rpm). Samples were taken out and filtered every 20 min, and the concentrations of various nitrogen contents in the supernatant were determined in accordance with standard methods (see the ESI†).
NH3–N removal capacity was calculated by the following equation.
| X1 = V × (C0 − C1)/M | (1) |
Determination of the NH3–N concentration was done in accordance with the standard method HJ 535-2009 (Nessler's reagent spectrophotometry). The standard method HJ/T346-2007 (water quality – determination of nitrate–nitrogen – ultraviolet spectrophotometry method) and GB 7493-87 (water quality – determination of nitrogen(nitrite) – spectrophotometric method) were used to determine the concentration of NO3− and NO2−, respectively. A PHS-4 pH meter (Shanghai INESA Scientific Instrument Co., Ltd) was used to measure the pH values for the samples.
The commercial titanium dioxide (anatase-TiO2) adopted in this work was analytical grade powder (≥99.0%) and was purchased from Kelong Chemical Reagent Co., Ltd. All other chemicals and reagents used to prepare the photocatalysts were analytical grade and provided by Kelong Chemical Reagent Co., Ltd, as well. Propan-2-ol (IPA) and potassium iodide (KI) were applied as quenching agents and both were analytical grade and obtained from Kelong Chemical Reagent Co., Ltd. Nitro blue tetrazolium (NBT) was applied as a quenching agent and was purchased from Shanghai Aladdin Biochemical Technology Co., Ltd.
All experiments were carried out twice under identical conditions, and the results were collected as the mean values.
2.3 Characterization
SEM-EDS was used to determine the surface morphology of the raw materials and the composed photocatalyst. This was completed at the Analytical and Testing Center of Sichuan University using a JSM-7500F field emission scanning electron microscope (JEOL): acceleration voltage of 0.1 kV to 30 kV, resolution of 1.0 nm (15 kV), 1.4 nm (1 kV), and magnification of ×25–×8![[thin space (1/6-em)]](https://www.rsc.org/images/entities/char_2009.gif) 00
00![[thin space (1/6-em)]](https://www.rsc.org/images/entities/char_2009.gif) 000. The BET surface area and pore volume of the samples were measured using a TriStar II 3020 Version 3.02 (Micromeritics Instrument Corporation).
000. The BET surface area and pore volume of the samples were measured using a TriStar II 3020 Version 3.02 (Micromeritics Instrument Corporation).
X-Ray diffraction spectroscopy (XRD, EMPYREAN, PANalytical B.V.) was used for phase identification with Cu Kα radiation at 1.54 Å (X-ray wavelength) from 10° to 70° (2θ). The surface element properties were analyzed by X-ray photoelectron spectroscopy (XPS, XSAM800, Kratos) using an Al Kα source. The functional groups of the materials were detected by Fourier-transform infrared spectroscopy (FT-IR, FNicolet 6700, Thermo Elemental) within the range 4000–400 cm−1.
3. Results and discussion
3.1 NH3–N removal
The photocatalytic performance of the biochar, commercial TiO2, and the composed C/TiO2 were investigated by adding 1 g L−1 of biochar, TiO2, or C/TiO2 into a series of 100 mL of 50 mg L−1 NH3–N solutions under the dark and photocatalytic conditions, respectively. The dark groups were carried out under constant stirring (450 rpm) without lighting for 1 and 2 h, while the photocatalysis groups were analyzed with fully mixing under xenon lighting (AM1.5, 25 A) for 1 and 2 h. Also, control group 1 was a blank solution without any adsorbent under dark condition and control group 2 was a blank sample without any photocatalyst under irradiation.As shown in Fig. 1, the removal capacity of NH3–N was much different under the varied reaction conditions. Under the dark condition, there was insignificant NH3–N removal by all the products (biochar, commercial TiO2, and C/TiO2), namely lower than 5 mg g−1 for 1 h and 7 mg g−1 for 2 h. Compared with the results for control group 1, none of them presented adsorptive capacity for NH3–N removal. The slight decrease in NH3–N concentration under the dark conditions was mainly due to the solution stirring and blowing off the ammonia during the experiments for the control groups. Febio Dalanta et al. found there was approximately no NH3–N adsorption on TiO2,25 which was the same as our experimental results. While under irradiation, compared to control group 2, both the commercial TiO2 and C/TiO2 photocatalysts performed well in NH3–N degradation, with a similar high removal capacity. The NH3–N removal capacity was ca. 12 mg g−1 for 1 h and 16 mg g−1 for 2 h on C/TiO2, respectively, which were slightly higher than on commercial TiO2. C/TiO2 had a much better NH3–N removal capacity almost 3 times higher than the one in the dark conditions. It was demonstrated that with external illumination, the degradation ability of C/TiO2 on NH3–N was effectively enhanced by photocatalysis. In terms of the preparation and beneficial utilization of waste, the biochar-modified TiO2 has great potential for use in ammonia–nitrogen wastewater treatment.
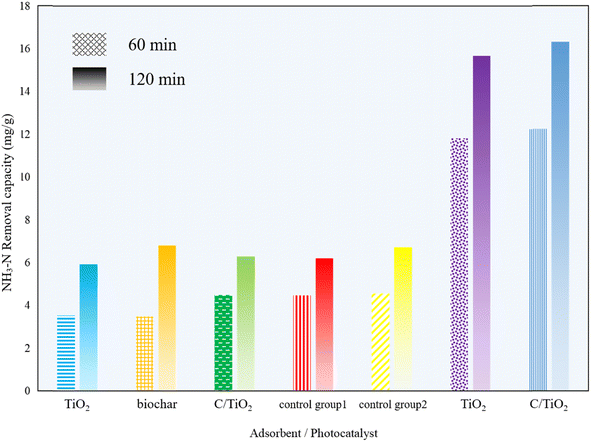 | ||
| Fig. 1 NH3–N removal capacity under different reaction condition times (AM1.5, 25 A, 1 g L−1 of photocatalyst, pH 10.0, C0 = 50 mg L−1). | ||
Taking the application of the composite photocatalysts into consideration, natural waters from Jiang'an River and Mingyuan Lake in our campus were collected and tested (Experiment details are provided in the ESI†). The NH3–N removal capacity was ca. 6.58 mg g−1 for the Jiang'an River sample and 7.89 mg g−1 for the Mingyuan Lake sample on C/TiO2, respectively, which were similar to the ones achieved by the commercial TiO2 (7.03 mg g−1 for Jiang'an River water and 7.52 mg g−1 for Mingyuan Lake water, respectively). Actually, the NH3–N removal capacities on C/TiO2 and TiO2 were relatively lower than the one for the synthetized NH3–N wastewater in the lab due to the complexity of the natural water bodies. The results showed the great potential for practical use of C/TiO2 for NH3–N removal from natural water resources.
Table 1 shows the removal capacity of NH3–N on different photocatalysts in similar studies. As listed in Table 1, the photocatalytic effect C/TiO2 for NH3–N removal was superior to most products. Specifically, the NH3–N removal capacity on C/TiO2 was 16.31 mg g−1 in our study and was obviously higher than the other photocatalysts under the same irradiation time (2 h). Compared to B–SiO2@TiO2 (100![[thin space (1/6-em)]](https://www.rsc.org/images/entities/char_2009.gif) :
:![[thin space (1/6-em)]](https://www.rsc.org/images/entities/char_2009.gif) 5) at 150 min and Cu/TiO2 at 180 min, C/TiO2 had an approximate efficiency for NH3–N removal in a relatively short reaction time (120 min). In comparison with other photocatalysts, C/TiO2 has prominent advantages due to its simple operation, waste sustainable utilization, easy availability, as well as high efficiency for NH3–N degradation.
5) at 150 min and Cu/TiO2 at 180 min, C/TiO2 had an approximate efficiency for NH3–N removal in a relatively short reaction time (120 min). In comparison with other photocatalysts, C/TiO2 has prominent advantages due to its simple operation, waste sustainable utilization, easy availability, as well as high efficiency for NH3–N degradation.
| Photocatalyst | Light source | Light power (W) | pH | Irradiation time (min) | Removal capacity (mg g−1) | Reference |
|---|---|---|---|---|---|---|
| C/TiO2 | Simulated sunlight | 500 | 10.0 | 120 | 16.31 | This study |
| TiO2/MPVA-Alg | UV | 250 | 10.5 | 120 | 1.575 | Zendehzaban et al.26 |
| TiO2/perlite | UV | 125 | 11.0 | 120 | 14.01 | Shavisi et al.27 |
B–SSiO2@TiO2 (100![[thin space (1/6-em)]](https://www.rsc.org/images/entities/char_2009.gif) : :![[thin space (1/6-em)]](https://www.rsc.org/images/entities/char_2009.gif) 5) 5) |
Visible light | 100 | 8.0 | 150 | 18.36 | Zhou et al.28 |
| Cu/TiO2 | Sunlight | — | — | 180 | 17.50 | Wang et al.29 |
3.2 Photocatalysis
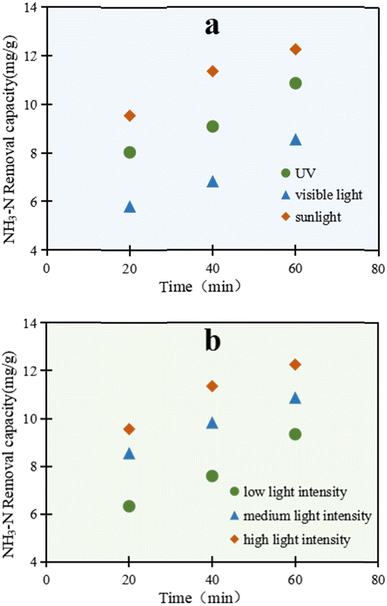
As shown in Fig. 2a, there was a remarkable light-utilization ability of C/TiO2 for NH3–N degradation. The removal ability through NH3–N degradation by C/TiO2 under the three kinds of light sources increased with prolonging the lighting time, and presented different performances. The photocatalytic reaction excited under simulated sunlight displayed the most prominent capacity compared with the other two light sources. After 60 min, the NH3–N removal capacity under simulated sunlight was up to 12.25 mg g−1, which was higher than both that under UV and visible light.
As is widely known, TiO2 can be efficiently excited by the ultraviolet part of sunlight, while an absorption band change can be subsequently found in the composed material.30–33 Here, C/TiO2 could effectively absorb ultraviolet light, and also efficiently utilize the relatively long wavelength of visible light. Sunlight represents the sum energy of visible light and ultraviolet light, which made the total light energy absorbed by C/TiO2 greater than that for ultraviolet light, and led to the improved light-utilization efficiency and removal capacity of NH3–N. Thus, C/TiO2 has advantages in light utilization and photocatalysis compared to the common TiO2.
As illuminated in Fig. 2b, the reaction was conducted under a xenon lamp (AM1.5), while the luminous power was adjusted within 15–25 A (300–500 W, over a light intensity range of 50–100 mW cm−2). With the increment in light power, the NH3–N treatment efficiency by C/TiO2 also increased. After 60 min, the NH3–N removal capacities under the low, medium and high light intensity power were 9.34, 10.87, and 12.25 mg g−1, respectively. With the enhancement of the light intensity, more effective photons were generated and the light penetration ability was improved too. Meanwhile, the probability of electron transition was strengthened, with a higher generation of active free radicals on the C/TiO2 surface. Consequently, the photocatalytic degradation capacity for NH3–N increased. Moreover, the increased photons made more NH3–N molecules absorb light energy and become activated, which was conductive to the photocatalytic reactions. However, with further increasing the light intensity, the NH3–N photodegradation by C/TiO2 became stable and showed insignificant further change due to the limitation of the light quantum efficiency. Here, the probabilities of collision between activated electrons and holes were greatly enhanced and consequently led to annihilation under strong light irradiation; however, when the amount of C/TiO2 was constant, the number of electron–hole pairs did not increase with the increment in the number of photons.34
As shown in Fig. 3, the NH3–N removal capacity by the C/TiO2 photocatalyst increased with prolonging the irradiation time, while the NH3–N concentration in the solution decreased simultaneously. The NH3–N removal capacity increased rapidly to 12.25 mg g−1 in the first 60 min, and then had a continuing and stable increment of 11.05 mg g−1 after 5 h reaction, while it was still slightly raised by ca. 2.0 mg g−1 at 6 h of reaction. A high NH3–N removal capacity was achieved at the end of the experiment, which was more than 2 times higher than that at 1 h reaction.
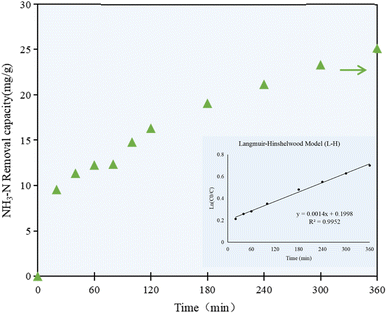 | ||
| Fig. 3 NH3–N removal capacity at different irradiation times by the C/TiO2 photocatalysts (AM1.5, 25 A, 1 g L−1 C/TiO2, pH 10.0, C0 = 50 mg L−1). | ||
The NH3–N removal capacity on C/TiO2 showed a rapid growth phase in the first 60 min, then increased steadily in the following 300 min, which proved that the change in the removal capacity was continuous and stable with prolonging the irradiation time. While the photocatalytic activity on C/TiO2 gradually increased with the progression of the reaction, the NH3–N concentration decreased steadily and reached a plateau due to the limited pollutant available. Taking energy-saving and efficiency into consideration, further experiments were performed under light for 60 min.
According to the concentration of ammonia–nitrogen in the solution at the set irradiation time intervals, the kinetic model for the photocatalytic reaction was studied. As shown in Fig. 3, the correlation coefficient R2 was calculated to be 0.9952, which proved that the photocatalytic reaction of C/TiO2 well fitted the Langmuir–Hinshelwood model (L–H). The L–H theory is based on the principles of adsorption and desorption, and it represents a multiphase catalytic mechanism where surface reactions are the controlling steps for the adsorbed molecules. According to the experimental data and the kinetic model, the photocatalytic reaction occurred on the surface of the catalyst, while the rate of the catalytic reaction depended on the reaction between the surface-adsorbed molecules, and the adsorption and desorption processes were in a dynamic equilibrium state.35
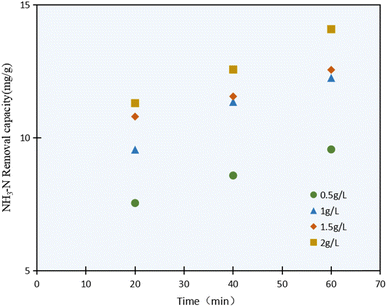
The NH3–N photocatalysis removal capacity results with varying the C/TiO2 dosage (0.5–2.0 g L−1) are shown in Fig. 4. It was confirmed that the NH3–N removal capacity was enhanced with the C/TiO2 dosage increasing, and obviously increased from 9.59 mg g−1 to 12.25 mg g−1 as the C/TiO2 dosage increased from 0.5 to 1.0 g L−1, while it showed an insignificant increment when the C/TiO2 dose was increased further to 1.5 and 2.0 g L−1.
The highest NH3–N degradation was obtained with 2 g L−1 photocatalyst due to the larger contact surface area, more photocatalytic activity points, and more active free radicals produced. Otherwise, the NH3–N removal capacity would be affected by the continuous dosage increment. Though a large number of photocatalytic activity sites would be provided by a high photocatalyst concentration, excessive C/TiO2 will lead to much higher turbidity in the solution and provide a shielding effect for the lighting, thus weakening the degradation capacity.36 Meicen Guo et al. also demonstrated that the scarring of light to the photocatalyst would be raised by an overdose of CNTS–TiO2.37 In view of the energy and efficiency, a favorable 1 g L−1 C/TiO2 was adopted in our tests.
As shown in Fig. 5, the NH3–N removal capacity was strongly affected by the solution pH, and it increased obviously with the pH changing from acid to alkaline. Compared to the control group 1 in Fig. 1, there was no efficient NH3–N removal by photocatalysis in acid conditions, as noted by the very limited reduction in the NH3–N amount (less than 3.04 mg g−1, which was lower than the 4.46 mg g−1 of the control group). However, the NH3–N removal capacity was ca. 4 or 5 times higher at pH 10.0 than the ones in acidic solution, indicating the photocatalysis performed better under alkaline conditions.
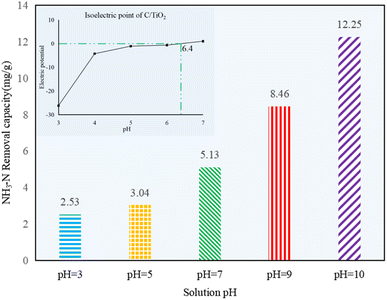 | ||
| Fig. 5 NH3–N removal capacity at different initial solution pH values (AM1.5, 25 A, 1 g L−1 C/TiO2, C0 = 50 mg L−1). | ||
The surface charge of the photocatalyst and the existing form of NH3–N in water can seriously be affected by the solution pH. Negative charges appeared on the photocatalyst under alkaline conditions. Here, the OH− concentration was increased while H+ concentration was decreased with pH increasing, and more ˙OH would be excited by C/TiO2 under light irradiation, so the removal capacity of NH3–N on C/TiO2 was improved.10 Besides, NH4+ and NH3 are two forms of N in NH3–N solution. More NH3 appeared as the pH increased. Satoshi Shibuya et al. found that it was much more efficient for photocatalysis when ammonia existed in the molecular form, and NH3–N removal capacity would be more prominent when mainly molecular ammonia existed.38 The pHpzc of C/TiO2 was around 6.4 (Fig. 5). Thus, the photocatalyst had positive charges on its surface when the solution pH was lower than its pHpzc and displayed negative charges when the solution pH was higher than 6.4. Ammonia can be much easier gathered onto the C/TiO2 surface by electrostatic attraction in alkaline solution, while it could hardly be attracted to C/TiO2 under acidic condition. However, Marco Altomare et al. confirmed that the NH3–N removal rate would decrease at pH higher than 10.5 due to the competitive adsorption of hydroxide anions on the surface of the photocatalyst.39 Thus, the NH3–N removal capacity was much better in an appropriate alkaline environment (pH 10.0).4
3.3 Characterization
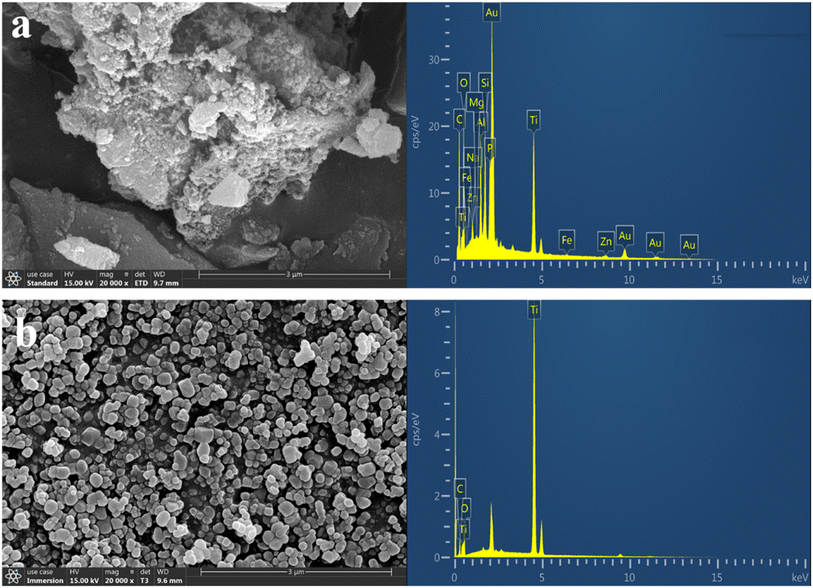
| Element | TiO2 (wt%) | Biochar (wt%) | C/TiO2 (wt%) |
|---|---|---|---|
| a C in commercial TiO2 might arise from the impurities during measurement, while the Au in C/TiO2 was from the gold-spraying treatment. | |||
| C | 2.86 | 11.67 | 20.46 |
| O | 18.53 | 7.44 | 17.47 |
| Ti | 78.62 | — | 17.62 |
| Si | — | 1.89 | 3.80 |
| Fe | — | 0.65 | 0.41 |
| Zn | — | 16.93 | 1.40 |
| Other | — | 61.42 | 38.84 |
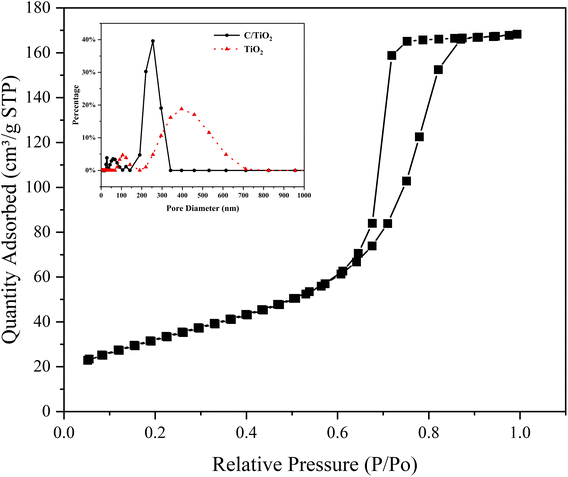
The N2 adsorption/desorption isotherms of C/TiO2 are shown in Fig. 7, where it can be seen there was a hysteresis loop at a relative pressure (P/Po) ranging from 0.6 to 0.85, which illustrated that the biochar-modified TiO2 exhibited a typical type-IV isotherm with the existence of a mesoporous structure. From the calculated BET data, the proportion of mesopores was over 90% and the specific surface area of the C/TiO2 photocatalyst increased from 11.88 (pure TiO2) to 119.47 m2 g−1 after modification, which was about 9 times higher than that of the pure TiO2. The inset in Fig. 7 shows the pore-size distribution for C/TiO2 and pure TiO2, showing that the pure TiO2 had little mesoporous structure, while the proportion of the mesoporous structure in C/TiO2 was significantly enhanced, and the total pore volume of C/TiO2 also showed a remarkable increase. This indicated that the porous structure and pore volume of TiO2 could be effectively enhanced after biochar modification. Thus, C/TiO2 had a more developed pore structure, which made the composite material have a larger specific surface area and more contact area and active points with pollutants.
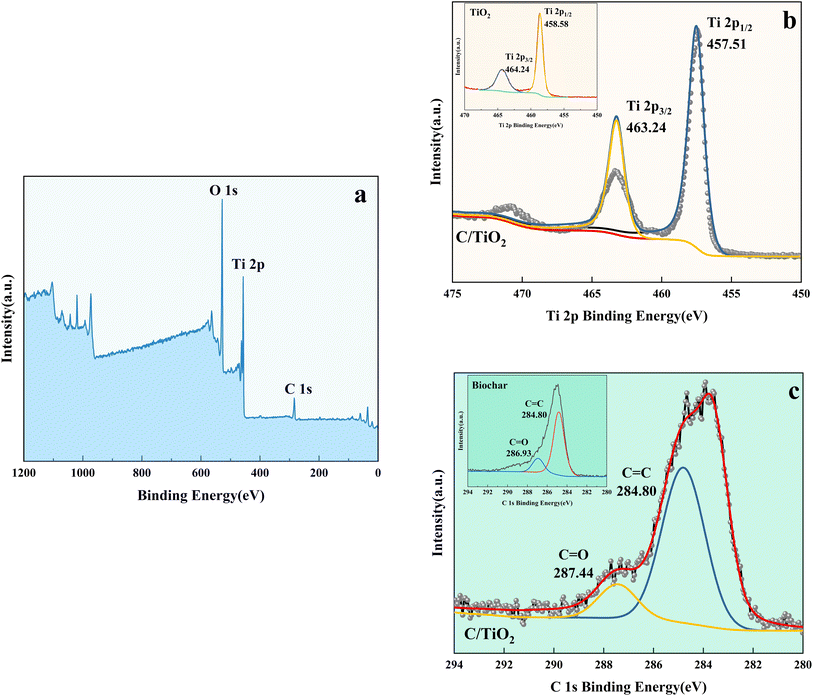 | ||
| Fig. 9 XPS spectra of C/TiO2 (a), Ti 2p in C/TiO2 and biochar (b), and C 1s in C/TiO2 and biochar (c). | ||
As shown in Fig. 9b, the Ti 2p peaks at 457.51 and 463.24 eV were related to Ti 2p1/2 and Ti 2p3/2 of Ti4+, respectively. Compared to the typical TiO2, the binding energy was reduced slightly on C/TiO2 because of the introduction of biochar, which might cause low-load electrons to transfer from the TiO2 surface to the biochar surface. Thus, the outer layer electron-distribution density of TiO2 was changed, leading to a reduction of the binding energy. As shown in Fig. 9c, C 1s peaks appeared at 284.80 and 287.44 eV corresponding to C 1s3/2 and C 1s1/2, respectively. The peak was slightly shifted from 286.93 eV on biochar to 287.44 eV on C/TiO2 due to the combination between TiO2 and biochar. The high C content in C/TiO2 changed its hydrophilicity and resulted in an increment in C![[double bond, length as m-dash]](https://www.rsc.org/images/entities/char_e001.gif) O groups. Then, the introduction of biochar was beneficial to ˙OH formation, which could form oxygen vacancies on the composed photocatalyst.44 Thus, more oxygen was attracted to C/TiO2, consequently improving its photocatalytic performance. In conclusion, the introduction of biochar was effective for enhancing the NH3–N removal efficiency of the composite.
O groups. Then, the introduction of biochar was beneficial to ˙OH formation, which could form oxygen vacancies on the composed photocatalyst.44 Thus, more oxygen was attracted to C/TiO2, consequently improving its photocatalytic performance. In conclusion, the introduction of biochar was effective for enhancing the NH3–N removal efficiency of the composite.
3.4 Mechanism
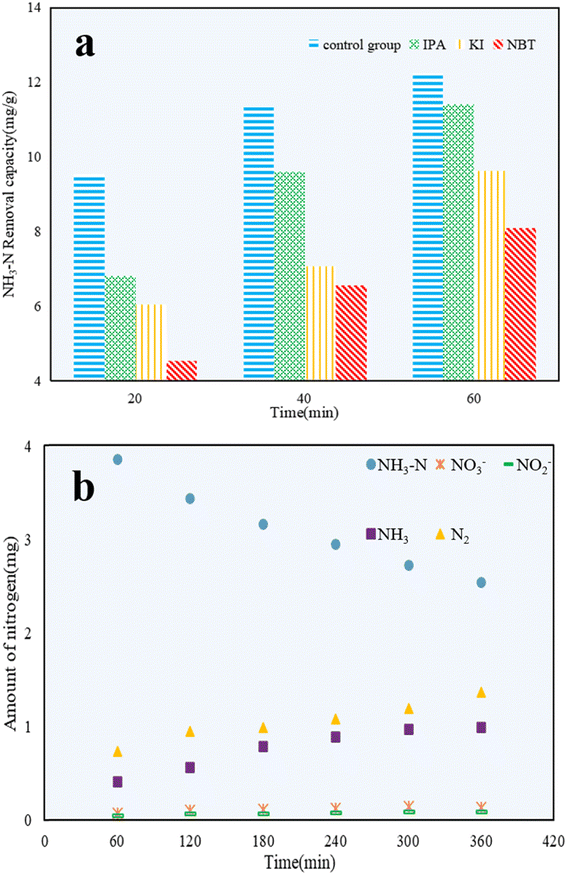
Propan-2-ol (IPA),49 potassium iodide (KI),50 and nitro blue tetrazolium (NBT)51 were added to NH3–N solutions to explore the effect of hydroxyl radicals (˙OH), valence band holes (h+), and superoxide radicals (˙O2−) on the photocatalytic reactions, respectively. As shown in Fig. 11a, the photocatalytic efficiency of C/TiO2 was restrained compared with the control group, which confirmed that h+, ˙OH, and ˙O2− all had certain impacts on the NH3–N removal capacity. After 60 min, the NH3–N removal capacity of C/TiO2 under NBT addition was 8.10 mg g−1, which was clearly lower than for both cases with IPA and KI addition. It was demonstrated that ˙O2− played a major role in NH3–N degradation, while both ˙OH and h+ had effects on NH3–N removal to some extent too.52Next, 1 g L−1 C/TiO2 was added into 100 mL of 50 mg L−1 NH3–N solution (pH 10.0), and the photocatalytic reaction was carried out under a xenon lamp (AM1.5, 25 A) with stirring (450 rpm) for 6 h. The amount of NO3−, NO2−, and NH3 were measured every 1 h, and the amount of N2 generated was calculated via the conservation of mass.
As shown in Fig. 11b, the amounts of NH3–N, NO3−, NO2−, NH3, and N2 during the NH3–N photocatalytic reaction were calculated and compared. The stable decrease in the amount of NH3–N illustrated the continuous photocatalytic degradation of NH3–N. Because of the high pH, NH3 became the main form of NH3–N in water. Thus, the increased content of NH3 was attributed to ammonia blowing off from the solution during the experiments. After 6 h, the amount of NO3− and NO2− detected was tiny and could be ignored. The amount of N2 was much larger than NO3− and NO2−, and was almost 2 times higher than that of NH3. This proved that NH3–N was mainly converted to the non-noxious N2. C/TiO2 was effective in the photocatalytic reaction and was shown to be a significant method to treat low-concentration NH3–N solutions.53
4. Conclusions
An advanced C/TiO2 composite photocatalyst using solid waste was prepared by the sol–gel method for the effective and environmentally friendly degradation of NH3–N in aqueous solutions. The removal capacity of NH3–N on the composite was higher than that on commercial TiO2 at pH 10 with 1 g L−1 C/TiO2 under both 60 and 120 min irradiation (xenon lamp, AM1.5, 25 A). The photocatalytic efficiency of C/TiO2 under simulated sunlight irradiation displayed good performance and its NH3–N removal capacity increased with the light power increasing, while NH3–N removal by C/TiO2 was favorable in a proper alkaline environment (pH 10.0).The characterization of C/TiO2 through SEM-EDS, BET, XRD, XPS, and FT-IR showed the successful introduction of biochar onto TiO2. As shown in the SEM-EDS and BET analysis, C/TiO2 had a larger surface area and more pores compared to the raw materials. XRD spectroscopy showed that C/TiO2 had similar characteristic peaks with anatase-TiO2, which indicated that the biochar addition did not change TiO2's effective phase structure. Compared to TiO2, some carbon- and oxygen-containing functional groups were presented in C/TiO2 that originated from the biochar modification, and effectively proved its photocatalytic performance by the XPS and FT-IR results. According to the radical quenching experiment and NH3–N photocatalytic degradation analysis, superoxide radicals (˙O2−) were proved to be the main oxidant influencing the removal capacity, and N2 was the main product of the photocatalytic reaction. Compared to commercial anatase-TiO2, C/TiO2 displayed a relatively higher efficiency for NH3–N removal, but also had more significance for beneficial solid-waste utilization. This work could provide an economic and meaningful photocatalyst to treat NH3–N wastewater. In future research, studies should focus on further improvement of the photocatalytic efficiency, and sustainable utilization and practical application tests should be carried out.
Author contributions
Jiawei Wang: experiment, data curation, formal analysis, writing – original draft, visualization. Guoqiao Wang: conceptualization, methodology, experiment. Tian Yu: data curation, writing – original draft, experiment. Nengjie Ding: experiment. Meicheng Wang: experiment. Yao Chen: supervision, methodology, writing – reviewing and editing, visualization.Conflicts of interest
There are no conflicts to declare.Acknowledgements
The authors declare that no funds, grants, or other support were received during the preparation of this manuscript.Notes and references
- Ministry of Ecology and Environment of the People's Republic of China, Annual Report of China's Ecological and Environmental Statistics, 2020 Search PubMed.
- A. R. Brown, M. Lilley, J. Shutler, C. Lowe, Y. Artioli, R. Torres, E. Berdalet and C. R. Tyler, Rev. Aquacult., 2019, 12, 1663–1688 Search PubMed.
- A. Damar, K.-J. Hesse, F. Colijn and Y. Vitner, Deep Sea Res., Part II, 2019, 163, 72–86 CrossRef CAS.
- X. Luo, C. Chen, J. Yang, J. Wang, Q. Yan, H. Shi and C. Wang, Int. J. Environ. Res. Public Health, 2015, 12, 14626–14639 CrossRef CAS PubMed.
- D. Qu, D. Sun, H. Wang and Y. Yun, Desalination, 2013, 326, 135–140 CrossRef CAS.
- A. Alshameri, A. Ibrahim, A. M. Assabri, X. Lei, H. Wang and C. Yan, Powder Technol., 2014, 258, 20–31 CrossRef CAS.
- M. Sakar, R. Mithun Prakash and T. Do, Catalysts, 2019, 9, 680 CrossRef CAS.
- L. Lu, R. Shan, Y. Shi, S. Wang and H. Yuan, Chemosphere, 2019, 222, 391–398 CrossRef CAS PubMed.
- Y. M. Hunge, A. A. Yadav, A. G. Dhodamani, N. Suzuki, C. Terashima, A. Fujishima and V. L. Mathe, Ultrason. Sonochem., 2020, 61, 104849 CrossRef CAS PubMed.
- M. Pelaez, N. T. Nolan, S. C. Pillai, M. K. Seery, P. Falaras, A. G. Kontos, P. S. M. Dunlop, J. W. J. Hamilton, J. A. Byrne, K. O'Shea, M. H. Entezari and D. D. Dionysiou, Appl. Catal., B, 2012, 125, 331–349 CrossRef CAS.
- R. Yu, X. Yu, J. Fu, Y. Zhang, Y. Liu, Y. Zhang and S. Wu, Water Environ. J., 2021, 35, 962–970 CrossRef CAS.
- L. Deng, B. Chang, D. Shi, X. Yao, Y. Shao, J. Shen, B. Zhang, Y. Wu and X. Hao, Renewable Energy, 2021, 170, 858–865 CrossRef CAS.
- Z. Liu, J. Qiu, C. Zheng and L. Li, AIP Conf. Proc., 2017, 1820, 030004 Search PubMed.
- M. Nasr, C. Eid, R. Habchi, P. Miele and M. Bechelany, ChemSusChem, 2018, 11, 3023–3047 CrossRef CAS PubMed.
- Y. Jia, P. Liu, Q. Wang, Y. Wu, D. Cao and Q. A. Qiao, J. Colloid Interface Sci., 2021, 585, 459–469 CrossRef CAS PubMed.
- W. Shi, S. Yang, H. Sun, J. Wang, X. Lin, F. Guo and J. Shi, J. Mater. Sci., 2020, 56, 2226–2240 CrossRef.
- W. Shi, K. Shu, H. Sun, H. Ren, M. Li, F. Chen and F. Guo, Sep. Purif. Technol., 2020, 246, 116930 CrossRef CAS.
- C. H. A. Tsang, K. Li, Y. Zeng, W. Zhao, T. Zhang, Y. Zhan, R. Xie, D. Y. C. Leung and H. Huang, Environ. Int., 2019, 125, 200–228 CrossRef CAS.
- X. Xiao, B. Chen, Z. Chen, L. Zhu and J. L. Schnoor, Environ. Sci. Technol., 2018, 52, 5027–5047 CrossRef CAS PubMed.
- P. D. Dissanayake, S. You, A. D. Igalavithana, Y. Xia, A. Bhatnagar, S. Gupta, H. W. Kua, S. Kim, J.-H. Kwon, D. C. W. Tsang and Y. S. Ok, Renewable Sustainable Energy Rev., 2020, 119, 109582 CrossRef CAS.
- S. Fan, Y. Wang, Z. Wang, J. Tang, J. Tang and X. Li, J. Environ. Chem. Eng., 2017, 5, 601–611 CrossRef CAS.
- L. Zhang, P. Ma, L. Dai, S. Li, W. Yu and J. Guan, Catal. Sci. Technol., 2021, 11, 3834–3844 RSC.
- L. He, G. Wang, X. Zhang, Y. Zhang and Y. Chen, Water Sci. Technol., 2020, 82, 1643–1652 CrossRef CAS PubMed.
- G. Wang, J. Wang, T. Yu, X. Guo and Y. Chen, RSC Adv., 2022, 12, 31966–31975 RSC.
- F. Dalanta and T. D. Kusworo, Chem. Eng. J., 2022, 434, 134687 CrossRef CAS.
- M. Zendehzaban, M. Ashjari and S. Sharifnia, Int. J. Energy Res., 2019, 44, 2150–2163 CrossRef.
- Y. Shavisi, S. Sharifnia, S. N. Hosseini and M. A. Khadivi, J. Ind. Eng. Chem., 2014, 20, 278–283 CrossRef CAS.
- Q. Zhou, H. Yin, A. Wang and Y. Si, Chin. J. Chem. Eng., 2019, 27, 2535–2543 CrossRef CAS.
- S. Wang, Q. Xu, Y. Zhang, G. Jin, W. He and N. Zhang, Rev. Roum. Chim., 2020, 65, 789–794 CrossRef.
- X. Peng, M. Wang, H. Dai, F. Qiu and F. Hu, Environ. Sci. Pollut. Res. Int., 2020, 27, 39198–39210 CrossRef CAS.
- J. Feng, X. Zhang, G. Zhang, J. Li, W. Song and Z. Xu, Chemosphere, 2021, 274, 129689 CrossRef CAS PubMed.
- Z. Shayegan, C.-S. Lee and F. Haghighat, Chem. Eng. J., 2018, 334, 2408–2439 CrossRef CAS.
- T. Le Thi Thanh, L. Nguyen Thi, T. Tran Dinh and N. Nguyen Van, J. Chem., 2019, 2019, 1–8 CrossRef.
- H.-Y. Cheng, K.-C. Chang, K.-L. Lin and C.-M. Ma, AIP Conf. Proc., 2018, 1946, 020006 CrossRef.
- W. Wang, G. Li, D. Xia, T. An, H. Zhao and P. K. Wong, Environ. Sci.: Nano, 2017, 4, 782–799 RSC.
- D. Chen, Y. Cheng, N. Zhou, P. Chen, Y. Wang, K. Li, S. Huo, P. Cheng, P. Peng, R. Zhang, L. Wang, H. Liu, Y. Liu and R. Ruan, J. Cleaner Prod., 2020, 268, 121725 CrossRef CAS.
- M. Guo, X. Yu, J. Liu, L. Wang, Z. Nie and H. Yang, IOP Conf. Ser.: Mater. Sci. Eng., 2018, 301, 012138 CrossRef.
- S. Shibuya, Y. Sekine and I. Mikami, Appl. Catal., A, 2015, 496, 73–78 CrossRef CAS.
- M. Altomare, G. L. Chiarello, A. Costa, M. Guarino and E. Selli, Chem. Eng. J., 2012, 191, 394–401 CrossRef CAS.
- P. Lisowski, J. C. Colmenares, O. Mašek, W. Lisowski, D. Lisovytskiy, A. Kamińska and D. Łomot, ACS Sustainable Chem. Eng., 2017, 5, 6274–6287 CrossRef CAS.
- N. Bao, Z. Wei, Z. Ma, F. Liu and G. Yin, J. Hazard. Mater., 2010, 174, 129–136 CrossRef CAS PubMed.
- D. Channei, B. Inceesungvorn, N. Wetchakun, S. Ukritnukun, A. Nattestad, J. Chen and S. Phanichphant, Sci. Rep., 2014, 4, 5757 CrossRef CAS PubMed.
- Y. Pan, Y. Zhang, Y. Huang, Y. Jia, L. Chen and H. Cui, J. Hazard. Mater., 2021, 416, 125802 CrossRef CAS.
- Y. Zhou and M. Sun, Environ. Sci. Pollut. Res. Int., 2022, 29, 12261–12281 CrossRef CAS.
- S. Au-pree, P. Narakaew, S. Thungprasert, T. Promanan, A. Chaisena and S. Narakaew, Eng. J., 2021, 25, 53–68 CrossRef CAS.
- J. Matos, M. Rosales, A. García, C. Nieto-Delgado and J. R. Rangel-Mendez, Green Chem., 2011, 13, 3431–3439 RSC.
- C. F. Carbuloni, J. E. Savoia, J. S. P. Santos, C. A. A. Pereira, R. G. Marques, V. A. S. Ribeiro and A. M. Ferrari, J. Environ. Manage., 2020, 262, 110347 CrossRef CAS.
- X. U. Zu-Shun, Z. Quan-Yuan, H. U. Xiao-Yu, L. Guang-Fu and P. Qiu-Hu, J. Inorg. Mater., 2019, 34, 219–224 CrossRef.
- L. Sun, Y. Zhou, X. Li, J. Li, D. Shen, S. Yin, H. Wang, P. Huo and Y. Yan, Chin. J. Catal., 2020, 41, 1573–1588 CrossRef CAS.
- Y. Li, H. Sun, T. Peng, H. You, Y. Qin and L. Zeng, Appl. Clay Sci., 2019, 179, 105155 CrossRef CAS.
- X. Jia, Z. Shen, Q. Han and H. Bi, Chin. J. Catal., 2022, 43, 288–302 CrossRef CAS.
- M. S. S. Dorraji, M. H. Rasoulifard, H. Daneshvar, A. Vafa and A. R. Amani-Ghadim, J. Mater. Sci.: Mater. Electron., 2019, 30, 12152–12162 CrossRef.
- J. Feng, X. Zhang, G. Zhang, J. Li, W. Song and Z. Xu, Chemosphere, 2021, 274, 129689 CrossRef CAS.
Footnote |
| † Electronic supplementary information (ESI) available. See DOI: https://doi.org/10.1039/d3ra03789d |
| This journal is © The Royal Society of Chemistry 2023 |

