DOI:
10.1039/D3RA03085G
(Paper)
RSC Adv., 2023,
13, 22088-22100
Pressure-induced physical properties in topological semi-metal TaM2 (M = As, Sb)†
Received
9th May 2023
, Accepted 13th July 2023
First published on 24th July 2023
Abstract
In this study, DFT based first principles calculations are used for measuring the structural, elastic, mechanical, electronic, optical and thermodynamic features of topological semimetal TaM2 (M = As, Sb) under various pressures. We conducted the first investigation into the physical properties of the topological semimetal TaM2 (M = As, Sb) under pressure. Formation energy and Born stability criteria justify the compound's thermodynamic and mechanical stability. We used elastic constants, elastic moduli, Kleinman parameter, machinability index, and Vickers hardness to investigate the mechanical properties of topological semimetal TaM2. Poisson's and Pugh's ratios reveal that both compounds change from brittle to ductile in response to pressure. The increasing nature of elastic moduli suggests that TaM2 becomes stiffer under stress. The pressure has a significant effect on the anisotropy factor for both materials. Band structure analysis shows that both compounds are Weyl semi-metals and the d orbital contributes significantly to the formation of the Fermi level, as shown by the density of states (DOS) analysis. Investigation of electronic characteristics provides important support for dissecting optical performance. Both the reflectivity and absorption spectra shift upwards in energy when pressure is increased. The refractive index value decreases and becomes flat in the higher energy region. Based on their refractive indices, both of these materials demonstrate as a high-density optical data storage medium when exposed to the right light source. The thermodynamic properties including sound velocity, and Debye temperature all exhibit an increasing nature with applied pressure. Due to their high Debye temperatures, the components under study have a rather high melting point.
1. Introduction
Topological semimetals and metals have emerged as a new area in quantum materials research. They exhibit novel macroscopic quantum phenomena that are not only of basic interest but may have some important technological applications.1,2 In earlier times, various topological semimetals have exhibited superconductivity through different methods such as applying pressure,3–6 doping,7,8 and the effect of proximity.9,10 Interestingly, superconductivity was observed in point contacts between ends of normal metal and various non-superconducting topological materials exhibiting Dirac points,11,12 Weyl points,13–16 triply degenerate points,17,18 and nodal lines.19,20 It is intriguing that many topological materials, including type II Weyl semimetals like MoTe2 (ref. 21) and WTe2,22,23 Dirac semimetals like Cd3As2 (ref. 24) and ZrTe5,25 and topological insulators like Bi2Se3,26 Bi2Te3 (ref. 27) and Sb2Te2,28 undergo superconducting phase transitions when subjected to high pressure. Even though the process of tip-induced superconductivity (TISC) remains unknown, this method offers an innovative and practical method to investigate TISC. Many researchers believe that bulk bands15 or topological surface states16 are responsible for their creation. Therefore, it is highly desired to conduct TISC inspections across a wide range of materials with adjustable properties.
Recently, a new class of topological semimetals, the transition-metal di-pnictides MPn2 (Pn = Sb, As, P; M = Nb, Ta), have attracted widespread interest.27–34 When spin–orbit coupling (SOC) ignored, band structures exhibit nodal lines; however, when SOC is considered, the band anti-crossings become completely gapped, releasing an array of electrons and crossing hole band at the Fermi level and specifying weak Z2 topological invariants in the bulk.27–29 However, due to the low Z2 number, surface states are extremely sensitive to the crystal orientation with no topological protection. In contrast, there is a great deal of similarity between the band structures of the individuals of the same family. Consequently, realizing TISC on various MPn2 members or crystallographic planes and comparing their superconducting properties may lead to important insights about how to explain induced superconductivity. Another intriguing aspect of the MPn2 family is the possibility of inducing Weyl points using a magnetic field.35 Studying MPn2 at high pressure is enticing because its monoclinic structure is stable at very high pressure.36
The nonmagnetic semimetal TaAs2 reportedly displays a very large negative magnetoresistance due to some unknown scattering mechanism, as demonstrated by Luo et al.45 Using first-principles calculations, Xu et al.47 have explored the electronic structures and topological features of TaAs2 and TaSb2 semimetals. They show that nodal lines are present in all of these compounds because spin–orbit coupling is absent in the band structure. The effects of pressure on structural and transport characteristics of TaSb2 single crystal were studied by Y. Zhou et al.48 Although the synthesis and remarkable properties of the topological semimetal TaM2 (M = As, Sb) have been described in recent papers, a comprehensive theoretical investigation of their physiochemical properties is still absent.
In this work, we provide a thorough evaluation of the pressure-dependent physical properties in the topological semimetals TaAs2 and TaSb2. We systematically analyzed several fundamental features of TaM2 (M = As, Sb) as a function of pressure, including the structural, elastic, mechanical, electronic, optical, and thermodynamic properties. We hope that this work will be useful in advancing high-pressure study and production of topological semi metals.
2. Computational methods
2.1 Density functional theory (DFT)
First principles calculations were carried out utilizing the DFT-based CASTEP algorithm.37 The simplified Perdew–Burke–Ernzerhof model was applied to characterize exchange–correlation energies in the GGA.38 The following valence electrons were taken into account during pseudo-atomic simulations: Ta-5d3 6s2, As-4s2 4p3, and Sb-5s2 5p3 for topological semi-metal TaM2 (M = As, Sb). We computed the optimized structure and total energy by fixing the k-point to 5 × 10 × 5 and the cut-off energy to 520 eV, respectively. The Monkhorst–Pack technique confirmed that the k-points are in the Brillouin region.39 In order to determine the best configuration, we employed the Broyden–Fletcher–Goldfarb–Shanno (BFGS) technique.40 Tolerance factors for convergence have been calculated to be 1 × 10⁻⁵ eV Å−1 total energy per atom, with maximum displacement, force, and stress be 1 × 10⁻³ Å, 0.03 eV Å−1 and 0.05 GPa respectively, all based on recent simulations of geometry optimization. In this study, the process of optimizing the structure involves slowly raising applied pressure from 0 to 40 GPa with 10 GPa difference. Most reliable crystal structures can be made with the help of the VESTA programme.41 When calculating the electrical and optical properties, the same parameters used to optimise the structure are applied. The ‘stress–strain’ approach of the CASTEP algorithm is used to calculate elastic moduli and constants.42 The ELATE programme can generate anisotropic contour plots in three dimensions (3D).43
3. Results and discussion
3.1 Structural properties
The topological semi-metal TaAs2 and TaSb2 materials retain monoclinic crystallographic configuration including space group C2/m.44 There are a spread of TaAs2 bond length range from 2.72–2.56 Å and TaSb2 bond distances ranging from 2.92–2.73 Å. Fig. 1 depicts the 2D and 3D structure of topological semi-metal TaM2 (M = As, Sb). In the ESI, Table S1† displays the calculated and several experimental structural parameters of the semi-metal TaM2 (M = As, Sb). We validate our DFT-based simulation by finding good agreement between our estimated and experimental values for the structural parameters TaM2 (M = As, Sb). Fig. 2(a)–(c) shows that hydrostatic pressure has an effect on the lattice parameters, pressure causes a decrease in both the volume of the unit cell and lattice parameter. Our simulated lattice parameters exhibit excellent concordance with other experimental and calculated values45–49 which was depicted in Fig. 2(a) and (b) for TaAs2 and TaSb2, respectively. This clearly justify the validity of our work. The variation of cell volume as a function of pressure is depicted in Fig. 2(c). To evaluate the materials phase stability under pressure, the formation energy of TaM2 (M = As, Sb) is calculated using the below equation:| |
 | (1) |
Here, Es(Ta), Es(M), and Etot(TaM2) represent the energy of Ta, M, and TaM2, whereas (M = As and Sb) and N denotes the number of atoms in the unit cell. Each substance needs a negative formation energy to be thermodynamically stable.50 The calculated values of ΔEf are shown in Fig. 2(d). Therefore, TaM2 (M = As, Sb) compounds are thermodynamically stable, as evidenced by the negative values of ΔEf under hydrostatic stress.
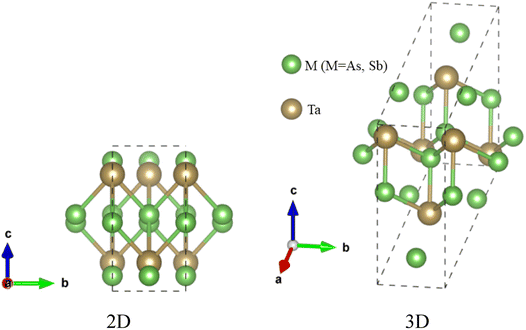 |
| | Fig. 1 The crystal 2D and 3D structure of topological semi-metal TaM2 (M = As, Sb). | |
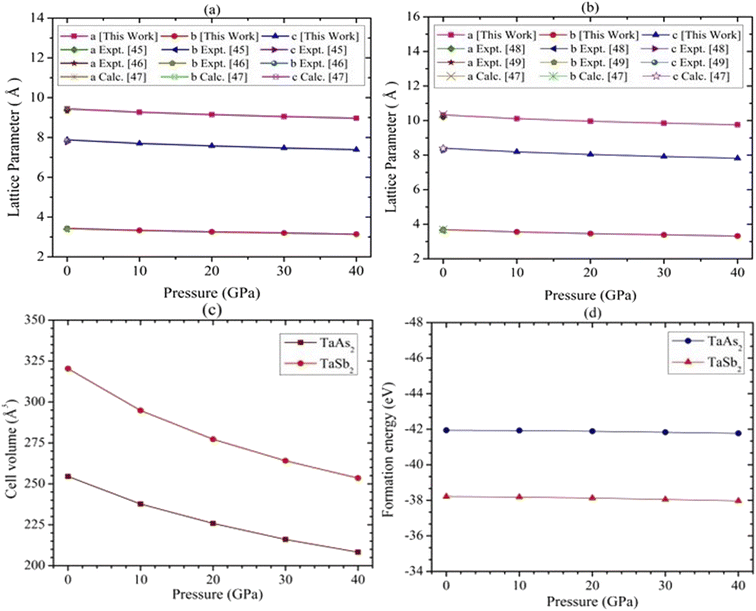 |
| | Fig. 2 Pressure-dependent structural distortion in (a) lattice parameter for TaAs2 (b) lattice parameter for TaSb2, (c) cell volume, and (d) formation energy of TaM2 (M = As and Sb) semi-metal. | |
3.2 Mechanical properties
Due to comprehend the nature of bonds between nearby atoms and the cohesiveness of a material, a thorough examination of elastic characteristics is required.51 Hence, studying the elastic constants is crucial for gaining insight into the mechanical properties of topological semi-metal TaM2 (M = As, Sb) and its response to pressure. Hooke's law provides a framework for determining elastic constants from the stress–strain relationship.52 In the case of the monoclinic phase, there are thirteen elastic constants, which are designated as follows: C11, C22, C33, C44, C55, C66, C12, C23, C35, C46, C13, C15, and C25, respectively.53
A material's length elasticity, shape elasticity, and resistance to shear deformation can be represented by C11, C12 and C44, respectively. The estimated elastic constants of topological semi-metal TaAs2 and TaSb2 are represented in Tables S2 and S3 [see ESI†], respectively.
The Born stability criterion for the monoclinic structure are as follows:54,55
| | |
C22 − P > 0, C44 − P > 0, C66 − P > 0, C11 − P > 0, C33 − P > 0, C55 − P > 0, 2C12 + 2C13 + 2C23 + C11 + C22 + C33 + 3P > 0, (C11 − P) (C33 − P) > C352, (C66 − P) (C44 − P) > C462, (C33 + C22 − 2C23 − 4P) > 0, 2(C23 − P) C25C35 + (C22 − P) [(C55 − P) (C33 − P) − C352] > (C55 − P) (C23 + P)2 + C252 (C33 − P), 2C15C35 [(C13 + P) (C22 − P) + 2C15C25 [(C12 + P) (C33 − P) − (C23 + P) (C13 + P)] − (C23 + P) (C12 + P)] + 2C25C35 [(C12 + P) (C11 − P) − (C13 + P) (C12 + P)] − C152 [(C33 − P) (C22 − P) − (C23 + P)2] − C252 [(C33 − P) (C11 − P) − (C13 + P)2] − C352 [(C22 − P) (C11 − P) − (C12 + P)2] + (C55 − P) [(C22 − P) (C13 − P) (C33 − P) − (C13 + P)2 (C22 − P) − (C11 − P) − (C23 + P)2 − (C12 + P)2 (C33 − P)+ 2(C13 + P) (C12 + P) (C23 + P)] > 0
| (2) |
All of the estimated elastic constants satisfy Born stability criterion conforming mechanical stability of our investigated compounds even when subjected to high levels of stress. In Tables S2 and S3† shows the impact of stress on elastic constants of topological material TaM2 (M = As, Sb). It was seen that the calculated values of elastic constant expand with rising the stress, so our studied materials become stiffer and more resistance to deformation, which can be used in different engineering applications.
Using the Voigt–Reuss–Hill averaging approach, we may extrapolate these characteristics from the calculated elastic constants.56 Resistance against plastic deformation due to applied pressure and shear stress can be measured by materials bulk modulus and shear modulus.55–57 Tables S4 and S5† listed the calculated values of the Pugh's and Poisson's ratio, as well as for elastic moduli the pressure-treated topological semi-metal TaM2 (M = As, Sb) and the impact of pressure on elastic moduli depicted in Fig. 3(a) and (b). When the pressure is raised, the bulk and shear both increases. That means at higher pressure, monoclinic crystal TaM2 (M = As, Sb) exhibits a larger resistance to compression. We also demonstrate that pressure has a smaller effect on the shear modulus than bulk modulus. One of the most important mechanical properties of any given material is its Young's modulus. In tensile loading, it's all about the stress-to-strain ratio.58 Rough stiffness is often associated with a high Young's modulus, and is well known in the scientific community. From Fig. 3, it is evident that as pressure is increased, the E values for TaM2 (M = As, Sb) materials increase, suggesting that pressure significantly affects their hardness.
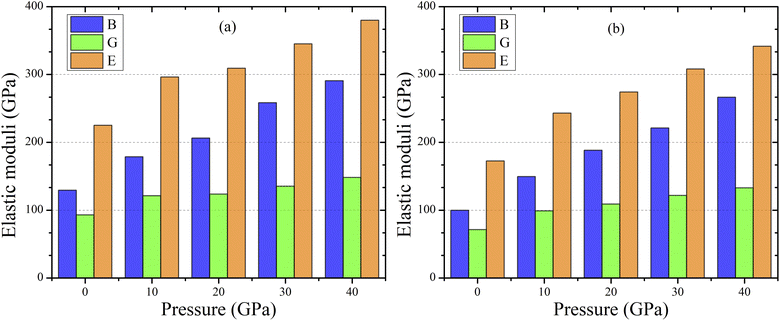 |
| | Fig. 3 Variation of elastic moduli for topological semi-metal TaM2 (M = As, Sb) under pressure. | |
Tables S4 and S5† listed the calculated values of the elastic moduli for the pressure-treated topological semi-metal TaM2 (M = As, Sb).
Fig. 4(a) depicts the Pugh's ratio for TaM2 semi-metals, that is equal to B/G and is a measure of how ductile or brittle a material is. Pugh's ratio states that a small (large) B/G value59 is related to a brittle (ductile) solid's nature. When this ratio becomes close to 1.75, brittle materials become easily identifiable as opposed to ductile ones. Fig. 4(a) demonstrates that the value of B/G rises with increasing pressure. Meanwhile, at equal or above 30 GPa the TaM2 (M = As, Sb) material become ductile. Below this pressure, the material is brittle. So, there is brittle and ductile transition, which suggests that pressure enhances TaM2's ductility.
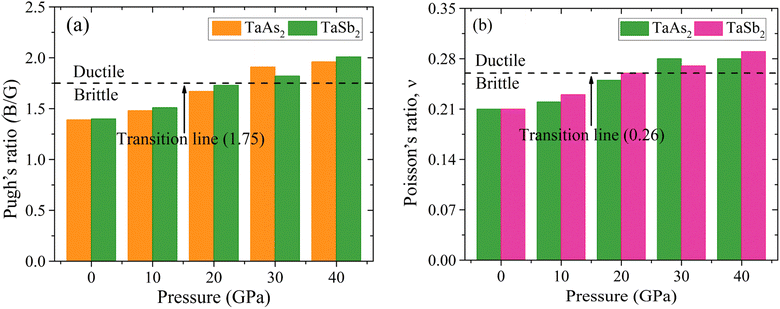 |
| | Fig. 4 Effect of pressure on (a) Pugh's and (b) Poisson's ratio of topological semi-metal TaM2 (M = As, Sb). | |
Poisson's ratio is another criterion for measuring ductility; its critical value is 0.26.60 For a wide range of stress, v > 0.26 indicating the ductility of TaM2 (M = As, Sb) compounds. As seen in Fig. 4(b), the value of v for both materials rise as a function of stress. Brittle-ductile transition occur for both the materials at 30 GPa pressure.
Vickers hardness (Hv) as well as E, G, B, v and G/B can be used to determine hardness of a material.61 The relations are:
| | |
H5 = −2.899 + 0.1769G
| (7) |
| |
 | (8) |
| |
 | (9) |
| |
 | (10) |
The hardness values of TaM2 (M = As, Sb) are shown in Table 1. As pressure rises, both compounds hardness value begins to grow. According to the findings, applying pressure makes elastic and plastic deformation more complex. Hardness measurements clearly show that TaAs2 is harder than TaSb2.
Table 1 Pressure dependent hardness of topological semi-metal TaM2 (M = As, Sb)
| P (GPa) |
Semi-metal |
H1 |
H2 |
H3 |
H4 |
H5 |
H6 |
H7 |
H8 |
| 0 |
TaAs2 |
12.45 |
13.66 |
13.71 |
14.29 |
13.55 |
10.33 |
17.98 |
38.67 |
| TaSb2 |
9.59 |
10.47 |
10.49 |
10.95 |
9.69 |
7.96 |
13.77 |
32.94 |
| 10 |
TaAs2 |
17.20 |
17.98 |
17.85 |
18.81 |
18.51 |
13.66 |
22.66 |
49.33 |
| TaSb2 |
14.40 |
14.75 |
14.58 |
15.43 |
14.59 |
10.94 |
17.78 |
44.58 |
| 20 |
TaAs2 |
19.86 |
18.76 |
18.23 |
19.62 |
18.96 |
13.75 |
20.60 |
58.01 |
| TaSb2 |
18.13 |
16.63 |
16.07 |
17.40 |
16.37 |
11.95 |
17.39 |
56.06 |
| 30 |
TaAs2 |
24.86 |
20.94 |
19.92 |
21.91 |
20.99 |
14.79 |
19.77 |
72.19 |
| TaSb2 |
21.28 |
18.70 |
17.92 |
19.56 |
18.59 |
13.34 |
18.60 |
63.80 |
| 40 |
TaAs2 |
27.99 |
23.06 |
21.85 |
24.13 |
23.31 |
16.65 |
21.77 |
78.82 |
| TaSb2 |
25.65 |
20.73 |
19.58 |
21.68 |
20.58 |
14.45 |
18.53 |
76.01 |
For monoclinic phase,62–64
| |
 | (11) |
| |
 | (12) |
| |
 | (13) |
Similarly, Aeq is the equivalent Zener anisotropy factor.64
| |
 | (14) |
From log Euclidean formula the universal log-Euclidean index can be written as,65
| |
 | (15) |
Here, the
C44 values for Voigt (
CV44) and Reuss (
CR44) determined as-
| |
 | (16) |
| |
 | (17) |
The Kleinman parameter, which is denoted by ζ often lies between 0 and 1. This index measures how much bonds can extend relative to other types of securities. This metric assesses a material's tensile and flexural stress resistance. For a compound, the following form may be used:66,67
| |
 | (18) |
When bonds are stretched, ζ tends towards 1, whereas when bonds are bent, ζ tends towards 0. Calculated values of ζ confirm our studied materials are bending type. Tables 2 and 3 demonstrate the effect of stress on the Kleinman parameter. In terms of potential engineering applications, the machinability index, μM = B/C44, is an important performance indicator. The slicability of a solid is represented by the μM value. If μM is high, then dry lubrication and modifications are simpler.68
| |
 | (19) |
Table 2 The Voigt and Reuss values of CR44 & CV44 (in GPa), Aeq, AG, AB and AL of TaAs2 compounds at different applied pressures
| P |
CR44 |
CV44 |
Aeq |
AU |
AG |
AB |
ζ |
μM |
| 0 |
31.64 |
0.54 |
12.04 |
12.15 |
0.01 |
0.01 |
0.42 |
1.44 |
| 10 |
42.32 |
0.04 |
12.18 |
12.31 |
0.03 |
0.01 |
0.44 |
1.43 |
| 20 |
43.10 |
0.39 |
12.42 |
12.60 |
0.05 |
0.02 |
0.48 |
1.67 |
| 30 |
53.11 |
0.04 |
12.23 |
12.38 |
0.03 |
0.01 |
0.48 |
1.64 |
| 40 |
51.96 |
0.96 |
12.11 |
12.23 |
0.02 |
0.01 |
0.51 |
1.98 |
Table 3 The Voigt and Reuss values of CR44 & CV44 (in GPa), Aeq, AG, AB and AL of TaSb2 compounds at different applied pressures
| P |
CR44 |
CV44 |
Aeq |
AU |
AG |
AB |
ζ |
μM |
| 0 |
25.31 |
0.00 |
12.35 |
12.52 |
0.05 |
0.02 |
0.46 |
1.31 |
| 10 |
34.80 |
0.86 |
12.27 |
12.42 |
0.04 |
0.01 |
0.50 |
1.32 |
| 20 |
40.72 |
0.25 |
12.37 |
12.54 |
0.05 |
0.01 |
0.50 |
1.48 |
| 30 |
43.48 |
0.67 |
12.44 |
12.62 |
0.05 |
0.02 |
0.51 |
1.79 |
| 40 |
50.41 |
0.13 |
12.44 |
12.63 |
0.06 |
0.01 |
0.55 |
1.72 |
The μM value of TaM2 (M = As, Sb) is presented in Table 2 for TaAs2 and Table 3 for TaSb2 at various pressures, as pressure increases, this value also rises. Therefore, TaM2 (M = As, Sb) compounds are less machinable. Tables 2 and 3 display the calculated values of various anisotropy factors under applied pressures for TaAs2 and TaSb2, respectively. The computed equivalent Zener anisotropy factor Aeq suggests that TaM2 (M = As, Sb) materials are highly anisotropic and become more anisotropic with applying pressure. Both AG and AB have values between 0 and 1, with 0 denoting isotropy and 1 denoting anisotropy, respectively. TaM2 (M = As, Sb) is anisotropic in our study because AG > AB > 0, characterized by a greater degree of shear anisotropy than compressibility anisotropy. Because strongly anisotropic crystals are less common than AU crystals, AL is a measure of a crystalline substance's absolute anisotropy. The main drawback of AU is that it only provides a qualitative description of the degree to which a material is anisotropic.
A graphic representation of three-dimensional change in E, β, G, and ν were created using ELATE algorithm.69 Anisotropy values of E, β, G, and ν in TaM2 semi-metals are presented at 0 GPa and 40 GPa depending on the matrix that is provided to the ELATE programme. Fig. 5 depicts the change in elastic moduli along different axes. A 3D sphere plot displays isotropy, whereas a non-sphere plot illustrates anisotropy.70 Elastic anisotropy in the studied materials is present in all directions, as shown by non-spherical three-dimensional shapes.
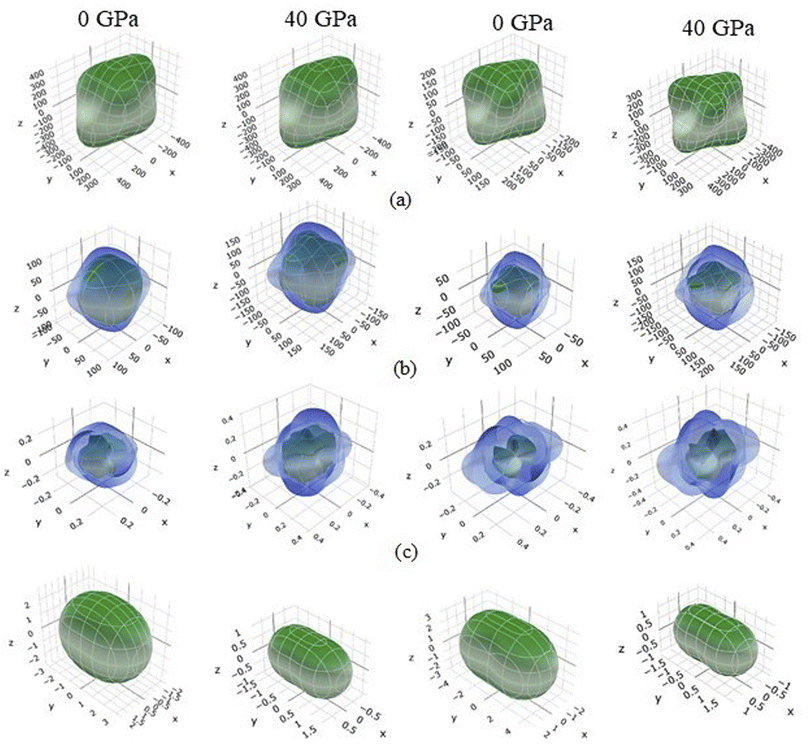 |
| | Fig. 5 3D contour plots of (a) Young's modulus, (b) shear modulus, (c) Poisson's ratio, and (d) linear compressibility at 0 and 40 GPa for topological semi-metal TaAs2 and TaSb2, respectively. | |
3.3 Electronic properties
Conduction and valence band electrons can be utilized in order to determine band diagrams of materials, which in turn reveals useful information about the solid's physiochemical properties. Inside the Brillouin zone, dispersion of electron energy along L–M–A–G–Z–V directions, have a substantial impact on their behavior. Fig. 6 and 7 illustrate the band structure of TaM2 (M = As, Sb) at 0 and 40 GPa pressure. Where dashed black line represents Fermi level (EF). The red circle in the band structure was covered to demonstrate the narrowing band gap from 0 to 40 GPa. These results indicate the Weyl semi metallic characteristics of our studied compound. Moreover, topological semimetals have surface states or Fermi arcs, which make it possible to make new electronic devices with high mobility and low dissipation.
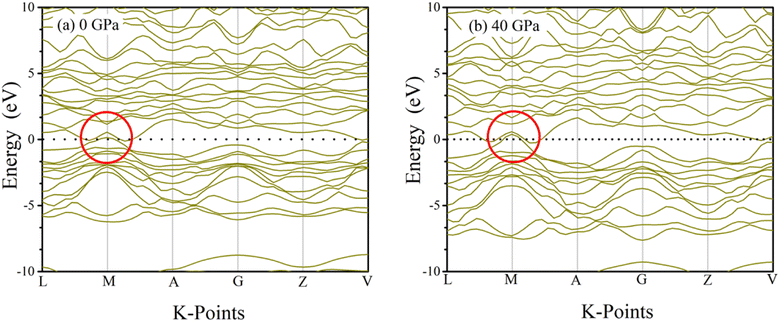 |
| | Fig. 6 Simulated electronic band structures of topological semi-metal TaAs2 at 0 and 40 GPa pressure. | |
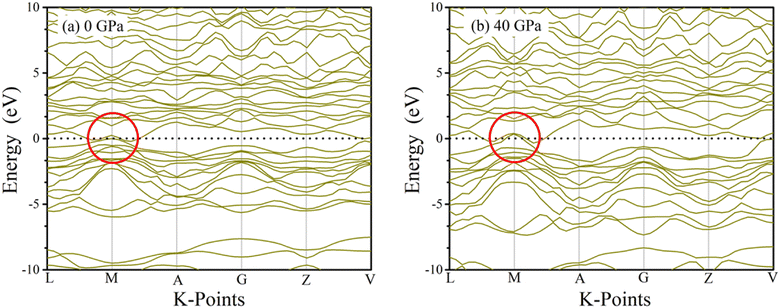 |
| | Fig. 7 Simulated electronic band structures of topological semi-metal TaSb2 at 0 and 40 GPa pressure. | |
TDOS is a crucial determinant of whether a material is metallic, superconducting, or insulating. Fig. S1 [see ESI†] shows the TDOS values from 10 to 40 GPa for topological semi-metal (a) TaAs2 and (b) TaSb2, respectively. The electronic properties of TaM2 are obtained TDOS and PDOS. At 0 GPa, computed TDOS value of TaAs2 is 0.33 states per eV per f.u., while 0.48 states per eV per f.u. for TaSb2. This value do not changes noticeably as the pressure increases. Fig. 8(a) and (b) display the determined TDOS and PDOS for TaM2 materials at 0 and 40 GPa pressures, respectively. The atomic contributions to band formation in these materials are clearly illustrated by the figures. According to DOS, n-type carriers are present in the studied materials,71 as the peak for the electron crossing at EF is very strong. Formation of DOS in the valence band near EF is primarily attributable to the Ta, As and Sb states. For TaAs2 the DOS of Ta, and As at EF at 0 GPa are ∼0.34, and ∼0.21 states per eV per f.u., respectively, and for TaSb2, Ta and Sb have DOS at EF at 0 GPa are ∼0.34 and ∼0.14 states per eV per f.u., respectively. For both materials, the DOS value do not significantly change as pressure is applied. This observation demonstrates that Ta and As atoms are the primary contributors to the formation of DOS at EF. The Ta-5d states significantly contribute to the energy of the valence band between 0 and −7.09 eV, while the As-4p and Sb-5p states also significantly contribute to this energy at 0 GPa. Both compounds have no discernible impact on their PDOS at 40 GPa.
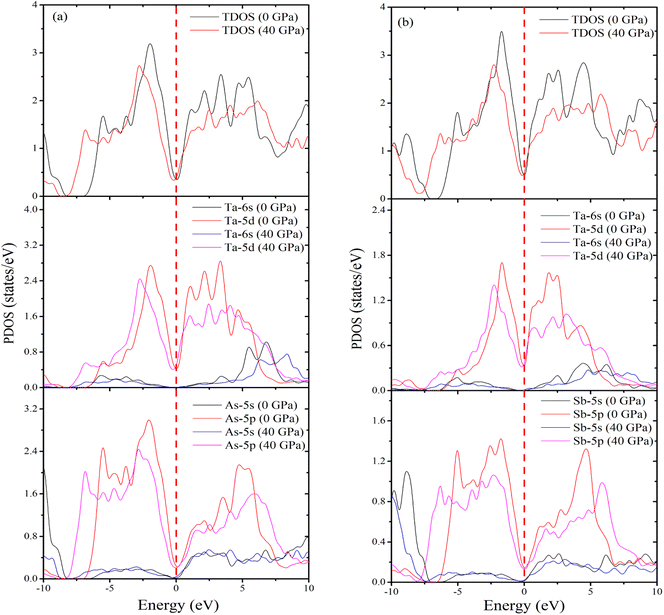 |
| | Fig. 8 Calculated (a) TDOS and PDOS (Ta and As) of TaAs2 and (b) TDOS and PDOS (Ta and Sb) of TaSb2 as a function of pressure. | |
3.4 Optical properties
The optical characteristics of a substance give essential details, especially for applications using optoelectronic components. The response of various materials to electromagnetic fields is an important area to study. Here we investigate the optical properties in response with photon energy. These properties include reflectivity (R), optical absorption (α), real (σ1) and imaginary (σ2) components of optical conductivity, real (n) and imaginary (k) components of refractive index, and real (ε1) and imaginary (ε2) parts of dielectric functions. This research is primarily concerned with the optical functions along the [100] polarization direction.
Absorption coefficients are used to calculate how much light is lost when travelling through various materials. In general, a material's transparency to radiation increases with decreasing absorption coefficient. Absorption of topological semi-metal TaAs2 and TaSb2 are shown in Fig. 9(a) and 10(a). There is an initial increase in optical absorption as the photon energy increases, a maximum value of about 8.82 eV and 8.07 eV for TaAs2 and TaSb2, respectively. It is interesting to observe that for photon energies more than or equal to 8.90 eV and 8.20 eV, as pressure is increased, a shift is seen in the absorption spectra, which favors greater energy.
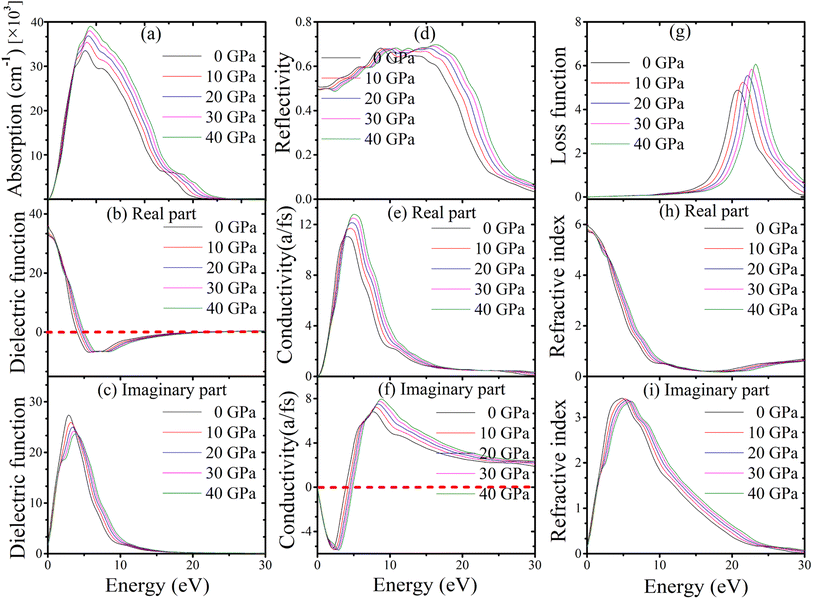 |
| | Fig. 9 (a) Absorption, (b and c) dielectric function, (d) reflectivity, (e and f) conductivity, (g) loss function, (h and i) refractive index of topological semi-metal TaAs2 in [100] direction as a function of pressure. | |
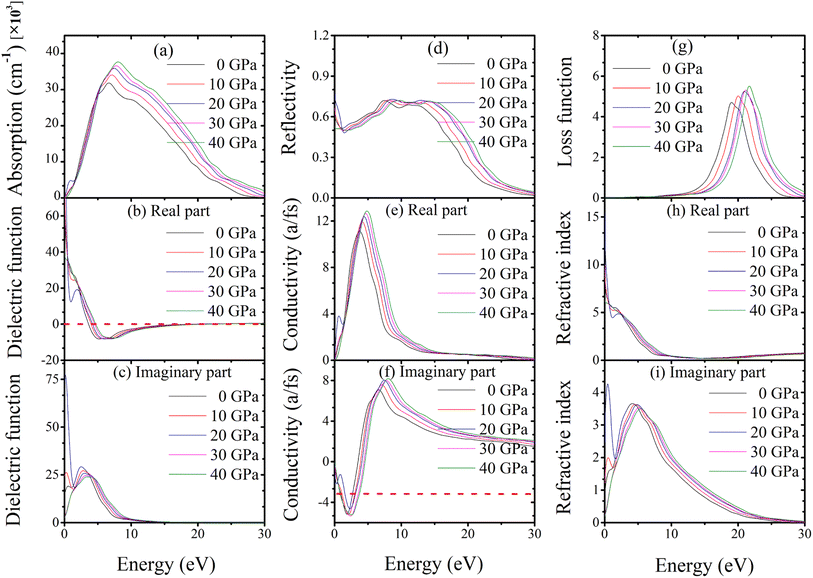 |
| | Fig. 10 (a) Absorption, (b and c) dielectric function, (d) reflectivity, (e and f) conductivity, (g) loss function, (h and i) refractive index of topological semi-metal TaSb2 in (100) direction, as a function of pressure. | |
In contrast to radiation, the dielectric function considers the actual and hypothetical permittivity properties of the materials against frequency. Dielectric functions (real and imaginary portions) as a function of pressure are shown in Fig. 9(b), (c), 10(b) and (c) up to 30 eV of photon energy for topological semi-metal TaAs2 and TaSb2, respectively. For TaAs2 the real part of dielectric function has a highest value ∼ 39.30 with zero photon energy and reduces gradually while rising the energy. In case of TaSb2, the highest dielectric constant value is ∼98.60 (real) at 0 eV, that also reduces with incident photon energy. However, in the high-energy area, the real and imaginary parts get close to zero for all of the compounds. In this region, TaAs2 acts similarly to other transparent materials. The substance's dielectric properties hardly change when applied with external pressures. The imaginary component of dielectric function intrinsically linked to the optical absorption profile.72 Because of how little pressure affects a dielectric's absorption spectra, dielectric functions are practically pressure-invariant.
The reflectivity curve provides crucial information regarding a material's suitability as a reflector. Fig. 9(d) and 10(d) show the reflectivity spectra up to 30 eV photon energy for TaM2 (M = As, Sb) material's under different applied pressures. For TaAs2 reflectivity starts with 0 eV and rises while increasing photon energy, reaching a highest value at ∼8.80 eV. It becomes flat towards 9–17 eV, which belongs to the UV area. Above 17 eV, it diminishes and eventually goes to zero. For TaSb2, the photon energy at which reflection is maximal is zero, and it decreases precipitously to its minimum at about 1.36 eV. After reaching a maximum at 7.67 eV, the reflectance remains constant throughout a large portion of the ultraviolet spectrum, from 8 to 16 eV, before decreasing at 16 eV. Based on these findings, TaM2 (M = As, Sb) can be used as an effective reflector throughout a broad spectrum of ultraviolet light.
The optical conductivity of topological semi-metal TaM2 (M = As, Sb) under different pressures up to 30 eV photon energies are shown in Fig. 9(e), (f), 10(e) and (f) in both real and imaginary portions respectively. The acquired optical photoconductivity spectra exhibit both a maximum and a minimum within the studied energy range. For TaAs2 and TaSb2, their highest values are at 5.25 eV and 4.70 eV, respectively, and at energies above 5.30 eV and 4.90 eV, i.e., conductivity changes to the greater energy area as a function of pressure. The conductivity then gradually decreases and drops to a minimum with rising photon energy. For both substances, the imaginary component of the conductivity follows the same behavior upon incoming radiation before flattening off at higher energies. According to this study, photon absorption improves the photoconductivity of TaM2 (M = As,![[thin space (1/6-em)]](https://www.rsc.org/images/entities/char_2009.gif) Sb) compounds.73
Sb) compounds.73
The loss function determines how much energy of an electron loses as it moves in the whole substance. Fig. 9(g) and 10(g) display the energy loss curve for TaM2 (M = As, Sb) compounds. The energy loss function shows how an electron loses energy as it moves quickly in a material.74 The maximum loss function is linked to the plasma oscillation and plasma frequency ωp.75 The maximum loss function for TaAs2 is found to be 23.23 eV for 40 GPa. Similarly, these value for TaSb2 is 21.75 eV at 40 GPa. The plasma frequency of TaM2 (M = As, Sb) molecules is inferred from these measurements. When the light's frequency is higher than the frequency of the plasma, the TaM2 materials become transparent. In addition, a metallic system's optical characteristics transform into a dielectric-like behavior above the plasma energy.76 As pressure rises, the peak of the loss function moves to a greater energy level. This makes it possible to study the optical reflectivity and absorption profile. When the peak moves to higher energies due to more pressure, the number of effective electrons for intraband and interband transitions gradually decreases.77 The refractive index of a material is a non-dimensional metric that is used to describe how fast light moves through it. The real portion of the refractive index is equivalent to the phase velocity, while the imaginary portion is similar to the extinction coefficient. Its imaginary portion also describes a material's dissipation of energy before complete absorption. The real and imaginary components of the refractive index for the topological semimetal TaM2 (M = As, Sb) are shown in Fig. 9(h), (i), 10(h) and (i) with zero photon energy, the real component of the refractive indices is found to have a maximum value of approximately 6.28 for TaAs2 and 15.27 for TaSb2. Above this energy, the real component declines and reaches a minimum value of about 18.06 and 12.57 before becoming flat for both substances in the upper energy area. In the imaginary parts, the refractive index values start to rise and reaches maximum values at 4.88 and 4.38 for TaAs2 and TaSb2, respectively. At a higher energy region, these values decrease and become flat.
3.5 Thermodynamic properties
Thermodynamic parameters play a crucial role in the study of modern solid-state physics and thermodynamic sciences.78 The melting point, bond strength, thermal expansion, specific heat, and elastic constants are only few of the numerous physical properties of materials that are intimately connected to the Debye temperature.79 It demonstrates how the crystal responds to vibration. Here, we use optimized crystal properties to determine the Debye temperature of the topological semi-metal TaM2 (M = As, Sb) under pressure. The θD can be measured via the equation:80| |
 | (20) |
Using the following equation, the average sound velocity υm can be calculated:81
| |
 | (21) |
The transverse sound velocity υt and longitudinal sound velocity υl can be determined using Navier's relation:82
| |
 | (22) |
and
| |
 | (23) |
here
h represent Planck's constant,
n represent the number of atoms in a molecule,
k represent Boltzmann's constant,
NA represent the Avogadro number,
ρ is the density of the solid,
M is the weight of the molecule, and
υm is the average speed of sound in a given medium.
The calculated values of ρ, υt, υl, and θD at various applied pressures are shown in Table S9.† From Table S9† it is evident that υt, υl, and θD rise with rising pressure for all the studied compounds, whereas for TaAs2 the vl (m s−1) and vm (m s−1) values slightly decrease at 20 GPa. The ground state density ρ, transverse velocity υt, longitudinal velocity υl, mean sound velocity vm, and Debye temperature θD of different topological semi-metals are listed in Table S10.† These values demonstrate a comparison between the results of this work and those obtained from simulations of several topological semi-metals. Fig. 11(a) and (b) shows the fluctuation in Debye temperature θD as a function of hydrostatic pressure. The predicted Debye temperature for both compounds was high, indicating that high melting points will be found.
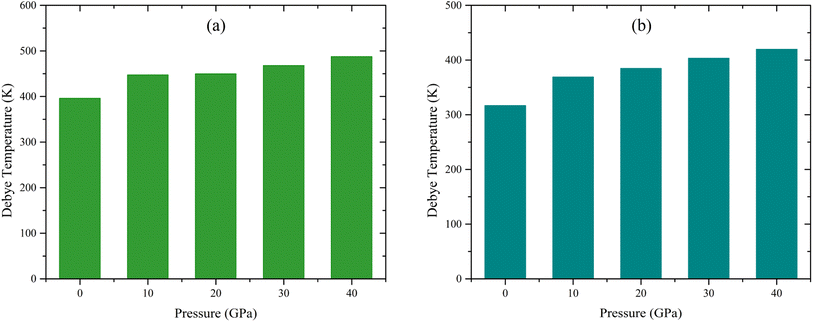 |
| | Fig. 11 Influence of pressure on Debye temperature, θD for (a) TaAs2 and (b) TaSb2 respectively. | |
4. Conclusion
In this work, we used first-principles DFT-based calculations in the generalized gradient approximation to study the topological semimetal TaM2 (M = As,![[thin space (1/6-em)]](https://www.rsc.org/images/entities/char_2009.gif) Sb) at pressures up to 40 GPa to look at a wide range of physical features (structural, elastic, mechanical, optical, electronic, and Debye temperatures). The lattice constants and the unit cell volume both decrease as the pressure is increased because of the decreasing interatomic distances. There is a strengthening of the ionic, covalent, and metallic bonding in compounds under pressure. The formation energy and Born stability criterion verified the mechanical and thermodynamic stability of the investigated molecules. As pressure increases, elastic constant values increase, making materials stiffer and more resistant to deformation, which can be employed in engineering applications. Poisson's and Pugh's ratio indicating both materials are brittle at ambient pressure but become increasingly ductile from 30 GPa to 40 GPa. The hardness value of both compounds improves with increasing pressures, but TaAs2 is significantly harder than TaSb2. Many direction-dependent characteristics of the compounds demonstrate their anisotropy (shear anisotropy, bulk anisotropy, equivalent Zener anisotropy, universal anisotropy). We also examine and explain several mechanical properties for all the studied compounds using the relevant formulas. Direction-dependent contour graphs show that pressure enhances TaM2 (M = As,
Sb) at pressures up to 40 GPa to look at a wide range of physical features (structural, elastic, mechanical, optical, electronic, and Debye temperatures). The lattice constants and the unit cell volume both decrease as the pressure is increased because of the decreasing interatomic distances. There is a strengthening of the ionic, covalent, and metallic bonding in compounds under pressure. The formation energy and Born stability criterion verified the mechanical and thermodynamic stability of the investigated molecules. As pressure increases, elastic constant values increase, making materials stiffer and more resistant to deformation, which can be employed in engineering applications. Poisson's and Pugh's ratio indicating both materials are brittle at ambient pressure but become increasingly ductile from 30 GPa to 40 GPa. The hardness value of both compounds improves with increasing pressures, but TaAs2 is significantly harder than TaSb2. Many direction-dependent characteristics of the compounds demonstrate their anisotropy (shear anisotropy, bulk anisotropy, equivalent Zener anisotropy, universal anisotropy). We also examine and explain several mechanical properties for all the studied compounds using the relevant formulas. Direction-dependent contour graphs show that pressure enhances TaM2 (M = As,![[thin space (1/6-em)]](https://www.rsc.org/images/entities/char_2009.gif) Sb) anisotropy. TaM2 (M = As, Sb) are Weyl semi-metals due to the small band gap between the valence and conduction bands, which makes it possible to make new electronic devices with high mobility and low dissipation. The DOS indicates a substantial peak for electron crossing at the Fermi level and pressure has no influence on it for both materials. With rising external pressure, absorption coefficient and reflectivity increase. The dielectric function hardly changes with the applied pressure. The reflectance remains constant across a large portion of the ultraviolet spectrum, making it a good reflector across a wide range of ultraviolet light. For both compounds, an increase in pressure causes a rise in the measured density, sound velocity and the Debye temperature, signifying a strengthening of the covalent bonds. As a result, this analysis suggests that applying pressure is a thermodynamically efficient and ecologically favorable way to change material's physical characteristics for the advancement of electrical and spintronic applications.
Sb) anisotropy. TaM2 (M = As, Sb) are Weyl semi-metals due to the small band gap between the valence and conduction bands, which makes it possible to make new electronic devices with high mobility and low dissipation. The DOS indicates a substantial peak for electron crossing at the Fermi level and pressure has no influence on it for both materials. With rising external pressure, absorption coefficient and reflectivity increase. The dielectric function hardly changes with the applied pressure. The reflectance remains constant across a large portion of the ultraviolet spectrum, making it a good reflector across a wide range of ultraviolet light. For both compounds, an increase in pressure causes a rise in the measured density, sound velocity and the Debye temperature, signifying a strengthening of the covalent bonds. As a result, this analysis suggests that applying pressure is a thermodynamically efficient and ecologically favorable way to change material's physical characteristics for the advancement of electrical and spintronic applications.
Conflicts of interest
The authors declare no conflict of interests.
Acknowledgements
The authors are grateful to the Pabna University of Science and Technology, Bangladesh for partly financial support during this research work.
References
- A. A. Burkov, Nat. Mater., 2016, 15, 1145–1148 CrossRef CAS PubMed.
- A.-Q. Wang, Y. Xing-Guo, Y. Da-Peng and Z.-M. Liao, ACS Nano, 2020, 14, 3755–3778 CrossRef CAS PubMed.
- K. Kirshenbaum, P. S. Syers, A. P. Hope, N. P. Butch, J. R. Jeffries, S. T. Weir, J. J. Hamlin, M. B. Maple, Y. K. Vohra and J. Paglione, Phys. Rev. Lett., 2013, 111, 087001 CrossRef.
- Y. P. Qi, P. G. Naumov, M. N. Ali, C. R. Rajamathi, W. Schnelle, O. Barkalov, M. Hanfland, S. C. Wu, C. Shekhar and Y. Sun, et al., Nat. Commun., 2016, 7, 11038 CrossRef CAS PubMed.
- D. F. Kang, Y. Z. Zhou, W. Yi, C. L. Yang, J. Guo, Y. G. Shi, S. Zhang, Z. Wang, C. Zhang and S. Jiang, et al., Nat. Commun., 2015, 6, 7804 CrossRef PubMed.
- L. P. He, Y. T. Jia, S. J. Zhang, X. C. Hong, C. Q. Jin and S. Y. Li, npj Quantum Mater., 2016, 1, 16014 CrossRef.
- Shruti, V. K. Maurya, P. Neha, P. Srivastava and S. Patnaik, et al., Phys. Rev. B: Condens. Matter Mater. Phys., 2015, 92, 020506 CrossRef.
- Y. S. Hor, A. J. Williams, J. G. Checkelsky, P. Roushan, J. Seo, Q. Xu, H. W. Zandbergen, A. Yazdani, N. P. Ong and R. J. Cava, Phys. Rev. Lett., 2010, 104, 057001 CrossRef CAS.
- J. P. Xu, M. X. Wang, Z. L. Liu, J. F. Ge, X. Yang, C. Liu, Z. A. Xu, D. Guan, C. L. Gao and D. Qian, et al., Phys. Rev. Lett., 2015, 114, 017001 CrossRef CAS PubMed.
- H. H. Sun, K. W. Zhang, L. H. Hu, C. Li, G. Y. Wang, H. Y. Ma, Z. A. Xu, C. L. Gao, D. D. Guan and Y. Y. Li, et al., Phys. Rev. Lett., 2016, 116, 257003 CrossRef.
- L. Aggarwal, A. Gaurav, G. S. Thakur, Z. Haque, A. K. Ganguli and G. Sheet, Nat. Mater., 2016, 15, 32 CrossRef CAS PubMed.
- H. Wang, H. C. Wang, H. W. Liu, H. Lu, W. H. Yang, S. Jia, X. J. Liu, X. C. Xie, J. Wei and J. Wang, Nat. Mater., 2016, 15, 38 CrossRef CAS PubMed.
- L. Aggarwal, S. Gayen, S. Das, R. Kumar, V. Süβ, C. Felser, C. Shekhar and G. Sheet, Nat. Commun., 2017, 8, 13974 CrossRef CAS.
- H. Wang, H. C. Wang, Y. Q. Chen, J. W. Luo, Z. J. Yuan, J. Liu, Y. Wang, S. Jia, X. J. Liu and J. Wei, et al., Sci. Bull., 2017, 62, 425 CrossRef CAS PubMed.
- X. Y. Hou, Y. D. Gu, S. J. Li, L. X. Zhao, W. L. Zhu, Z. Wang, M. D. Zhang, F. Zhang, L. Zhang and H. Zi, et al., Phys. Rev. B, 2020, 101, 134503 CrossRef CAS.
- J. W. Luo, Y. N. Li, J. C. Li, T. Hashimoto, T. Kawakami, H. Lu, S. Jia, M. Sato and J. Wang, Phys. Rev. Mater., 2019, 3, 12420 Search PubMed.
- X. Y. Hou, Z. Wang, Y. D. Gu, J. B. He, D. Chen, W. L. Zhu, M. D. Zhang, F. Zhang, Y. F. Xu and S. Zhang, et al., Phys. Rev. B, 2019, 100, 235109 CrossRef CAS.
- L. Aggarwal, C. K. Singh, M. Aslam, R. Singha, A. Pariari, S. Gayen, M. Kabir, P. Mandal and G. Sheet, J. Phys.: Condens. Matter, 2019, 31, 485707 CrossRef CAS PubMed.
- A. Sufyan and J. A. Larsson, ACS Omega, 2023, 8, 9607–9613 CrossRef CAS PubMed.
- C. C. Xu, J. Chen, G. X. Zhi, Y. K. Li, J. H. Dai and C. Cao, Phys. Rev. B, 2016, 93, 195106 CrossRef.
- Y. Qi, et al., Nat. Commun., 2015, 7, 11038 CrossRef PubMed.
- D. Kang, Y. Zhou, W. Yi, C. Yang, J. Guo, Y. Shi, S. Zhang, Z. Wang, C. Zhang, S. Jiang and A. Li, Nat. Commun., 2015, 6, 7804 CrossRef PubMed.
- X. C. Pan, X. Chen, H. Liu, Y. Feng, Z. Wei, Y. Zhou, Z. Chi, L. Pi, F. Yen, F. Song and X. Wan, Nat. Commun., 2015, 6, 7805 CrossRef.
- L. P. He, et al., npj Quantum Mater., 2016, 1, 16014 CrossRef.
- Y. Zhou, J. Wu, W. Ning, N. Li, Y. Du, X. Chen, R. Zhang, Z. Chi, X. Wang, X. Zhu and P. Lu, Proc. Natl. Acad. Sci. U. S. A., 2016, 113, 2904–2909 CrossRef CAS PubMed.
- K. Kirshenbaum, et al., Phys. Rev. Lett., 2013, 111, 087001 CrossRef PubMed.
- J. L. Zhang, et al., Proc. Natl. Acad. Sci. U. S. A., 2011, 108, 24–28 CrossRef CAS.
- J. Zhu, et al., Sci. Rep., 2013, 3, 2016 CrossRef CAS PubMed.
- D. S. Wu, J. Liao, W. Yi, X. Wang, P. G. Li, H. M. Weng, Y. G. Shi, Y. Q. Li, J. L. Luo and X. Dai, et al., Appl. Phys. Lett., 2016, 108, 042105 CrossRef.
- Y. K. Luo, R. D. McDonald, P. F. S. Rosa, B. Scott, N. Wakeham, N. J. Ghimire, E. D. Bauer, J. D. Thompson and F. Ronning, Sci. Rep., 2016, 6, 27294 CrossRef CAS PubMed.
- Z. J. Yuan, H. Lu, Y. J. Liu, J. F. Wang and S. Jia, Phys. Rev. B, 2016, 93, 184405 CrossRef.
- Y. Y. Wang, Q. H. Yu, P. J. Guo, K. Liu and T. L. Xia, Phys. Rev. B, 2016, 94, 041103 CrossRef.
- B. Shen, X. Y. Deng, G. Kotliar and N. Ni, Phys. Rev. B, 2016, 93, 195119 CrossRef.
- Y. P. Li, C. An, C. Q. Hua, X. L. Chen, Y. H. Zhou, Y. Zhou, R. R. Zhang, C. Y. Park, Z. Wang and Y. H. Lu, et al., npj Quantum Mater., 2018, 3, 58 CrossRef.
- D. Gresch, Q. Wu, G. W. Winkler and A. A. Soluyanov, New J. Phys., 2017, 19, 035001 CrossRef.
- Y. Li, C. An, C. Hua, X. Chen, Y. Zhou, Y. Zhou, R. Zhang, C. Park, Z. Wang, Y. Lu and Y. Zheng, npj Quantum Mater., 2018, 3, 58 CrossRef.
- S. J. Clark, et al., Kristallogr, 2005, 220, 567 CAS.
- J. P. Perdew, K. Burke and M. Ernzerhof, Phys. Rev. Lett., 1996, 77, 3865 CrossRef CAS.
- H. J. Monkhorst and J. D. Pack, Phys. Rev. B: Solid State, 1976, 13, 5188 CrossRef.
- T. H. Fischer and J. Almlof, J. Phys. Chem., 1952, 96, 9768 CrossRef.
- K. Momma and F. Izumi, J. Appl. Crystallogr., 2011, 44, 1272–1276 CrossRef CAS.
- R. Golesorkhtabar, P. Pavone, J. Spitaler, P. Puschnig and C. Draxl, Comput. Phys. Commun., 2013, 184, 1861–1873 CrossRef CAS.
- M. L. Ali, M. M. Billah, M. N. M. Nobin and M. Z. Rahaman, AIP Adv., 2023, 13, 065110 CrossRef CAS.
- S. Furuseth, K. Selte and A. Kjekshus, Acta Chem. Scand., 1965, 19, 95–106 CrossRef CAS.
- Y. Luo, R. D. McDonald, P. F. S. Rosa, B. Scott, N. Wakeham, N. J. Ghimire, E. D. Bauer, J. D. Thompson and F. Ronning, Sci. Rep., 2016, 6, 1–7 CrossRef PubMed.
- C. Xu, J. Chen, G. Zhi, Y. Li, J. Dai and C. Cao, Phys. Rev. B, 2016, 93, 195106 CrossRef.
- C. Xu, J. Chen, G. X. Zhi, Y. Li, J. Dai and C. Cao, Phys. Rev. B, 2016, 93, 195106 CrossRef.
- Y. Zhou, C. Gu, X. Chen, Y. Zhou, C. An and Z. Yang, J. Solid State Chem., 2018, 265, 359–363 CrossRef CAS.
- Y. Li, L. Li, J. Wang, T. Wang, X. Xu, C. Xi, C. Cao and J. Dai, Phys. Rev. B, 2016, 94, 121115 CrossRef.
- Y. Pan, Y. Lin, G. Liu and J. Zhang, Vacuum, 2020, 174, 109203 CrossRef CAS.
- M. M. Wu, L. Wen, B. Y. Tang, L. M. Peng and W. J. Ding, J. Alloys Compd., 2010, 1, 412–417 CrossRef.
- J. F. Nye, Propriétés Physiques des Matériaux, Dunod, Paris, 1961 Search PubMed.
- Q. J. Liu, N. C. Zhang, F. S. Liu and Z. T. Liu, Chin. Phys. B, 2014, 23, 047101 CrossRef.
- W. F. Hosford, The mechanics of crystals and textured polycrystals, Oxford University Press, USA, 1993, p. 248 Search PubMed.
- J. F. Nye, Physical properties of crystals, Oxford University Press, Oxford, 1985 Search PubMed.
- D. H. Chung and W. R. Buessem, J. Appl. Phys., 1968, 39, 2777–2782 CrossRef CAS.
- P. Ravindran, L. Fast, P. A. Korzhavyi, B. Johansson, J. Wills and O. Eriksson, J. Appl. Phys., 1998, 84, 4891–4904 CrossRef CAS.
- J. R. Xiao, B. A. Gama and J. W. Gillespie Jr, Int. J. Solids Struct., 2005, 42, 3075–3092 CrossRef.
- O. N. Senkov and D. B. Miracle, Sci. Rep., 2021, 11, 4531 CrossRef CAS PubMed.
- M. Faizan, et al, Bull. Mater. Sci., 2016, 39, 1419–1425 CrossRef CAS.
- M. I. Naher and S. H. Naqib, Results Phys., 2022, 37, 105505 CrossRef.
- S. I. Ranganathan and M. Ostoja-Starzewski, Phys. Rev. Lett., 2008, 101, 055504 CrossRef PubMed.
- I. N. Frantsevich, F. F. Voronov, and S. A. Bakuta, Elastic Cons. and Elastic Modu. Meta. and Nonmeta., 1982, p. 286 Search PubMed.
- M. I. Naher and S. H. Naqib, Results Phys., 2022, 37, 105505 CrossRef.
- C. M. Kube, AIP Adv., 2016, 6, 095209 CrossRef.
- M. Hasan, S. Nasrin, M. N. Islam and A. A. Hossain, AIP Adv., 2022, 12, 085327 CrossRef CAS.
- S. Y. Liu, S. Zhang, S. Liu, D. J. Li, Y. Li and S. Wang, J. Eur. Ceram. Soc., 2021, 41, 6267–6274 CrossRef CAS.
- Z. Sun, D. Music, R. Ahuja and J. M. Schneider, Phys. Rev. B: Condens. Matter Mater. Phys., 2005, 71, 193402 CrossRef.
- R. Gaillac, P. Pullumbi and F. X. Coudert, J. Phys.: Condens. Matter, 2016, 28, 275201 CrossRef PubMed.
- A. Biswas, M. S. Alam, A. Sultana, T. Ahmed, M. Saiduzzaman and K. M. Hossain, Appl. Phys. A, 2021, 127, 939 CrossRef CAS.
- N. P. Armitage, P. Fournier and R. L. Greene, Rev. Mod. Phys., 2010, 82, 2421 CrossRef CAS.
- J. Islam and A. A. Hossain, J. Alloys Compd., 2021, 868, 159199 CrossRef CAS.
- J. Sun, X. F. Zhou, Y. X. Fan, J. Chen, H. T. Wang, X. Guo, J. He and Y. Tian, Phys. Rev. B: Condens. Matter Mater. Phys., 2006, 73, 045108 CrossRef.
- F. Parvin, M. A. Hossain, M. S. Ali and A. K. M. A. Islam, Phys. B, 2015, 457, 320–325 CrossRef CAS.
- J. K. Satyam and S. M. Saini, Mater. Today: Proc., 2021, 44, 3040–3044 CrossRef.
- F. Parvin and S. H. Naqib, Results Phys., 2021, 21, 103848 CrossRef.
- N. Erum and M. A. Iqbal, Mater. Res. Express, 2017, 4, 126311 CrossRef.
- P. J. Hasnip, K. Refson, M. I. J. Probert, J. R. Yates, S. J. Clark and C. J. Pickard, Philos. Trans. R. Soc., A, 2014, 372, 20130270 CrossRef PubMed.
- L. Qi, et al., J. Alloys Compd., 2015, 621, 383 CrossRef CAS.
- S. Aydin and M. Simsek, Phys. Rev., 2009, 80, 134107 CrossRef.
- O. L. Anderson, J. Phys. Chem. Solids, 1963, 24, 909 CrossRef CAS.
- E. Screiber, O. L. Anderson and N. Soga, Elastic Const. and Meas., 1973, pp. 747–748 Search PubMed.
|
| This journal is © The Royal Society of Chemistry 2023 |
Click here to see how this site uses Cookies. View our privacy policy here.  Open Access Article
 *
*


![[thin space (1/6-em)]](https://www.rsc.org/images/entities/char_2009.gif) Sb) compounds.73
Sb) compounds.73


![[thin space (1/6-em)]](https://www.rsc.org/images/entities/char_2009.gif) Sb) at pressures up to 40 GPa to look at a wide range of physical features (structural, elastic, mechanical, optical, electronic, and Debye temperatures). The lattice constants and the unit cell volume both decrease as the pressure is increased because of the decreasing interatomic distances. There is a strengthening of the ionic, covalent, and metallic bonding in compounds under pressure. The formation energy and Born stability criterion verified the mechanical and thermodynamic stability of the investigated molecules. As pressure increases, elastic constant values increase, making materials stiffer and more resistant to deformation, which can be employed in engineering applications. Poisson's and Pugh's ratio indicating both materials are brittle at ambient pressure but become increasingly ductile from 30 GPa to 40 GPa. The hardness value of both compounds improves with increasing pressures, but TaAs2 is significantly harder than TaSb2. Many direction-dependent characteristics of the compounds demonstrate their anisotropy (shear anisotropy, bulk anisotropy, equivalent Zener anisotropy, universal anisotropy). We also examine and explain several mechanical properties for all the studied compounds using the relevant formulas. Direction-dependent contour graphs show that pressure enhances TaM2 (M = As,
Sb) at pressures up to 40 GPa to look at a wide range of physical features (structural, elastic, mechanical, optical, electronic, and Debye temperatures). The lattice constants and the unit cell volume both decrease as the pressure is increased because of the decreasing interatomic distances. There is a strengthening of the ionic, covalent, and metallic bonding in compounds under pressure. The formation energy and Born stability criterion verified the mechanical and thermodynamic stability of the investigated molecules. As pressure increases, elastic constant values increase, making materials stiffer and more resistant to deformation, which can be employed in engineering applications. Poisson's and Pugh's ratio indicating both materials are brittle at ambient pressure but become increasingly ductile from 30 GPa to 40 GPa. The hardness value of both compounds improves with increasing pressures, but TaAs2 is significantly harder than TaSb2. Many direction-dependent characteristics of the compounds demonstrate their anisotropy (shear anisotropy, bulk anisotropy, equivalent Zener anisotropy, universal anisotropy). We also examine and explain several mechanical properties for all the studied compounds using the relevant formulas. Direction-dependent contour graphs show that pressure enhances TaM2 (M = As,![[thin space (1/6-em)]](https://www.rsc.org/images/entities/char_2009.gif) Sb) anisotropy. TaM2 (M = As, Sb) are Weyl semi-metals due to the small band gap between the valence and conduction bands, which makes it possible to make new electronic devices with high mobility and low dissipation. The DOS indicates a substantial peak for electron crossing at the Fermi level and pressure has no influence on it for both materials. With rising external pressure, absorption coefficient and reflectivity increase. The dielectric function hardly changes with the applied pressure. The reflectance remains constant across a large portion of the ultraviolet spectrum, making it a good reflector across a wide range of ultraviolet light. For both compounds, an increase in pressure causes a rise in the measured density, sound velocity and the Debye temperature, signifying a strengthening of the covalent bonds. As a result, this analysis suggests that applying pressure is a thermodynamically efficient and ecologically favorable way to change material's physical characteristics for the advancement of electrical and spintronic applications.
Sb) anisotropy. TaM2 (M = As, Sb) are Weyl semi-metals due to the small band gap between the valence and conduction bands, which makes it possible to make new electronic devices with high mobility and low dissipation. The DOS indicates a substantial peak for electron crossing at the Fermi level and pressure has no influence on it for both materials. With rising external pressure, absorption coefficient and reflectivity increase. The dielectric function hardly changes with the applied pressure. The reflectance remains constant across a large portion of the ultraviolet spectrum, making it a good reflector across a wide range of ultraviolet light. For both compounds, an increase in pressure causes a rise in the measured density, sound velocity and the Debye temperature, signifying a strengthening of the covalent bonds. As a result, this analysis suggests that applying pressure is a thermodynamically efficient and ecologically favorable way to change material's physical characteristics for the advancement of electrical and spintronic applications.


