DOI:
10.1039/D3RA02246C
(Paper)
RSC Adv., 2023,
13, 22101-22112
Study on qualitative identification of aflatoxin solution based on terahertz metamaterial enhancement
Received
5th April 2023
, Accepted 6th July 2023
First published on 24th July 2023
Abstract
Aflatoxin is the main carcinogen that contaminates agricultural products and foods such as peanuts and corn. There are many kinds of aflatoxins, mainly including aflatoxin B1 (AFB1), aflatoxin B2 (AFB2), aflatoxin G1 (AFG1) and aflatoxin G2 (AFG2). Different types of aflatoxins have different toxicity and different levels of contamination to agricultural products as well as food. Therefore, the rapid, non-destructive and highly sensitive qualitative identification of aflatoxin species is of great significance to maintain people's life and health. The conventional terahertz detection method can only qualitatively identify the samples at the milligram level, but it is not suitable for the qualitative analysis of trace samples. In this paper, a terahertz metamaterial sensor with “X” composite double-peak structure was designed based on electromagnetic theory to investigate the feasibility of THz-TDS technology based on a metamaterial sensor for the qualitative identification of trace aflatoxin B2, G1 and G2 solutions. Firstly, the terahertz transmission spectra of eight different concentrations of aflatoxin B2, G1 and G2 were collected respectively, and then the differences of terahertz transmission spectra of different aflatoxin species were investigated. Finally, the terahertz transmission spectra of aflatoxin B2, G1 and G2 solutions were modeled and analyzed using chemometric methods. It was found that there were significant differences in the transmission peak curves of different kinds of aflatoxin. Through the comparative analysis of different models, it was concluded that the prediction accuracy of the CARS-RBF-SVM model was the highest, and the accuracy of the calibration set reached 100%. 119 out of 120 predicted samples were correctly predicted, and the prediction accuracy was 99.17%. This study verified the feasibility of qualitative identification of trace aflatoxin B2, G1 and G2 solutions by a metamaterial sensor based on the “X” composite double-peak structure combined with THz-TDS technology, and provided a theoretical basis and a new detection method for the qualitative identification of trace aflatoxins. This will facilitate the rapid, non-destructive and highly sensitive qualitative detection of different kinds of aflatoxins in food and agricultural products. At the same time, this study has important implications for promoting the qualitative detection of other trace substances.
1 Introduction
Food safety issues matter a lot to social stability and people's daily life. Among the food safety issues, food safety on contamination by aflatoxin has become a global problem. Aflatoxins (AFs) are a group of harmful mycotoxins produced by Aspergillus flavus that can contaminate both water and food at the same time. Aflatoxin has been reported to cause hepatocellular carcinoma, Reye's syndrome and chronic hepatitis, thus causing serious harm to the human body.1,2 There are several derivatives of aflatoxin, and the most common and toxic ones are aflatoxin B1 (AFB1), aflatoxin B2 (AFB2), aflatoxin G1 (AFG1) and aflatoxin G2 (AFG2).3,4 In 1993, aflatoxin was classified as a Class I carcinogen by the International Agency for Research on Cancer (IARC), and this highly toxic carcinogen mainly contaminates agricultural products such as peanuts, corn and grains, thus causing mold and spoilage of these foods.5
By accidently consuming aflatoxin-contaminated agricultural products and foods, people will suffer from cellular lesions in their bodies, which can seriously endanger their health. In order to address the aflatoxin contamination of agricultural products and food, many countries have implemented strict supervision and control on the content of aflatoxin in agricultural products and food.6 The relevant laws of the federal government of the United States stipulate that the content of aflatoxin (the total amount of B1, B2, G1 and G2) in food for human consumption and feed for cows cannot exceed 15 μg kg−1, the content in milk for human consumption cannot exceed 0.5 μg kg−1, and the content in feed for other animals cannot exceed 300 μg kg−1. EU countries set more stringent regulations that the limit of aflatoxin B1 in peanuts and nuts and their processed products and all cereals and processed products is 2.0 μg kg−1, the limit of M1 in raw milk, heat-treated milk and processed milk products is 0.050 μg kg−1, and the limit of M1 in infant food (including infant milk) is 0.025 μg kg−1. In order to prevent aflatoxin contamination of food, relevant departments in China have issued relevant standards and regulatory measures to strictly limit the content of aflatoxin in different foods.
At present, the commonly used physical and chemical analysis methods for the detection of aflatoxin at home and abroad include Thin Layer Chromatography (TLC),7 High Performance Liquid Chromatography (HPLC),8 enzyme-linked immunosorbent assay (Elisa),9 electrochemical method10 and so on. Although these physical and chemical analysis methods have high sensitivity for the detection of aflatoxin, they have some disadvantages, such as high detection cost, long detection period, poor experimental repeatability, complicated and tedious experimental procedures and damage to experimental samples. In recent years, many scholars have been searching for spectroscopic techniques for the qualitative and quantitative analysis of aflatoxin in food, including near infrared spectroscopy (NIR), fluorescence spectroscopy, Raman spectra and multi-spectral techniques.11–13 However, although NIR has the advantages of high detection efficiency and non-destructiveness, and can realize the quantitative detection of aflatoxin, it is still insufficient in the precision and sensitivity of quantitative analysis of aflatoxin, which cannot meet the international requirements. Although the fluorescence spectrum technology has the characteristics of fast analysis speed and high analytical precision, it is subject to more factors of interference. Although SERS (Surface Enhancement of Raman Scattering) can be used to enhance Raman spectra, the enhancement conditions are very harsh, and the selection and preparation of enhanced substrates are difficult. Therefore, the search for a rapid, non-destructive and highly sensitive method for the detection of trace aflatoxin in food has always been the focus of attention in the field of food safety and a hot spot for research by scholars at home and abroad.
The terahertz (THz) spectrum range lies between microwave (MV) radiation and infrared (IR) radiation (frequency range from 0.1 to 10 THz).14,15 Therefore, its excellent properties such as small photon energy, high resolution, and rich optical parameters provide a theoretical basis for the application of terahertz spectroscopy to the detection of biological and chemical molecules.16,17 In recent years, some experts and scholars have successively used terahertz spectroscopy to carry out relevant research in the fields of biological and chemical molecules.18 However, as the research progressed, it is found that it is difficult to adopt the conventional terahertz spectroscopy to detect highly toxic and hazardous trace substances.19 This may be due to the weak interaction between trace samples and terahertz waves, which limits the detection sensitivity of terahertz spectroscopy.20 In order to enhance the detection of trace components, terahertz metamaterial sensors have become to arouse the attention of scholars.
Terahertz metamaterials have been widely used in highly sensitive terahertz detection of biological and chemical molecules due to their unique electromagnetic response. In 2020, Li et al.21 designed a three-dimensional full-band terahertz metamaterial based on electromagnetic theory to detect norfloxacin antibiotic residues in food matrices, and the detection limit was 0.01 μg ml−1. In 2020, Zhao et al.22 proposed and designed a terahertz biosensor based on metamaterials, and used the metamaterials combined with THz-TDS technology to achieve high sensitivity identification of AFB1 and AFB2. Wang et al.23 used an all-metal metamaterial terahertz biosensor for the detection of bovine serum proteins in 2021, and the detection limit was 0.035 mg ml−1. In 2022, Zhu et al.24 proposed a metamaterial sensor composed of a graphene four-open square ring and a golden hemisphere, and combined with THz-TDS technology to identify four amino acids of proline, glycine, arginine and methionine, and the recognition accuracy reached 100%. In 2022, Hu et al.25 designed a terahertz enhanced metamaterial absorber based on the electromagnetic theory and applied it to the effective detection of benzoic acid samples. The detection limit of benzoic acid was 2.36 × 10⁻⁵ g ml−1, which promoted the rapid detection of benzoic acid additives in food and was of great significance for promoting the detection and analysis of trace additives in food.
In this paper, an “X” composite terahertz metamaterial sensor was designed based on electromagnetic theory to investigate the feasibility of THz-TDS technology based on metamaterial sensor for qualitative identification of trace aflatoxin B2, G1 and G2 solutions. Firstly, the terahertz transmission spectra of different concentrations of aflatoxin B2, G1 and G2 were collected, and then the differences between the THz-TDS spectra of different categories of aflatoxin were analyzed. Finally, the terahertz transmission spectra of aflatoxin B2, G1 and G2 solutions were modeled and analyzed by pattern recognition method, so as to realize the rapid, non-destructive and highly sensitive qualitative identification of trace aflatoxin B2, G1 and G2 solutions.
2 Materials and methods
2.1 Design and fabrication of metamaterials
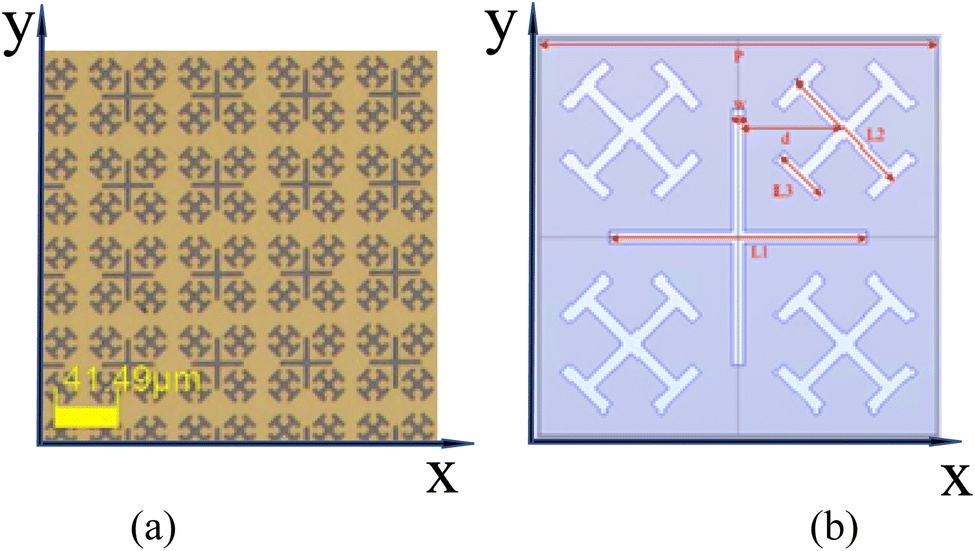
In this study, the Finite Difference Time Domain (FDTD) method was used to design the structural parameters of metamaterial absorbers.26 Where the metamaterial is illuminated by a normally incident EM wave along z-axis with E-field along x-direction, and periodic boundary conditions are applied in x- and y-directions to improve the simulation speed during the simulation. Fig. 1(a) shows the scanning electron microscope under the optical microscope, and Fig. 1(b) shows the specific size parameters of the “X” composite terahertz metamaterial micro–nanostructure. The period (P) is 60 μm, the coating metal is gold, the large cross length L1 is 30 μm, the small cross length L2 is 25 μm, the cross-frame length L3 is 12 μm, the width (W) is 2 μm, the distance (d) is 15 μm, and the silicon substrate (refractive index is 3.335).
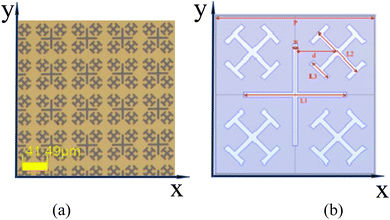 |
| | Fig. 1 Terahertz metamaterial structure: (a) scanning electron microscope image under optical microscope; (b) specific size of structure. | |
The metamaterial chips were processed by four-inch double polished silicon and glass wafers. The whole processing process includes coating, pretreatment, homogenization, pre-baking, developing, gluing, hardening film, etching and stripping. The specific steps are shown as follows:
① Coating: 5 nm chromium and 100 nm gold were plated on the surface of the silicon substrate with the aim of enhancing the adhesion between the gold and the silicon substrate. ② Pretreatment: after the metal deposition, the HMDS oven was used for pretreatment, and the oven temperature was set at 120 °C for 10 minutes. The main purpose of the pretreatment was to increase the adhesion of the photoresist and the silicon substrate.③ Homogenization: the photoresist AZ6112 dropped on the surface of silicon substrate was spread out by using a homogenizing machine at a rotational speed of 600 rpm, followed by a uniform film formation at 4000 rpm, and then the film was uniformly formed and reached a thickness of 1–2 μm. ④ Pre-baking: the temperature and time of pre-baking were set to 100 °C and 120 s respectively. ⑤ Developing: the 3038 developer with a concentration of 2.38% was used for manual development for 35 seconds. ⑥ Gluing: the power of the gluing machine was set to 200 W and the time was 3 minutes, with the purpose of removing the residual glue on the surface and ensuring the etching effect in the later stage. ⑦ Hardening film: the purpose of baking on a hot plate at 110 °C for 120 seconds is to increase the etching resistance of the photoresist mask to facilitate subsequent etching. ⑧ Etching: IBE etching was used, that is, a certain concentration of ion beam is used to bombard the surface of the sample to achieve the purpose of etching. ⑨ Stripping: after etching, acetone was used for ultrasonic extraction for 1 hour to remove the photoresist mask. After degumming, a microscope was used to observe whether the photoresist mask was completely removed. If it was not completely removed, it was necessary to continue to be placed into acetone solution for ultrasound until the photoresist mask was completely removed.
In this paper, the full-wave simulation of the “X” composite double-peak structure terahertz metamaterial sensor was carried out by using FDTD solutions. Fig. 2 shows the spatial distribution of electric field intensity around terahertz metamaterials with the “X” composite double-peak structure calculated by FDTD. Fig. 2(a) shows the spatial distribution of the electric field intensity at 1.42 THz, and Fig. 2(b) shows the spatial distribution of the electric field intensity at 2.0 THz. The electric field intensity changes from small to large from blue to red, that is, the largest dark red represents the maximum electric field intensity at this position. The region with the largest electric field intensity is called terahertz hot spot.27 In the research related to terahertz, it tends to produce larger signal enhancement. The analysis of the simulation results can provide a theoretical basis for the selection of the optimal excitation frequency.
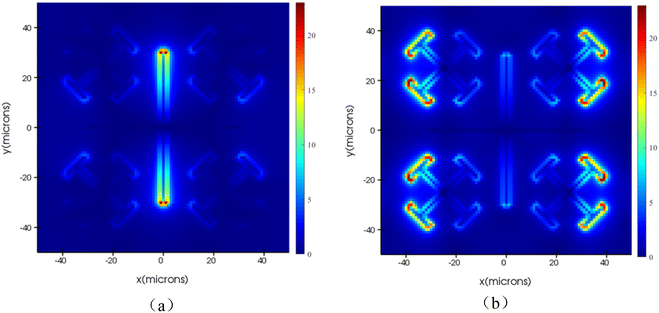 |
| | Fig. 2 Electromagnetic field distribution of metamaterial structure simulated by FDTD: (a) spatial distribution of electric field intensity at 1.42 THz; (b) spatial distribution of electric field intensity at 2.0 THz. | |
2.2 Detection of aflatoxin concentration in solution based on metamaterial
2.2.1 Sample preparation. In this paper, three kinds of aflatoxin standard solutions B2, G1 and G2 were selected. These three kinds of aflatoxin were purchased from Aladdin Reagent Network (https://www.aladdin-e.com/), and the concentration of standard solutions were 25 μg ml−1 (0.025 ml mg−1). In order to better identify the types of trace aflatoxin B2, G1 and G2, a pipette gun was used to aspirate ultra-pure deionized water (18.2 MΩ cm, Merck Millipore Ltd, USA) so as to dilute the aflatoxin standard solution. According to the sample ratio table, eight concentration gradients of aflatoxin B2, G1, and G2 solution samples were configured. The configured sample solution was placed on a vortex oscillator to mix and vibrate for 3 minutes to ensure that the aflatoxin B2 standard solution was fully diluted in deionized water. The concentration ratios of three aflatoxin solutions of B2, G1 and G2 were shown in Table 1.
Table 1 Concentration ratios of aflatoxin B2, G1, G2 solutions (mg ml−1)
| Serial no. |
Aflatoxin B2, G1, G2 (ml) |
Total amount of solution (ml) |
Aflatoxin B2, G1, G2 standard solution concentration (mg ml−1) |
Aflatoxin B2, G1, G2 solution concentration (mg ml−1) |
| 1 |
4.608 × 10⁻⁷ |
25 |
0.025 |
4.608 × 10⁻¹⁰ |
| 2 |
4.096 × 10⁻⁷ |
25 |
0.025 |
4.096 × 10⁻¹⁰ |
| 3 |
3.584 × 10⁻⁷ |
25 |
0.025 |
3.584 × 10⁻¹⁰ |
| 4 |
3.072 × 10⁻⁷ |
25 |
0.025 |
3.072 × 10⁻¹⁰ |
| 5 |
2.56 × 10⁻⁷ |
25 |
0.025 |
2.56 × 10⁻¹⁰ |
| 6 |
2.048 × 10⁻⁷ |
25 |
0.025 |
2.048 × 10⁻¹⁰ |
| 7 |
1.536 × 10⁻⁷ |
25 |
0.025 |
1.536 × 10⁻¹⁰ |
| 8 |
1.024 × 10⁻⁷ |
25 |
0.025 |
1.024 × 10⁻¹⁰ |
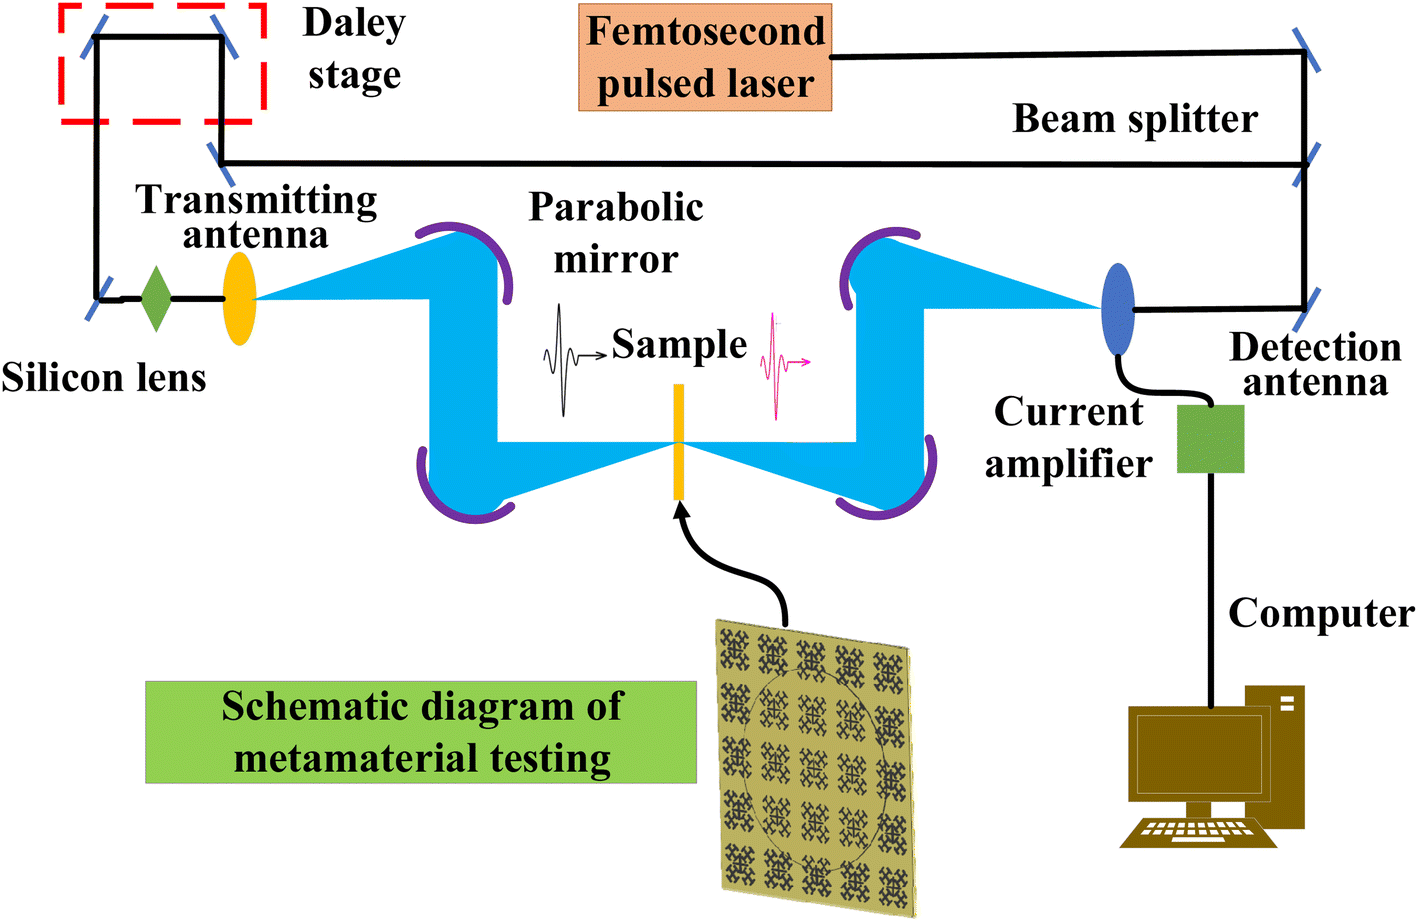
2.2.2 Experimental equipment and detection principle. The terahertz transmission spectra of three trace aflatoxin solutions were measured by TAS7500 terahertz time domain spectrometer of Advantest Company in Japan. The system consists of three main parts: femtosecond laser, terahertz emitter and terahertz detector. The spectrum measurement range is 0.1–5.0 THz, and the resolution of the instrument is 7.6 GHz. In order to avoid interference from the surrounding environment and to obtain stable information of the sample, the system was preheated by an air compressor with an air dryer before the experiment, and the optical cavity was continuously filled with dry air, which was measured by a hygrometer to keep the humidity below 5% and the temperature constant at 25 ± 0.5 °C. During the experiment, waited for 2 minutes after each sample was placed and waited for the system to stabilize before starting the measurement. In order to reduce the effect of concentration residues on the metamaterials sheet, a pipette was used to absorb 20 μl of sample solution onto the metamaterial sheet in the order of sample concentration from low to high. Because of the strong absorption of terahertz waves by water, the metamaterial sheet with the sample was placed in a drying oven for 20 minutes and the temperature of the drying oven was set to 50 °C before collecting the sample spectra to ensure that the solution on the metamaterial sheet could be fully dried. Finally, the metamaterial sheet with the sample was placed into the terahertz system for measurement by using the transmission mode. In order to reduce the influence of random errors on the experimental results, two points were taken for each concentration sample, and each point was measured for 10 times. A total of 160 spectra were obtained from 8 concentration samples and 480 terahertz transmission spectra were obtained from three kinds of aflatoxin samples. Fig. 3 is a schematic diagram of experimental equipment and sample detection.
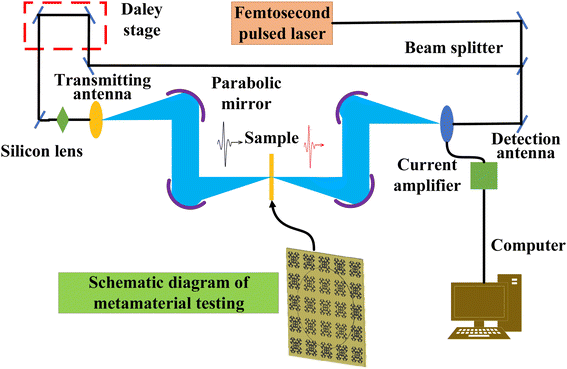 |
| | Fig. 3 Schematic diagram of experimental equipment and sample detection. | |
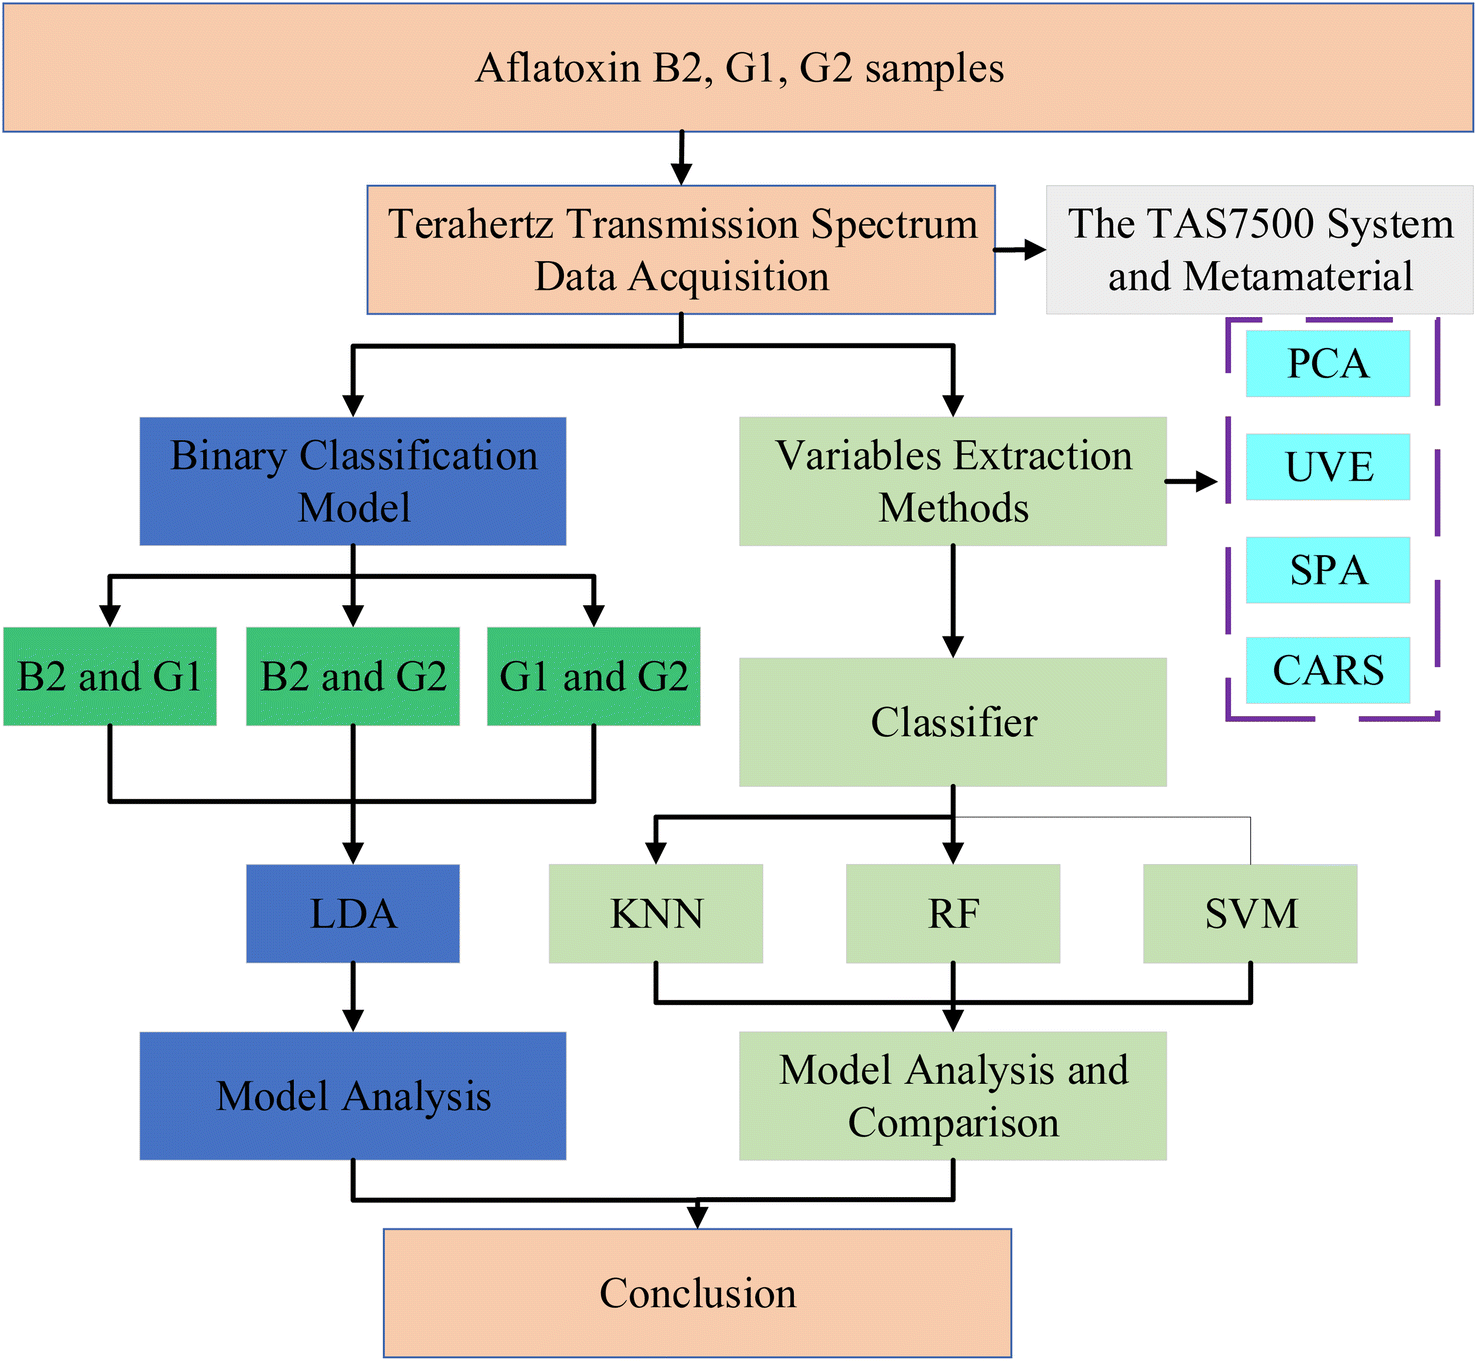
2.2.3 Modeling process. The acquired terahertz spectra of all samples were divided into calibration set and prediction set according to the proportion of about 3![[thin space (1/6-em)]](https://www.rsc.org/images/entities/char_2009.gif) :1 by using the Kennard–Stone (KS) algorithm for subsequent modeling. Fig. 4 shows the flow chart of data processing. The collected raw terahertz transmission spectra of aflatoxin B1, G1 and G2 were first classified by the LDA algorithm for binary mixing. Subsequently, in order to reduce the redundant information and streamline the computation of the model, Principal Component Analysis (PCA), Competitive Adaptive Reweighting Sampling (CARS), Uninformative Variable Elimination (UVE), and Successive Projections Algorithm (SPA) were introduced to extract features from the original terahertz transmission spectra. Finally, the K-Nearest Neighbor (KNN), Random Forest (RF) and Support Vector Machine (SVM) models were established respectively, and the optimal model was selected by analytical comparison.
:1 by using the Kennard–Stone (KS) algorithm for subsequent modeling. Fig. 4 shows the flow chart of data processing. The collected raw terahertz transmission spectra of aflatoxin B1, G1 and G2 were first classified by the LDA algorithm for binary mixing. Subsequently, in order to reduce the redundant information and streamline the computation of the model, Principal Component Analysis (PCA), Competitive Adaptive Reweighting Sampling (CARS), Uninformative Variable Elimination (UVE), and Successive Projections Algorithm (SPA) were introduced to extract features from the original terahertz transmission spectra. Finally, the K-Nearest Neighbor (KNN), Random Forest (RF) and Support Vector Machine (SVM) models were established respectively, and the optimal model was selected by analytical comparison.
 |
| | Fig. 4 Flow chart of data processing. | |
2.2.4 Terahertz spectral parameter extraction. Firstly, terahertz time domain spectra of 24 different concentrations of aflatoxin were collected, and the frequency domain signal was obtained by Fast Fourier Transform (FFT), which was expressed as formula (1).28| | |
E(ω) = A(ω)e−iφ(ω) = ∫dtE(t)e−iφ(ω)
| (1) |
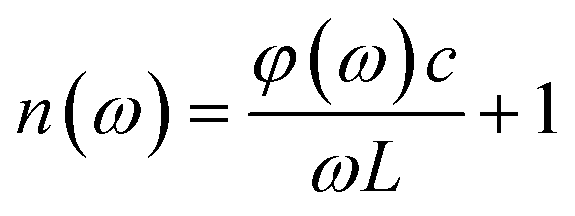
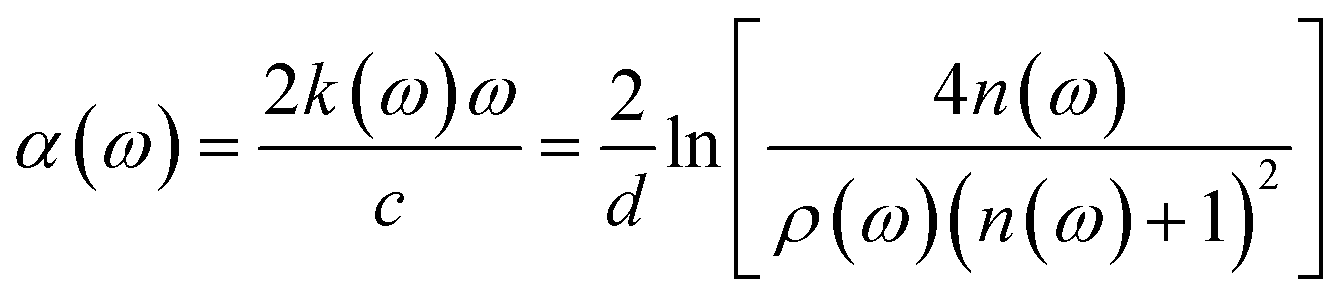
Wherein, A(ω) denotes the electric field amplitude, φ(ω) is the phase difference between the reference signal and the sample signal, E(t) is a terahertz time domain signal. The refractive index and absorption coefficient of the sample are obtained by formula (2) and (3).29| |
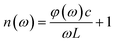 | (2) |
| |
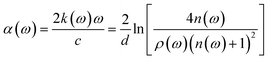 | (3) |
Wherein, n(ω) is the refractive index, α(ω) is the absorption coefficient, ω is frequency, k(ω) is extinction coefficient, ρ(ω) is a function of amplitude ratio, d is the thickness of the sample, and c is the speed of light in a vacuum.The terahertz transmission spectra of aflatoxin were subsequently extracted by comparing the sample spectrum with the reference spectrum.
Wherein,
AS and
AR are the amplitudes of the sample signal and the reference signal, respectively.
2.2.5 Principle of machine learning algorithm. (1) Linear Discriminant Analysis (LDA) is a supervised classification method. The principle is to linearly transform the n-dimensional feature vectors (or samples) into the m-dimensional space (m < n), so that the samples of the same class are close together and the samples of different classes are far apart in a classification method, thus allowing better separation of samples of different classes. In addition, the establishment of LDA model can also predict unknown samples well. The purpose of LDA algorithm is to find a transformation matrix to minimize the intra-class variance and maximize the inter-class variance.30| |
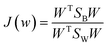 | (5) |
Wherein, SW is the intra-class covariance matrix, SB is the inter-class covariance matrix. The W matrix is a projection matrix composed of eigenvectors calculated by the LDA algorithm.(2) The K-Nearest Neighbor (KNN) classification algorithm is one of the more mature machine learning algorithms, which is often used for modeling and model prediction. The core idea is that if most of the k-nearest samples in the feature space of a sample belong to a certain class, then this sample also belongs to that class. In this paper, Euclidean distance is used as the distance metric, where the distance is defined as the following formula (6).31
| |
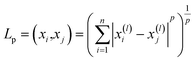 | (6) |
(3) Random Forest (RF) is a machine learning method based on decision trees, which is similar to a forest in nature consisting of trees. Its basic component unit is a decision tree, and each decision tree is independent of the other. The number of decision trees is built based on the number of differences between sample subsets, and its final judgment is obtained by using a voting mechanism.32
(4) Support Vector Machine (SVM) is a machine learning method based on kernel function, which has good generalization ability for the classification of different samples. The kernel function type is determined and the optimal penalty factor c and kernel parameter g can be determined by grid search method, thus establishing the optimal SVM discriminant model. The commonly used kernel functions are linear kernel function and radial basis kernel function, as shown in formula (7) and (8).33
| | |
K(xi,xj) = exp(−‖xi − xj‖2/2σ2)
| (8) |
Wherein
xi is the sample point,
xj is the central point of the kernel function, and
σ2 is the kernel parameter.
2.2.6 Model evaluation method. The prediction accuracy and misjudgment rate are often used to evaluate the model in the qualitative discrimination model.34 The formula (9) for calculating the prediction accuracy is shown as follows.| |
 | (9) |
Wherein, yi is the number of correct classifications of the model prediction, and y is the total number of samples in the prediction set.In addition to the prediction accuracy and misjudgment rate, confusion matrix is also an important evaluation method for qualitative discriminant model. In order to better compare the actual category and the model prediction category, the confusion matrix is used to evaluate the model.
3 Results and discussion
3.1 Analysis on terahertz transmission spectrum
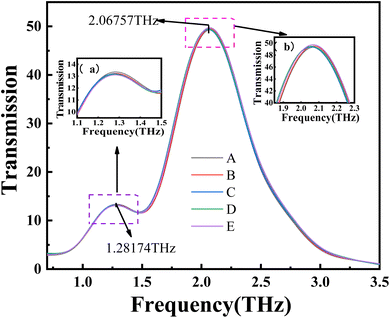
The “X” composite metamaterial combined with THz-TDS technique was used for the qualitative identification of trace aflatoxin B2, G1 and G2 solutions. Fig. 5 shows the transmission spectra of three aflatoxin B2, G1 and G2 solutions on the surface of the metamaterial absorber. Considering the large amount of noise interference in the frequency band below 0.7 THz and above 3.5 THz, the transmission spectra in the frequency band of 0.7–3.5 THz were intercepted to ensure the accuracy of the measurement, and the data of 368 spectral points contained in this frequency band were used for subsequent modeling.
 |
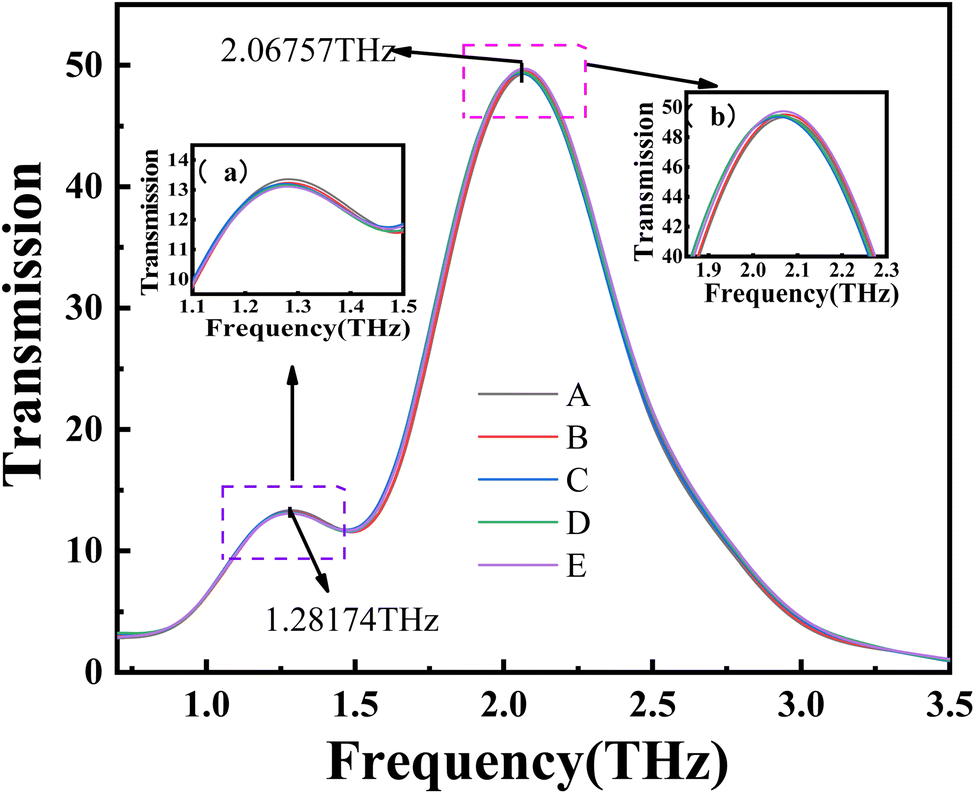
| | Fig. 5 The transmission spectrum of the metamaterial without aflatoxin. | |
The transmission spectrum of the metamaterial without aflatoxin is shown in Fig. 5. By repeated measurement of the metamaterial sheet without aflatoxin, 5 transmission lines are obtained. There are obvious resonance peaks at THz, and the resonance intensity is higher compared with the aflatoxin-containing metamaterial sheet.
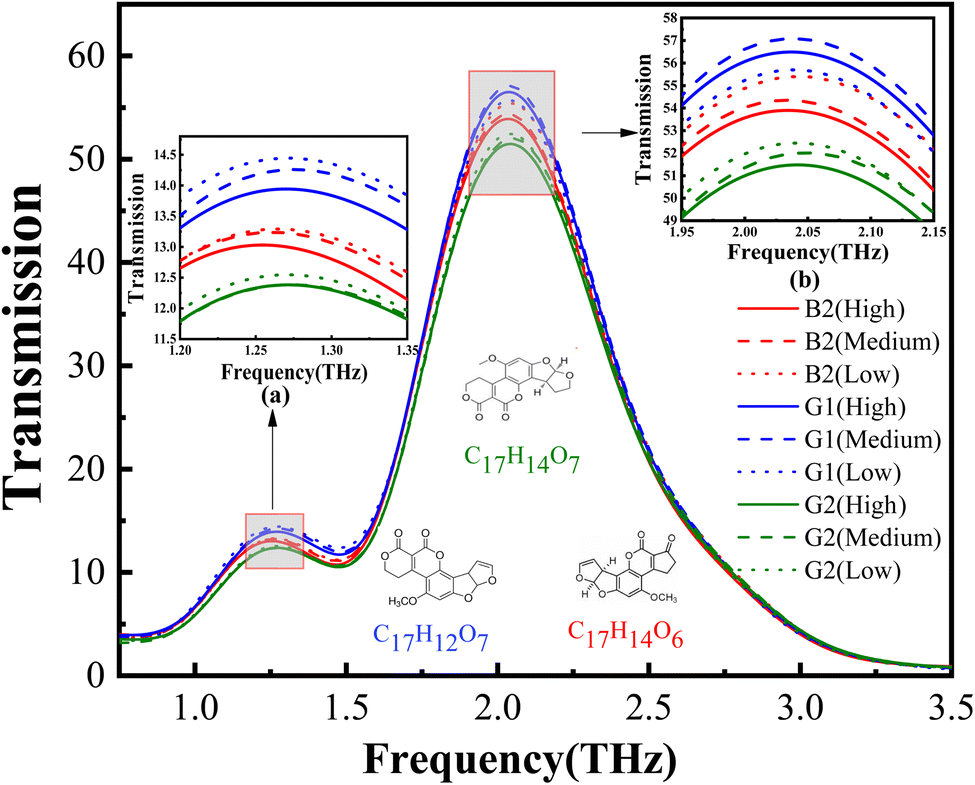
Among them, Fig. 6(a) shows the local amplification of the transmission spectra of aflatoxin B2, G1 and G2 solutions at 1.2 THz. Fig. 6(b) shows the local amplification of the terahertz transmission spectra of aflatoxin B2, G1, and G2 solutions at 2.0 THz. The transmission peaks in Fig. 6 mainly show the transmission characteristics of the metamaterial itself, from which it can be seen that there are transmission peaks with different intensities around 1.2 THz and 2.0 THz, respectively. The red curve, blue curve and green curve in Fig. 6 represent aflatoxin B2 solution, aflatoxin G1 solution and aflatoxin G2 solution, respectively. The straight, dash and dotted lines represent high, medium and low concentrations respectively. It can be clearly seen from Fig. 6 that there are obvious differences in the transmission peak curves of different species of aflatoxin, with the highest transmission peak intensity for aflatoxin G1 solution, followed by aflatoxin B2 solution, and the lowest transmission peak intensity for aflatoxin G2 solution. In addition, it can be seen from Fig. 6(a) that the amplitudes of the transmission peaks of aflatoxin B2, G1, and G2 all gradually decrease with the increase of the solution concentration at around 1.2 THz. It can be seen from Fig. 6(b) that the amplitude of the transmission peaks of aflatoxin B2 and G2 also decreases gradually with the increase of the solution concentration at around 2.0 THz. This provides a theoretical basis for further analysis of the response of the transmission peak characteristics of metamaterials to the concentration and species of trace aflatoxins.
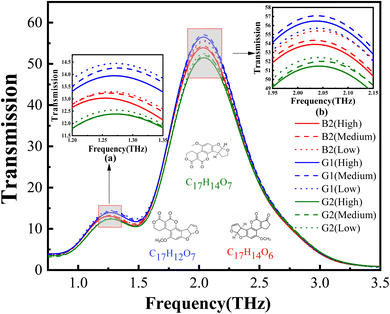 |
| | Fig. 6 Transmission spectra of different concentrations of aflatoxin B2, G1 and G2 solutions on the surface of the metamaterial absorber; (a) local amplification of the transmission spectra of aflatoxin B2, G1 and G2 solutions at 1.2 THz; (b) local amplification of the terahertz transmission spectra of aflatoxin B2, G1 and G2 solutions at 2.0 THz. | |
3.2 Establishment of LDA binary mixed classification qualitative identification model for aflatoxin original terahertz spectrum
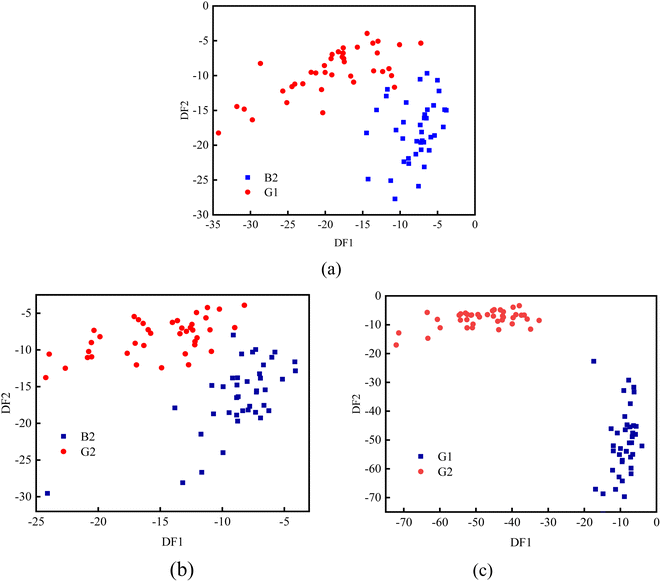
The collected terahertz transmission spectra of three types of aflatoxins were input into the LDA model to establish a binary mixed classification qualitative model. Firstly, the three types of spectra of aflatoxin B2, G1 and G2 were classified and numbered: “1”, “2” and “3”. The KS algorithm was then used to select 360 spectra as the calibration set and 120 spectra as the prediction set for the establishment and external validation of the LDA model. Fig. 7 shows the planar classification diagram of the LDA binary mixed classification qualitative model for the prediction set samples, where Fig. 7(a) shows the B2 and G1 binary mixed classification model, Fig. 7(b) shows the B2 and G2 binary mixed classification model, and Fig. 7(c) shows the G1 and G2 binary mixed classification model. In the visualization diagram of Linear Discriminant Analysis (LDA), DF1 and DF2 are obtained by linearly transforming the data. The goal of LDA is to project high-dimensional data into a low-dimensional space while preserving category information to the greatest extent. DF1 is the projection direction of the eigenvector with the most discriminative performance, and DF2 is the projection direction of the eigenvector with the second most discriminative performance. By projecting data points onto DF1 and DF2, the distribution of data points can be displayed on a two-dimensional plane for visual analysis. It can be seen from Fig. 7 that the class boundaries of the planar distribution of aflatoxin G1 and G2 are more obvious than those of aflatoxin B2 and G1 and aflatoxin B2 and G2.
 |
| | Fig. 7 Plane classification diagram of LDA binary mixed classification qualitative model for the prediction set samples (a) B2, G1 binary mixed classification model; (b) B2, G2 binary mixed classification model; (c) G1, G2 binary mixed classification model. | |
The external validation of the established LDA model was carried out by 80 prediction set samples. For example, the accuracy of the LDA binary mixed classification qualitative model of aflatoxin B2, G1, G2 terahertz spectra in Table 2 shows that aflatoxin B2, G1 and aflatoxin B2, G2 have 1 misjudgment respectively, and the accuracy of the prediction set is 98.75%. The terahertz spectral LDA binary hybrid classification qualitative model of aflatoxin G1 and G2 had the highest accuracy, and the accuracy of both the calibration set and the prediction set reached 100%.
Table 2 Accuracy of LDA binary mixed classification qualitative model for aflatoxin B2, G1 and G2 terahertz spectra
| Category |
PCs |
Precision of calibration sets |
Number of prediction |
Number of correct |
Prediction accuracy |
| B2, G1 |
16 |
98.75% |
80 |
79 |
98.75% |
| B2, G2 |
16 |
97.92% |
80 |
79 |
98.75% |
| G1, G2 |
16 |
100% |
80 |
80 |
100% |
When the type of aflatoxin increases, the effect of LDA model will be further reduced. In order to improve the accuracy of the model, four feature extraction algorithms, PCA, UVE, SPA and CARS, were used in this paper to extract the main features of terahertz transmission spectra of aflatoxin to improve the accuracy of the model while streamlining the computational effort of the model. The feature-extracted terahertz transmission spectra of aflatoxin were then input into the KNN, RF, and SVM models together with the original spectra, and the optimal models were derived by analytical comparison.
3.3 Establishment of KNN qualitative identification model for aflatoxin terahertz spectrum combined with feature extraction algorithm
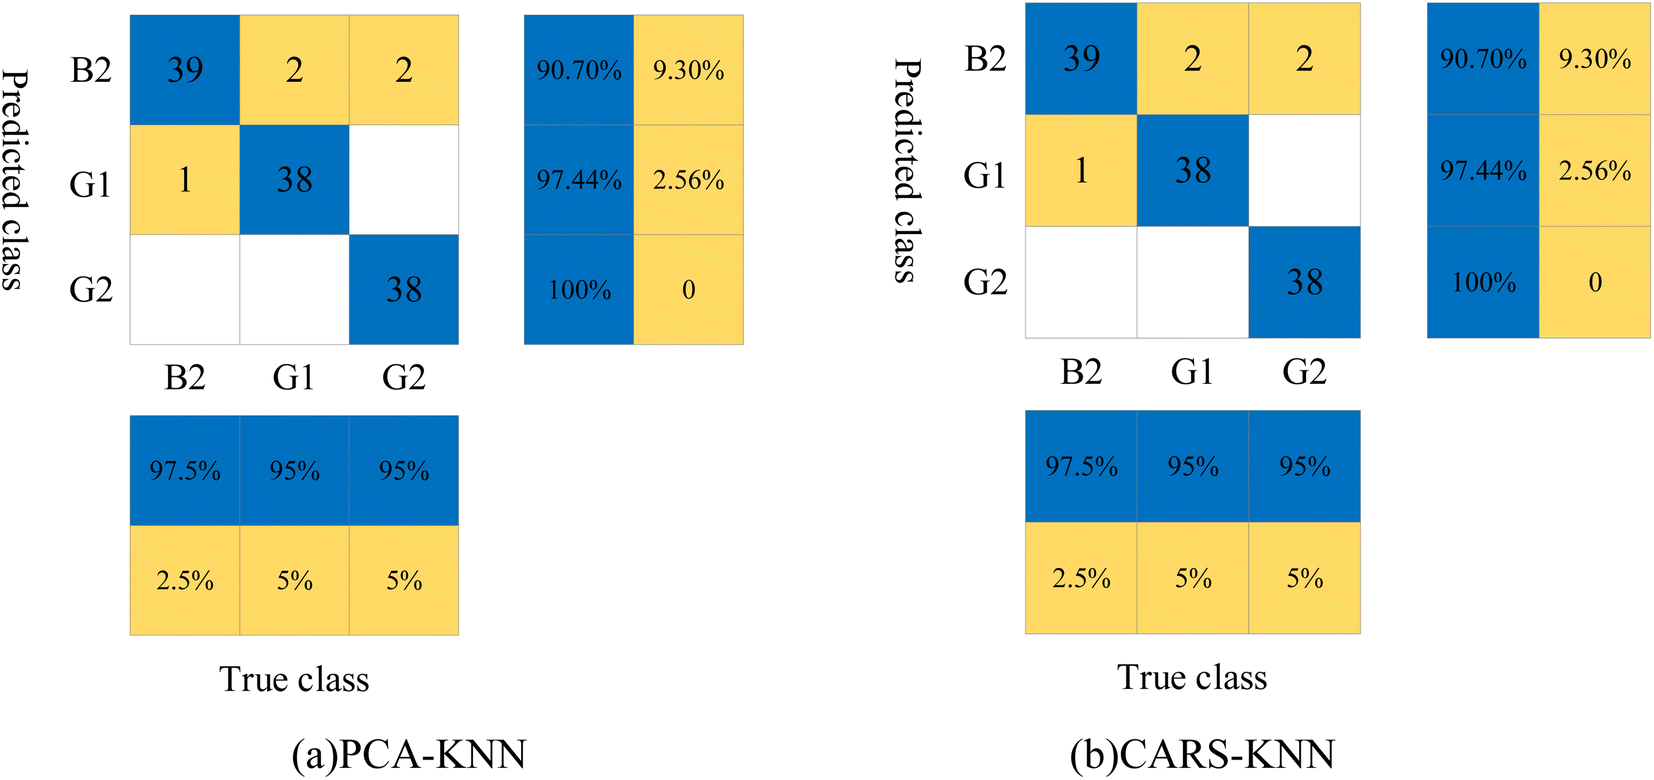
K-Nearest Neighbor (KNN) classification algorithm is one of the more mature and commonly used machine learning algorithms. The original spectral data and the characteristic spectral data extracted by the four algorithms of PCA, UVE, SPA, and CARS were input into the KNN model respectively, and the optimal model was obtained by searching the nearest neighbor number k (k = 1, 3, 5, 7, 9, 11, 13, 15, 17, 19, 21). Table 3 shows the results of the KNN qualitative model identification of aflatoxin terahertz spectra combined with feature extraction algorithm. Compared with the KNN model based on the original spectral data, the prediction accuracy of the KNN model after feature extraction by the PCA and CARS algorithms has been further improved, with five misclassifications in the prediction sets of the PCA-KNN and CARS-KNN models, and the accuracy of the prediction sets both reached 95.83%. Fig. 8 shows the confusion matrix of the prediction set of PCA-KNN and CARS-KNN models, from which it can be seen that the misjudgment of these two models is consistent. One aflatoxin B2 sample was misclassified as aflatoxin G1, two aflatoxin G1 samples were misclassified as aflatoxin B2, and two aflatoxin G2 samples were misclassified as aflatoxin B2.
Table 3 Identification results of KNN qualitative model of aflatoxin terahertz spectrum combined with feature extraction algorithm
| Model |
Variables extraction methods |
Variables numbers |
Number of prediction |
Number of correct |
Prediction accuracy |
| KNN |
None |
368 |
120 |
113 |
94.17% |
| PCA |
7 |
120 |
115 |
95.83% |
| UVE |
277 |
120 |
113 |
94.17% |
| SPA |
17 |
120 |
101 |
84.17% |
| CARS |
67 |
120 |
115 |
95.83% |
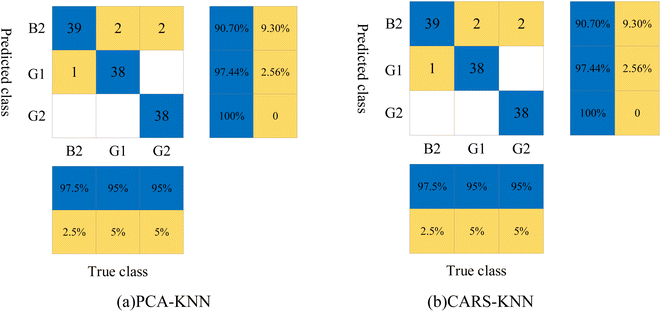 |
| | Fig. 8 Confusion matrix of model prediction set: (a) confusion matrix of PCA-KNN model prediction set; (b) CARS-KNN model prediction set confusion matrix. | |
3.4 Establishment of RF qualitative identification model for aflatoxin terahertz spectrum combined with feature extraction algorithm
Random Forest (RF) is a machine learning method based on decision tree. In this paper, the original spectral data and the characteristic spectral data extracted by PCA, UVE, SPA and CARS were input into the RF qualitative identification model to qualitatively distinguish aflatoxin B2, G1 and G2. In this study, after repeated verification, the number of decision trees (Ntree) was set to 1000, and the value of the number of point pre-selected variables (Mtry) was rounded down to the square root of the number of spectral variables, and the RF model was subsequently constructed, and the prediction accuracy of the model was optimized to some extent. Table 4 shows the identification results of KNN qualitative model of aflatoxin terahertz spectrum combined with feature extraction algorithm, from which it can be seen that PCA-RF has the best qualitative identification effect, with the number of correct predictions reaching 115 out of 120 predicted samples and the prediction accuracy reaching 95.83%.
Table 4 Identification results of RF qualitative model of aflatoxin terahertz spectrum combined with feature extraction algorithm
| Model |
Variables extraction methods |
Variables numbers |
Mtry |
Number of prediction |
Number of correct |
Prediction accuracy |
OOB error rate |
| RF |
None |
368 |
19 |
120 |
114 |
95% |
0.0667 |
| PCA |
7 |
2 |
120 |
115 |
95.83% |
0.0611 |
| UVE |
277 |
16 |
120 |
114 |
95% |
0.0750 |
| SPA |
17 |
4 |
120 |
105 |
87.5% |
0.111 |
| CARS |
67 |
8 |
120 |
113 |
94.17% |
0.0641 |
Fig. 9(a) shows the relationship between the out-of-bag (OOB) error rate and the number of decision trees. With the increase of the number of decision trees, the OOB error first decreases rapidly and then tends to be stable, and the minimum OOB error rate is 0.0611. Fig. 9(b) is the confusion matrix of PCA-RF model prediction set, from which it can be seen the misjudgment distribution of PCA-RF model prediction set. One aflatoxin B2 sample was misjudged as aflatoxin G2, three aflatoxin G1 samples were misjudged as aflatoxin B2, and one aflatoxin G2 sample was misjudged as aflatoxin B2, with the overall misjudgment reaching 4.17%.
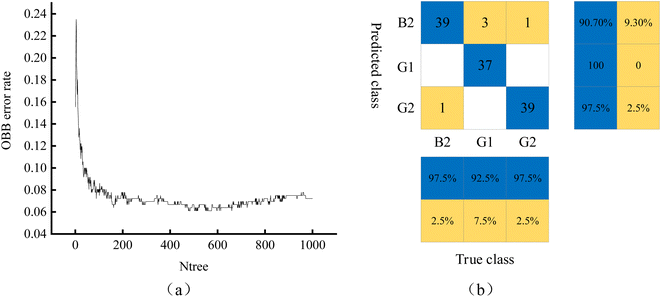 |
| | Fig. 9 Confusion matrix of PCA-RF model OOB error rate and prediction set: (a) OOB error rate; (b) prediction set confusion matrix. | |
3.5 Establishment of SVM qualitative identification model for aflatoxin terahertz spectrum combined with feature extraction algorithm
Support Vector Machines (SVM) is one of the most commonly used classification algorithms in machine learning. In this paper, the SVM qualitative identification models of aflatoxin B2, G1 and G2 were established by The Unscrambler 10.4 software, in which the SVM type was selected as c-svc, and two kinds of basic functions were selected for comparison: radial basis function (RBF) and linear basis function (Liner). The grid search method was used to optimize the parameters. The optimal SVM model was found by training the model with the sum parameter g and the penalty parameter c.
Table 5 shows the verification results of qualitative analysis of three aflatoxins by SVM model combined with feature extraction method. The prediction accuracy of the SVM model was better than that of the KNN model and RF model as a whole. The SVM model based on the radial basis kernel function (RBF) was better than the SVM model based on linear basis function (Liner). The optimal model was the RBF-SVM model after the feature variables were selected by the CARS algorithm, and the accuracy of the calibration set reached 100%. Among the 120 prediction samples, the number of correct predictions was 119, the correct rate of prediction reached 99.17%, and its parameter combination and the parameter combination c = 100, g = 0.015. Fig. 10 shows the confusion matrix of CARS-RBF-SVM model, from which it can be seen the misjudgment distribution of the prediction set of the CARS-RBF-SVM model. Only one aflatoxin B2 sample was misjudged as aflatoxin G2, and the overall misjudgment was only 0.83%.
Table 5 Validation results of SVM model combined with feature extraction method for three aflatoxins
| Model |
Kernel function |
Variables extraction methods |
Variables numbers |
Parameter |
Calibration accuracy |
Number of prediction |
Number of correct |
Prediction accuracy |
| c |
g |
| SVM |
RBF |
None |
368 |
10 |
0.003 |
99.44% |
120 |
117 |
97.50% |
| PCA |
7 |
10 |
0.143 |
100% |
120 |
114 |
95.00% |
| UVE |
277 |
10 |
0.004 |
99.44% |
120 |
117 |
97.50% |
| SPA |
17 |
100 |
0.059 |
98.61% |
120 |
112 |
93.33% |
| CARS |
67 |
100 |
0.015 |
100% |
120 |
119 |
99.17% |
| Liner |
None |
368 |
0.1 |
— |
97.50% |
120 |
116 |
96.67% |
| PCA |
7 |
0.1 |
— |
95.83% |
120 |
117 |
97.50% |
| UVE |
277 |
1.0 |
— |
98.06% |
120 |
115 |
95.83% |
| SPA |
17 |
10 |
— |
91.11% |
120 |
110 |
91.67% |
| CARS |
67 |
1.0 |
— |
97.50% |
120 |
116 |
96.67% |
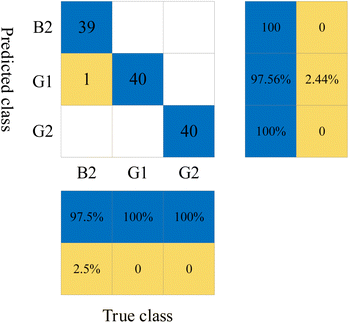 |
| | Fig. 10 Confusion matrix based on CARS-RBF-SVM model. | |
4 Conclusion
In this paper, an “X” composite terahertz metamaterial sensor was designed based on electromagnetic theory to investigate the feasibility of THz-TDS technology based on metamaterial sensor for qualitative identification of trace aflatoxin B2, G1 and G2 solutions. It is found that different kinds of aflatoxin terahertz transmission spectra existed with different intensities of transmission peaks around 1.2 THz and 2.0 THz respectively. Through the comparative analysis of different models, it is concluded that the highest prediction accuracy is achieved by CARS-RBF-SVM model, and the accuracy of the calibration set reaches 100%. Among the 120 predicted samples, the correct number of predictions reaches 119, and the correct rate of prediction reaches 99.17%. Only one aflatoxin B2 sample was misjudged as aflatoxin G2, and the overall misjudgment was only 0.83%. This study verifies the feasibility of the metamaterial sensor based on the “X” composite double-peak structure combined with THz-TDS technology for the qualitative identification of trace aflatoxin B2, G1 and G2 solutions, and provides a theoretical basis and a new detection method for the qualitative identification of trace aflatoxin. Meanwhile, this study has important implications for promoting the qualitative detection of other trace substances.
Data availability
Data underlying the results presented in this paper are not publicly available at this time but may be obtained from the authors upon reasonable request.
Author contributions
Jun Hu: investigation, writing-review and editing, experimental scheme design, formal analysis. Chaohui Zhan: experimental scheme design, writing-original draft, formal analysis. Rui Chen: simulation. Yande Liu and Shimin Yang: experimental scheme design. Yong He: formal analysis. Aiguo Ouyang: experimental scheme design.
Conflicts of interest
The authors declare that they have no known competing financial interests or personal relationships that could have appeared to influence the work reported in this paper.
Acknowledgements
National 863 Program (SS2012AA101306); National Natural Science Foundation of China (2002017018); Science and Technology Research Project of Jiangxi Education Department (GJJ210632); National Key R&D Program of China: R&D and Demonstration of Rail Transportation System for Agricultural Equipment in Hilly and Mountainous Areas (2022YFD2001805).
References
- K. D. Debasish and C. K. Sun, Aflatoxin B1 induces reactive oxygen species-dependent caspase-mediated apoptosis in normal human cells, inhibits Allium cepa root cell division, and triggers inflammatory response in zebrafish larvae, Sci. Total Environ., 2020, 737, 139704 CrossRef PubMed.
- H. He, D. W. Sun and H. B. Pu, et al., Bridging Fe3O4@Au nanoflowers and Au@Ag nanospheres with aptamer for ultrasensitive SERS detection of aflatoxin B1, Food Chem., 2020, 324, 126832 CrossRef CAS.
- D. C. Schabo, L. M. Martins and J. F. Maciel, et al., Production of aflatoxin B1 and B2 by Aspergillus flavus in inoculated wheat using typical craft beer malting conditions, Food Microbiol., 2020, 89, 103456 CrossRef CAS PubMed.
- Y. X. Luan, J. Y. Chen and G. Xie, et al., Visual and microplate detection of aflatoxin B2 based on NaCl-induced aggregation of aptamer-modified gold nanoparticles, Microchim. Acta, 2015, 182, 5–6 CrossRef.
- N. Sobia, M. K. Imran and Y. Ye, et al., A novel fluorescent aptasensor for aflatoxin M1 detection using rolling circle amplification and g-C3N4 as fluorescence quencher, Sens. Actuators, B, 2020, 315, 128049 CrossRef.
- W. Liu, P. G. Zhao and C. S. Wu, et al., Rapid determination of aflatoxin B1 concentration in soybean oil using terahertz spectroscopy with chemometric methods, Food Chem., 2019, 293, 213–219 CrossRef CAS PubMed.
- L. Qin, D. Li and J. R. Zhao, et al., The membrane mucin Msb2 regulates aflatoxin biosynthesis and pathogenicity in fungus Aspergillus flavus, Microb. Biotechnol., 2021, 14(2), 628–642 CrossRef CAS PubMed.
- H. M. Liu, A. X. Lu and H. L. Fu, et al., Affinity capture of aflatoxin B1 and B2 by aptamer-functionalized magnetic agarose microspheres prior to their determination by HPLC, Microchim. Acta, 2018, 185(7), 326 CrossRef.
- T. T. Yan, J. Zhu and Y. Li, et al., Development of a biotinylated nanobody for sensitive detection of aflatoxin B1 in cereal via ELISA, Talanta, 2022, 239, 123125 CrossRef CAS PubMed.
- D. Liu, F. Jia and Y. Wei, et al., Programmable Analytical Feature of Ratiometric Electrochemical Biosensor by Alternating the Binding Site of Ferrocene to DNA Duplex for the Detection of Aflatoxin B1, Chin. J. Chem., 2022, 40(18), 2232–2238 CrossRef CAS.
- S. Zhang, Z. X. Li and J. An, et al., Identification of aflatoxin B1 in peanut using near infrared spectroscopy combined with naive Bayes classifier, Spectrosc. Lett., 2021, 54(5), 340–351 CrossRef CAS.
- B. Dragana, M. Dragosav and M. C. Jens, et al., Fluorescence spectroscopy and multispectral imaging for fingerprinting of aflatoxin-B1 contaminated (Zea mays L.) seeds: a preliminary study, Sci. Rep., 2022, 12(1), 1–8 CrossRef PubMed.
- J. H. Deng, H. Jiang and Q. S. Chen, et al., Determination of aflatoxin B1 (AFB1) in maize based on a portable Raman spectroscopy system and multivariate analysis, Spectrochim. Acta, Part A, 2022, 275, 12148 CrossRef PubMed.
- A. Leili, H. Parvaneh and A. Parsa, et al., A Comprehensive Review on Food Applications of Terahertz Spectroscopy and Imaging, Compr. Rev. Food Sci. Food Saf., 2019, 18(5), 1563–1621 CrossRef PubMed.
- J. Hu, Z. Xu, M. P. Li and Y. He, et al., Detection of Foreign-Body in Milk Powder Processing Based on Terahertz Imaging and Spectrum, J. Infrared, Millimeter, Terahertz Waves, 2021, 42(8), 878–892 CrossRef.
- X. D. Sun, D. D. Cui and Y. Shen, et al., Non-destructive Detection for Foreign Bodies of Tea Stalks in Finished Tea Products Using Terahertz Spectroscopy and Imaging, Infrared Phys. Technol., 2022, 121, 104018 CrossRef.
- Q. Wang, H. Saima, L. J. Xie and Y. B. Ying, Non-destructive quality control detection of endogenous contaminations in walnuts using terahertz spectroscopic imaging, J. Food Meas. Charact., 2020, 14, 2453–2460 CrossRef.
- X. Wei, S. Li and S. P. Zhu, et al., Terahertz spectroscopy combined with data dimensionality reduction algorithms for quantitative analysis of protein content in soybeans, Spectrochim. Acta, Part A, 2021, 253, 119571 CrossRef CAS PubMed.
- Z. Y. Chen, F. F. Qu and Y. Wang, et al., Terahertz dual-band metamaterial absorber for trace indole-3-acetic acid and tricyclazole molecular detection based on spectral response analysis, Spectrochim. Acta, Part A, 2021, 263, 120222 CrossRef CAS PubMed.
- H. Y. Gu, C. J. Shi and X. Wu, et al., Molecular methylation detection based on terahertz metamaterial technology, Analyst, 2020, 145(20), 6705–6712 RSC.
- B. Li, J. P. Bai and S. J. Zhang, et al., Low Concentration Noroxin Detection using Terahertz Spectroscopy Combined with Metamaterial, Spectrochim. Acta, Part A, 2020, 247, 119101 CrossRef PubMed.
- R. Zhao, B. Zou and G. L. Zhang, et al., High-sensitivity identification of aflatoxin B1 and B2 using terahertz time-domain spectroscopy and metamaterial-based terahertz biosensor, J. Phys. D: Appl. Phys., 2020, 53(19), 195401 CrossRef CAS.
- G. Q. Wang, F. J. Zhu and T. T. Lang, et al., All-metal terahertz metamaterial biosensor for protein detection, Nanoscale Res. Lett., 2021, 16(1), 109 CrossRef CAS PubMed.
- J. Zhu and C. S. Wu, Detection of amino acid with metamaterial perfect absorbers in the terahertz band, Measurement, 2022, 192, 110738 CrossRef.
- J. Hu, R. Chen and Z. Xu, et al., Research on Enhanced Detection of Benzoic Acid Additives in Liquid Food Based on Terahertz Metamaterial Devices, Sensors, 2021, 21(9), 3238 CrossRef CAS PubMed.
- J. GomezCruz, Y. Bdour and K. Stamplecoskie, et al., FDTD Analysis of Hotspot-Enabling Hybrid Nanohole-Nanoparticle Structures for SERS Detection, Biosensors, 2022, 12(2), 128 CrossRef CAS PubMed.
- J. Hu, R. Chen and Z. Xu, et al., Research on Enhanced Detection of Benzoic Acid Additives in Liquid Food Based on Terahertz Metamaterial Devices, Sensors, 2021, 21(9), 3238 CrossRef CAS PubMed.
- F. Y. Lian, M. X. Fu and D. G. Xu, et al., Qualitative and Quantitative Analyses of Potassium Sorbate in Milk Powder using Terahertz Spectra, J. Appl. Spectrosc., 2020, 87(4), 764–772 CrossRef CAS.
- F. Y. Lian, H. Y. Ge and X. J. Ju, et al., Quantitative Analysis of Trans Fatty Acids in Cooked Soybean Oil Using Terahertz Spectrum, J. Appl. Spectrosc., 2019, 86(5), 917–924 CrossRef CAS.
- S. Yang, C. X. Li and Y. Mei, et al., Discrimination of corn variety using terahertz spectroscopy combined with chemometrics methods, Spectrochim. Acta, Part A, 2021, 252, 119475 CrossRef CAS PubMed.
- X. D. Sun, J. J. Li and Y. Shen, et al., Non-destructive Detection of Insect Foreign Bodies in Finishing Tea Product Based on Terahertz Spectrum and Image, Front. Nutr., 2021, 8, 75749 Search PubMed.
- J. Hu, Z. Xu, M. P. Li and Y. He, et al., Detection of Foreign-Body in Milk Powder Processing Based on Terahertz Imaging and Spectrum, J. Infrared, Millimeter, Terahertz Waves, 2021, 42(8), 878–892 CrossRef.
- K. Sabanci, M. F. Aslan and E. Ropelewska, et al., A convolutional neural network-based comparative study for pepper seed classification: analysis of selected deep features with support vector machine, J. Food Process Eng., 2021, 45(6), 13955 Search PubMed.
- J. Hu, H. Y. Shi and C. H. Zhan, et al., Study on the Identification and Detection of Walnut Quality Based on Terahertz Imaging, Foods, 2022, 11(21), 3498 CrossRef PubMed.
|
| This journal is © The Royal Society of Chemistry 2023 |
Click here to see how this site uses Cookies. View our privacy policy here. 
 Open Access Article
 This Open Access Article is licensed under a Creative Commons Attribution-Non Commercial 3.0 Unported Licence
 *a,
Chaohui Zhana,
Rui Chenb,
Yande Liu
*a,
Chaohui Zhana,
Rui Chenb,
Yande Liu