 Open Access Article
Creative Commons Attribution 3.0 Unported Licence
Phytochemical-assisted green synthesis of CuFeOx nano-rose electrocatalysts for oxygen evolution reaction in alkaline media†
D. K. Sarkarab,
V. Selvanathan*c,
M. Mottakinad,
A. K. Mahmud Hasana,
Md. Ariful Islama,
Hamad Almohamadi*e,
Nabeel H. Alharthifg and
Md. Akhtaruzzaman *ah
*ah
aSolar Energy Research Institute, Universiti Kebangsaan Malaysia, Bangi, Selangor Darul Ehsan 43600, Malaysia. E-mail: akhtar@ukm.edu.my; vidhya@ukm.edu.my
bDepartment of Applied Chemistry and Chemical Engineering, Rajshahi University, Rajshahi-6205, Bangladesh
cInstitute of Sustainable Energy, Universiti Tenaga Nasional (The Energy University), Jalan Ikram-Uniten, Kajang 43000, Selangor, Malaysia
dDepartment of Applied Chemistry and Chemical Engineering, Bangabandhu Sheikh Mujibur Rahman Science and Technology University, Gopalganj-8100, Bangladesh
eDepartment of Chemical Engineering, Faculty of Engineering, Islamic University of Madinah, Madinah, Saudi Arabia. E-mail: hha@iu.edu.sa
fDepartment of Mechanical Engineering, Faculty of Engineering, Islamic University of Madinah, Madinah, Saudi Arabia
gDepartment of Mechanical Engineering, College of Engineering, King Saud University, Riyadh, 11421, Saudi Arabia
hGraduate School of Pure and Applied Sciences, University of Tsukuba, Tsukuba, Ibaraki 305-8573, Japan
First published on 23rd June 2023
Abstract
This study represents a green synthesis method for fabricating an oxygen evolution reaction (OER) electrode by depositing two-dimensional CuFeOx on nickel foam (NF). Two-dimensional CuFeOx was deposited on NF using in situ hydrothermal synthesis in the presence of Aloe vera extract. This phytochemical-assisted synthesis of CuFeOx resulted in a unique nano-rose-like morphology (petal diameter 30–70 nm), which significantly improved the electrochemical surface area of the electrode. The synthesized electrode was analyzed for its OER electrocatalytic activity and it was observed that using 75% Aloe vera extract in the phytochemical-assisted synthesis of CuFeOx resulted in improved OER electrocatalytic performance by attaining an overpotential of 310 mV for 50 mA cm−2 and 410 mV for 100 mA cm−2. The electrode also sustained robust stability throughout the 50 h of chronopotentiometry studies under alkaline electrolyte conditions, demonstrating its potential as an efficient OER electrode material. This study highlights the promising use of Aloe vera extract as a green and cost-effective way to synthesize efficient OER electrode materials.
1. Introduction
Fossil fuels, such as coal, oil, and natural gas, make up 81% of our existing energy system, which raises issues because of their quick depletion and emissions.1 On the other hand, conventional renewable energy sources like solar, wind, hydro, and geothermal are not convenient due to their low energy density and local production issues.2 Instead of using conventional renewable energy sources for transportation fuel, they could be used for producing green hydrogen through water electrolysis. Green hydrogen is being treated as the alternative to carbon-based fuel and the fuel of the future due to its lack of resource constraints and emissions concerns.3 Moreover, hydrogen has the highest energy density of any fuel in gravimetric quantity.4,5 The most abundant component in the world is water which can be split into hydrogen and oxygen for use as fuel. When burned, hydrogen produces only water, making it a clean and sustainable energy source.6 This game-changer and sustainable technology could not be explored due to some drawbacks in the production of hydrogen, its storage, and its transportation system.Water splitting (WS) takes place through the OER and hydrogen evolution reaction (HER), where the OER part is most challenging because of its complexity and sluggish chemical kinetics process.5 The practically higher overpotential (OP) of the OER step consumes a large amount of energy for the operation, which is related to the high production cost of hydrogen. Without catalytic support, the whole production is not economically viable. Therefore, searching for suitable electrocatalysts is an attractive point to the researchers. The best-performing electrocatalysts (ECs) are noble metal-based materials such as RuO2, IrO2,7,8 AgPtOx for OER9 and Pt, Au, Pd, Ag, AgPtOx, AgAuO, AgPdOx, etc. for HER.10–12 The abovementioned ECs regarded as state-of-the-art and exhibit extraordinary performance in catalytic water splitting. But their extreme scarcity due to less natural resources, high cost, and inferior stability make a barrier to use them in large-scale hydrogen production.6 Nowadays, various earth-abundant transitional metals like Cu, Fe, Co, Ni, etc.13–18 with their alloys, oxides,19–21 chalcogenides,14 oxyhydroxides, hydroxides,18,21 phosphides,22 metal organic framework (MOF)23 have been reported as very much promising ECs owing to their performance and excellent stability. Recent reports discuss significant advancements in modifying catalyst surfaces and developing their morphology to yield electrocatalyst with expanded surface area.24,25 Generally, the use of organic molecules as capping and complexing agents are commonly employed strategies to achieve interesting morphologies of electrocatalysts directly grown on conductive substrates.26–28 The decoration of foreign materials in such nanostructures play a vital role in the OER catalysis process.29 Introducing inexpensive and easily accessible transitional metals (TMs) into a multiphase system is considered more beneficial for creating more active points that enhance electrical conductivity and ultimately lead to improved performance.21,30,31
Particularly, the combination of copper and iron for electrocatalytic material have shown encouraging results. In 2020, Xu et al. developed selenium enriched copper-iron selenide on copper foam as highly active catalysts for oxygen evolution through the optimization of surface morphology.32 The unique composition recorded ultralow overpotential of 200 mV at 10 mA cm−2. Inspired by these findings, in this work, a combination of copper-iron oxides synthesized via hydrothermal in different chemical environment is explored for catalyzing the OER. Some of the commonly used complexing agent used in hydrothermal synthesis of binder-free metal oxides-based electrocatalyst include urea, ammonium fluoride (NH4F), cetyltrimethylammonium bromide (CTAB), sodium dodecyl sulfate (STS) and polyvinylpyrrolidone (PVP).33–37 However, in line with the recent awareness towards green chemistry, these synthetic additives can be substituted with green complexing agent derived from phytochemicals which in fact have been used commonly in synthesis of metal oxide nanoparticles. The selection of plant extract utilized during the synthesis procedure plays a vital role in determining how ions are reduced, as well as in capping and stabilizing metal oxide nanostructures. Ultimately, this choice influences the overall morphology of the nanostructure.38,39
Therefore, in this work, the potential of using Aloe vera extract complexing agent for efficient morphology engineering is studied. Aloe vera gel primarily consists of water and polysaccharides like pectins, cellulose, hemicellulose, glucomannan, and acemannan. Additionally, the aloe latex contains hydroxyanthracenic derivatives, anthraquinone glycosides, and emodin.40,41 The unique chemical cocktail in the Aloe vera extract is expected to facilitate the formation of distinct nanostructured morphology that will boost its electrocatalytic activity. The catalysts were prepared through in situ hydrothermal and solvothermal processes, and five samples were produced, namely CuFeOx-A, CuFeOx-B, CuFeOx-C, CuFeOx-D, and CuFeOx-E, which varied based on the percentage of Aloe vera extract used. To evaluate the impact of the natural complexing agent on the catalysts' performance, the samples underwent characterization using X-ray diffraction (XRD), field effect scanning electron microscopy (FESEM), energy dispersive X-ray (EDX), and the necessary electrochemical tests. The study provides valuable information on the use of green synthesis of bimetallic heterostructure electrocatalysts for efficient water splitting.
2. Materials and methods
2.1 Chemicals
Chemicals, CuCl2·3H2O, FeCl3·9H2O, NH4F, CO(NH2)2, C2H5OH, KOH, and dry starch, including Nickle Foam (NF) were supplied from Sigma-Aldrich, Chemical Reagent Co. Ltd. Sdn. Bhd. Malaysia, and all purchased chemicals were used in the experiment without further purification.3. Preparation of copper iron oxide (CuFeOx) electrocatalyst
3.1 Preparation of solvent
Firstly, Aloe vera stems were cleaned with deionized (DI) water, dried, and sliced. In a glass beaker, 15 g Aloe vera slices were placed in 100 ml ethanol and swirled for 1 hour at 40–45 °C on a hot plate. The mixture was then filtered and kept in the refrigerator to be utilized as a co-solvent and complexing agents in synthesis. The whole solvent preparation process was followed by the previous study.42,433.2 Materials synthesis
For the synthesis of Cu, Fe-based oxide OER electrocatalysts on NF, a modified hydrothermal method and solvothermal methods were employed. The AE and DI water mixture was taken as a solvent in this deposition process. DI water and phytochemicals in AE which acted as complexing or capping agents and precipitators for producing metal oxides at the high vapor pressure of the mixed solvent.3.3 Deposition of CuFeOx-based catalyst electrodes
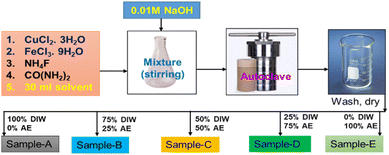
In the deposition of CuFeOx-based electrocatalysts, five samples were grown on NF by simple hydrothermal methods. First, the precursors were produced by mixing 2 mmol each of CuCl2·3H2O and FeCl3·9H2O with 4 mmol NH4F, 6 mmol CO(NH2)2, and 30 ml DI water as solvent. All of the materials were placed into a 250 ml conical flask and stirred vigorously for 50 minutes. Then, the pH of the mixture was changed to 9 by slowly adding 1 M NaOH solution drop by drop. Finally, it was moved into a 50 ml stainless steel autoclave lined with Teflon. As usual NF (1 × 2 cm2) was cleaned by following the previously applied procedure,44,45 and the cleaned NF was placed in the autoclave precursor solution before being sealed. To finish hydrothermal coating, the sealed autoclave was heated at 130 °C for 6 hours. After cooling at ambient temperature, the sample was placed in a beaker and rinsed 3–4 times with DI water and ethanol. It was then dried for one hour at 100 °C. The same procedures were followed for the 2nd, 3rd, 4th and 5th samples with the exception of replacing 30 ml of DI water solvent with AE at 25%, 50%, 75%, and 100% by volume. The obtained samples were named CuFeOx-A, CuFeOx-B, CuFeOx-C, CuFeOx-D, and CuFeOx-E, respectively. The preparation process of the catalyst electrodes is simplified by the following Fig. 1.3.4 Structural and morphological characterization
An X-ray diffractometer was used to determine the crystal structure of the produced samples (Bruker AXS D8 ADVANCE) at a scan rate of 2° per minute. The morphology and nanostructure with elemental composition and mapping were studied by FESEM and EDX. The above characterizations were repeated for the best-performing sample after the electrochemical and chronopotentiometric stability test.3.5 Electrochemical characterization
Using a computerized Metrohm Autolab workstation, electrochemical measurements were performed (Metrohm, Herisau, Switzerland) in a three-electrode system using a 1.0 M KOH solution as an electrolyte. The synthesized samples were used as working electrodes, and a platinum (Pt) thin plate and a saturated silver–silver chloride salt solution (Ag/AgCl) electrode (SAACE) were employed as counter electrodes and reference electrodes, respectively. The recorded potential data were converted into the reversible hydrogen electrode (RHE) by the relation as follows,| ERHE = EAg/AgCl + 0.695 + 0.0591 × pH |
OER performance was examined using linear sweep voltammetry (LSV) at 2 mV s−1. Before final LSV measurements, the electrodes were scanned from 0.3 to 0.8 V (vs. SAACE) 20 mV S−1 until the electrode became stabilized. Tafel slopes were calculated from the nearest static LSV data. Overpotential (OP) is derived from the recorded LSV results based on the equation below.
| OP = ERHE − 1.23 V |
The electrochemical active surface area (ECSA) was derived based on the double-layer capacitance (Cdl) by conducting a series of CV at the scan rate of 30 to 80 mV s−1 in a non-faradaic region (0.157–0.357 V vs. SAACE). The electrochemical impedance spectra (EIS) were evaluated within the frequency range from 100 mHz to 100 kHz. Finally, the stability measurement test was carried out by chronopotentiometry (CP) at the applied voltage of 0.35 V to achieve a constant current density (J) of 1.0 mA cm−2.
4. Results and discussion
4.1 XRD analysis of CuFeOx-based electrode samples
XRD is a strong characterization tool to determine the crystalline structure and material phases formed in the synthesized samples. The XRD patterns of all synthesized electrode samples are depicted in Fig. 2. The most prominent peaks of Nickel foam (NF) are found at 2θ angles of 44.65°, 51.92°, and 76.88° with corresponding crystal planes (111), (200), and (220) have been shown in Fig. 2(a).46 Fig. 2(a) also shows some relatively small peaks on the indexed plans (006), (012), (015), (018), and (201) at the 2θ value of 30.23°, 35.66°, 43.44°, 50.68°, and 74.22° respectively.47–50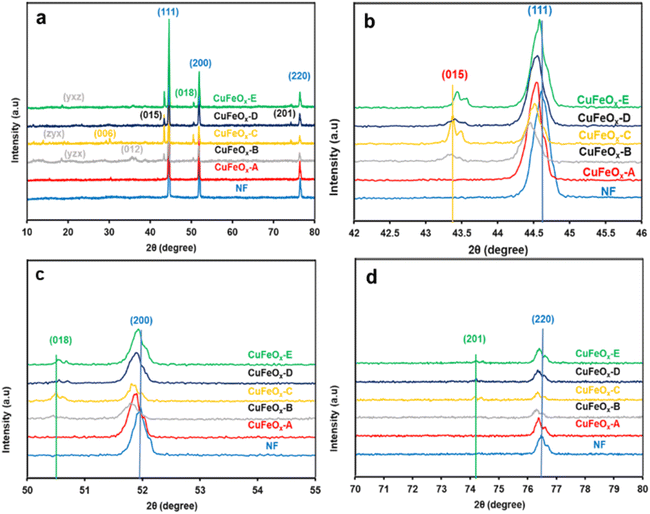 | ||
| Fig. 2 XRD pattern of the synthesized CuFeOx-based electrode samples and NF; (a) from 10° to 80°, (b) from 42° to 46°, (c) from 50° to 55°, and (d) from 70° to 80°. | ||
These all are assigned signals of CuFeOx-based material (CuFeO2, Ni:CuFeO2, NiFeO2, etc.) on the NF, but their peak intensity is very diffused due to the presence of very high intensities of NF crystallinity.51 In the preparation process, DI water and Aloe vera–ethanol extract and their mixture are used as the solvent. Phytochemicals in Aloe vera–ethanol extract (AE) influences the crystallinity and material composition of the prepared catalyst samples in presence of solvent polarity. In Fig. 2(b), it can be found that the highest peak signal of all (CuFeOx-A, CuFeOx-B, CuFeOx-C, CuFeOx-D, and CuFeOx-E) samples on the plan (111) has shifted toward a lower diffraction angle from pure NF's peak. The main reasons for the peak shifting are the development of larger crystalline defects and the diffusion of Ni2+/Ni3+ in CuFeOx phases.52,53 Similar cases have been seen for the peaks in indexed planes (200), and (220) assigning Fig. 2(c) and (d). The characteristic XRD signals of CuFeOx-based delafossite crystal are observed in plans (015), (018), and (012) which are too defused compared to the peaks in plan (111) as shown in Fig. 2(b)–(d). The diffraction peaks of the agglomerated nanosheets (as seen in the FESEM image) of the CuFeOx-C sample are clearly distinguishable from those of the other samples, except for NF. The lower XRD intensity seen in samples B and C in Fig. 2. Lower crystallinity, smaller particle size, the presence of structural defects or impurities, and various crystallographic phases are all potential causes. These variables may affect the overall crystalline order, which can result in decreased XRD intensity. Besides these, some other unidentified diffraction peaks in planes (yzx), (zyx), (yxz) are found in the lower 2θ angle which required more studies. The overall XRD study of the prepared catalyst materials illustrates that the deposited films are very thin (low peak intensity) with mostly polycrystalline, and multiphases.
4.2 Field emission scanning electron microscopy (FESEM)
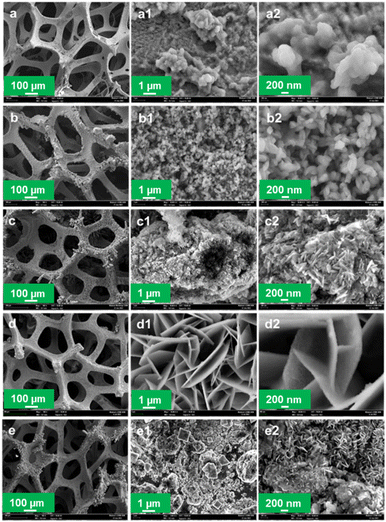
The morphology and nanostructure of the solvothermally deposited CuFeOx-based OER electrocatalysts on NF are characterized by FESEM. The FESEM images of the prepared samples have been illustrated in Fig. 3 with different magnifications such as a, a1, and a2 representing the images of the same sample CuFeOx-A. Images of the sample, CuFeOx-B are represented by b, b1, and b2. Similarly, the image series of 1c, 1d, and 1e represent the samples CuFeOx-C, CuFeOx-D, and CuFeOx-E, respectively.The FESEM images in the series shown in Fig. 3(d) illustrate that numerous highly porous interconnected nanosheets have grown vertically on the 3D NF. The diameter of the nanosheets is 30–70 nm. The vertically linked nanosheets have made funnel-types of hollow space insides themselves. As a result, electrode–electrolyte contact surface area increases many folds that enhance the sluggish OER kinetics leading to the lowest OP for WS. A solvent mixture of 25% DI water and 75% AE was used in the synthesis process, where the phytochemicals in AE played the most effective role in creating the optimal composition and morphology of the product. It may be hypothesised that the particular solvent composition has an impact on the rose-like morphology seen with a 75% AE and 25% DIW solvent combination in the FESEM investigation. The formation of unique patterns may result from the favourable nucleation and growth circumstances this particular solvent ratio. The rose-like shape formation may be greatly influenced by the variable surface tensions, reaction rates, and templating effects caused by the solvent combination. Separately, 25% and 50% AE were mixed with DIW and were applied to the samples CuFeOx-B, and CuFeOx-C. In both cases, nanostructures have changed distinctly seen in Fig. 3(b) and (c) but activities are limited for smaller active areas due to the large aggregation of nanoparticles in sample CuFeOx-B, and that of solid nanosheets in the sample CuFeOx-C. Their OER performances, as shown in Table 1, are higher than those of samples CuFeOx-A and CuFeOx-E, in which no mixed solvent was used. The attributed OP and relevant nano structuring morphology of the FESEM study ensured that the chemicals in AE explored their best activities by the polarity of the solvent. The exact mechanism of the mixed solvent demands extensive investigation of experiments.
| Sample | % (DIW + AE) | % Ni | % Cu | % Fe | % O | (OP)50 | (OP)100 |
|---|---|---|---|---|---|---|---|
| a Elemental composition of synthesized electrode samples based on EDS and OP for a J of 50 mA cm−2 and 100 mA cm−2. | |||||||
| CuFeOx-A | 100 + 0 | 8 | 69 | 1.7 | 22 | 530 | 690 |
| CuFeOx-B | 75 + 25 | 25 | 53 | 2.8 | 18 | 400 | 530 |
| CuFeOx-C | 50 + 50 | 56 | 22 | 3 | 19 | 340 | 450 |
| CuFeOx-D | 25 + 75 | 35 | 24 | 18 | 22 | 310 | 410 |
| CuFeOx-E | 0 + 100 | 25 | 53 | 1 | 16 | 420 | 510 |
4.3 Elemental composition
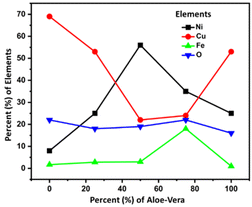
The energy dispersive spectroscopy (EDS) results of the samples in Fig. 4 are summarized in Table 1 with the solvent composition and OER overpotential of prepared catalyst electrodes.Table 1 shows that sample CuFeOx-D with 75% AE is shown to be the best electrocatalyst. Based on the elemental compositions presented in Fig. 4, it is evident that the composition of solvent plays a vital role in the elemental content of the samples. The samples were prepared in different solvent medium comprising of various amounts of water and ethanol based-Aloe vera extract. It is evident that as the solvent content is increased from 0–75% Aloe vera extract, the composition of iron content increases and copper content decreases in the sample, reaching 18% of iron and 24% copper in CuFeOx-D. Realizing that the composition of oxygen remain fairly consistent for all the samples, it is proposed that in samples CuFeOx-A, CuFeOx-B and CuFeOx-D, the significantly high copper percentages indicate formation of copper rich-CuFeOx. In CuFeOx-C and CuFeOx-D, the percentages of copper and iron content in comparison to oxygen suggests the formation of CuFeOx with ideal stoichiometry which favours catalytic properties. In addition to the morphological property, the synergistic effect of both copper and iron in CuFeOx-D assist to improve the overall catalytic performance of the sample. At 100% Aloe vera extract, the amount of iron dropped again significantly, indicating that in the absence of water and presence of only Aloe vera, the incorporation of iron into copper iron oxide is not favoured. We suspect that the higher viscosity of solvent comprising only Aloe vera extract as well as the presence of ethanol as the primary solvent in CuFeOx-E is not conducive for the uniform formation of copper iron oxide on nickel foam substrate. The nickel content in the samples mainly originated from the nickel foam substrate and thus the higher percentages of nickel in CuFeOx-C is indicative of the formation of a thin layer of copper iron oxide layer on the nickel foam surface and possibility of exposed nickel foam surface. Fig. S1† displays the EDX spectra of the prepared samples.
With EDX mapping, it is possible to map a sample's elemental distribution. It focused electron beam across the sample and detecting the distinctive X-rays given off by the elements. The distribution of each element throughout the sample surface is displayed on the resultant map.
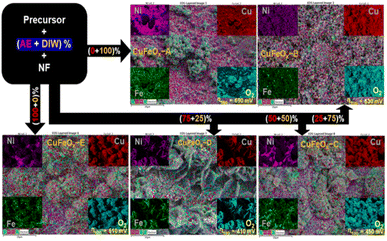
According to Fig. 5, the CuFeOx-based electrocatalyst seems to have a regular distribution of components over the surface of the electrode. The distribution of Cu, Fe, and O on the surface appears to be uniform according to the elemental map, which means that there are no obvious regions of high or low element concentration. The distribution of elements is found to be most homogeneous but the metal content in each sample is dominated by the amount of AE present in the mixed solvent. In addition, the electrode's surface seems rough rather than smooth, indicating that the electrode has a larger surface area. Electrocatalysts with greater surface areas are preferred because they can offer more active locations where catalytic reactions can take place. This study enhanced the structural integrity and porosity of the electrodes, by depositing very thin dendritic and porous Fe, Ni, and Cu nanostructures on the NF. This was accomplished by adopting a quick and easy in situ solvothermal process in which O2 bubbles serve as templates for the development of pores. Here, four different catalysts based on AE phytochemicals were prepared on high-surface-area support, and in each case, they should generate larger double-layer capacitances, indicating that the active sites are more accessible.
4.4 X-ray photoelectron spectroscopy (XPS)
The CuFeOx-D sample's XPS peak is shown in Fig. 6(a). The peaks of Cu 2p3/2 at 932.52 and 934.2 eV, as seen in Fig. 6(b), point to the presence of metallic Cuo (and/or Cu1+) and Cu2+ species. At 943.6 eV and 962.72 eV, weak-intensity satellite peaks were also seen, pointing to the presence of Cu+ on the sample's surface.54 During the hydrothermal process, the binding energy of Ni 2p3/2 at 855.36 eV and Ni 2p1/2 at 873.19 eV potentially originates from the NF, which indicates the presence of Ni2+ in the sample accompanied by an enhanced electron density.55 The peaks observed at 725.66 eV and 711.21 eV, which correspond to Fe 2p1/2 and Fe 2p3/2, respectively, provide evidence for the presence of Fe3+ in the form of Fe2O3.56 The sample's oxygen lattice (OLatt) exhibits a peak at 530.96 eV, while a second peak at 532.17 eV is attributed to adsorbed oxygen (OAds). It is likely that this second component is associated with the diffusion of oxygen atoms into the bulk material.57 The addition of copper promotes the incorporation of more OLatt. Consequently, the higher peak area of OLatt/OAds becomes significantly influential in driving the catalytic process.58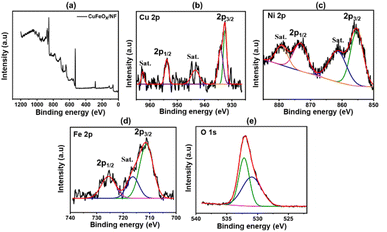 | ||
| Fig. 6 XPS analysis of CuFeOx-D sample; (a) CuFeOx-D survey peak, (b) Cu 2p, (c) Ni 2p, (d) Fe 2p, (e) O 1s. | ||
4.5 Performances of the prepared electrodes as OER catalyst
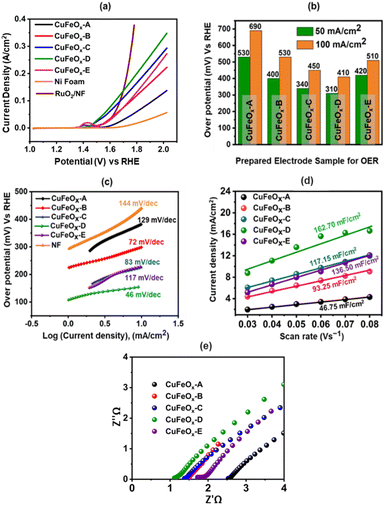
The OER catalytic performances of all prepared samples are evaluated in 1.0 M KOH. The LSV curves are shown in Fig. 7(a). The OER performance of NF is poorer than other electrodes, and the sample CuFeOx-D has shown the best performance. CuFeOx-D has the lowest OP of 310 mV and 410 mV to produce at J of 50 mA cm−2 and 100 mA cm−2, respectively. The FESEM image series 3(d) shows the sample CuFeOx-D with a morphology of interconnected nanosheets, and this type of morphology is responsible for the lowest OP. Besides its morphological features, the higher content of Fe and Ni may be responsible for enhanced performance as seen in EDX analysis (Fig. 4). In terms of catalysis, Fe, and Ni both are superior to Cu.59,60 Small peak is observed in LSV for the sample CuFeOx-B and CuFeOx-E due to the oxidation of Ni into higher valency state.59,60 So, the current not only comes from the OER but also from Ni oxidation. Similar catalytic performances of other samples CuFeOx-A, CuFeOx-B, CuFeOx-C, and CuFeOx-E are shown in Fig. 7(b), where all are inferior to that of CuFeOx-D with an OP of 690, 530, 450, and 510 mV respectively at J of 100 mA cm−2. The OP of CuFeOx-A is the highest among all synthesized electrodes and shows an OP is 530 mV and 690 mV at J of 50 mA cm−2 and 100 mA cm−2, respectively. But the most promising catalytic performance shown by the catalyst CuFeOx-D. At 100 mA cm−2, the overpotential of CuFeOx-D is lower compared to commercially applied RuO2/NF (447 mV at 100 mA cm−2). Despite exhibiting superior catalytic activity of RuO2 at higher current densities, CuFeOx is readily available and inexpensive, making it commercially more viable. The CuFeOx-D electrochemical catalyst prepared with 25% AE exhibited an excellent performance with an OP of 80 mV at J of 10 mA cm−2. This result is unprecedented in the previously published literature with Cu–Fe-based materials.61,62The electrode CuFeOx-D has achieved high performance due to its material composition and morphological features. The compositional aspects have been discussed in the EDS section. CuFeOx-D shows superior performances because of its large surface area and high Fe content, as it is found in FESEM image and EDS results (Table 1). A self-supported conductive network was created by the interconnected nanosheets. This network aided in the transmission of electrons between the catalyst's surface-active sites and the current collector. As the OP increased, a lot of oxygen bubbles were produced on the electrode surface. It prevented the electrolyte from making direct contact with the active sites, which had an impact on how long the reaction would last. As a result, the electrodes' ability to transfer mass and catalysed reactions depended on the release of bubbles. The surface of the Pt electrode contained hydrogen bubbles that had grown and accumulated, as shown in a digital photograph. Moreover, the CuFeOx-D/NF-produced bubbles quickly disappeared from the electrode surface (Fig. 8), suggesting that the active sites may be quickly re-exposed to the electrolyte. The rapid surface bubble ejection demonstrated that the interconnected nanosheets design of CuFeOx-D/NF effectively boosted reaction kinetics and facilitated mass transfer.
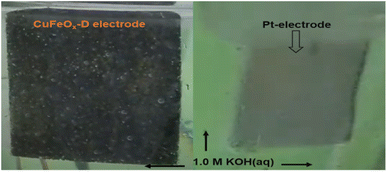 | ||
| Fig. 8 During water splitting in 1.0 M KOH electrolyte; O2 evolves at CuFeOx-D and H2 at Pt electrodes. | ||
The Tafel equation (OP = a + b![[thin space (1/6-em)]](https://www.rsc.org/images/entities/char_2009.gif) log
log![[thin space (1/6-em)]](https://www.rsc.org/images/entities/char_2009.gif) J) is used to determine the Tafel slopes of the samples, which are displayed in Fig. 7(c). Here, a is the intercept-constant and b is the Tafel slope. Fig. 7(d) displays the corresponding values of the calculated slopes. The Tafel slope for the sample CuFeOx-D is the lowest (46 mV dec−1) and the respective values of other samples are 129 (CuFeOx-A), 72 (CuFeOx-B), 83 (CuFeOx-C), and 117 mV dec−1 (CuFeOx-E). A higher value of Tafel slope indicates faster electron transport, which in turn suggests a favourable kinetic barrier for the OER.63 Therefore, the smaller Tafel slope value denotes the better OER catalytic reaction.
J) is used to determine the Tafel slopes of the samples, which are displayed in Fig. 7(c). Here, a is the intercept-constant and b is the Tafel slope. Fig. 7(d) displays the corresponding values of the calculated slopes. The Tafel slope for the sample CuFeOx-D is the lowest (46 mV dec−1) and the respective values of other samples are 129 (CuFeOx-A), 72 (CuFeOx-B), 83 (CuFeOx-C), and 117 mV dec−1 (CuFeOx-E). A higher value of Tafel slope indicates faster electron transport, which in turn suggests a favourable kinetic barrier for the OER.63 Therefore, the smaller Tafel slope value denotes the better OER catalytic reaction.
Fig. 7(e) displays the Nyquist plot of the samples, which was derived from the EIS data. EIS is carried out to investigate the ohmic resistance (Rohm) of the solution/electrode surface and the faradaic charge transfer resistance (Rct). The semicircle part in the Nyquist plots represents that the faradaic charge transfer process is the rate-determining step for OER.49 In the high-frequency range, the intercept of the real axis (Z′) with the semicircle section that affects Rohm represents the sum of electrode resistance (Re) and solution resistance (Rs) connected in series (i.e., Rohm = Re + Rs).50 Fig. 7(e) shows that a small semicircle with a 0.12 Ω Rct is observed. All the prepared samples contain small semicircle and a straight line, indicating better charge transfer through the electrode. CuFeOx-D has the lowest Rohm value of 1.08 Ω cm−2 among all the prepared catalyst electrodes, while CuFeOx-A, CuFeOx-B, CuFeOx-C, and CuFeOx-E have significantly higher values of 2.84, 1.52, 1.43, and 1.91 Ω cm−2, respectively, which indicating a quicker reaction kinetics and superior low resistance for the CuFeOx-D electrode.
The catalyst's ECSA addresses the intrinsic activity and performance of OER ECs. Data from cyclic voltammetry (CV) tests carried out in the non-faradaic potential range were used to compute the ECSA of the samples based on the double-layer capacitance (Cdl). As shown in Fig. 9, the CV tests were carried out on all samples at potentials ranging from 0.15 V to 0.30 V vs. SAACE and at scan speeds of 30, 40, 50, 60, 70, and 80 mV s−1. The Cdl was then calculated from the slope of the linear plot of J = (Ja − Jc, Ja and Jc represent anodic and cathodic current densities) at 0.25 V vs. SAACE as a function of the sweep rate.48 The Cdl value were used to compute the ECSA. ECSA is equal to Cdl/Cs, where Cs is the specific capacitance, which is typically equal to 0.040 mF cm−2 for metal electrodes in KOH solution. Fig. 9(e) shows the ECSA values of the Cdl curves of the samples. The calculated ECSA of the samples are 46.75 mF cm−2 (CuFeOx-A), 93.25 mF cm−2 (CuFeOx-B), 117.15 mF cm−2 (CuFeOx-C), 162.7 mF cm−2 (CuFeOx-D), and 136.5 mF cm−2 (CuFeOx-E). The ECSA is directly proportional to active sites so greater ECSA means a larger area of catalyst surface is exposed to reactants species as a result, OER becomes faster.24 The performance of the synthesized materials with previously reported similar Cu-based polymetallic OER catalysts are listed in Table 2. In comparison to the literature, the CuFeOx-D material has a commendable efficiency with overpotential of 175 mV at 10 mA cm−2, implying that it could be a promising candidate for electrocatalytic applications. Furthermore, the reported stability of 50 hours demonstrates its robustness and durability under operational conditions.
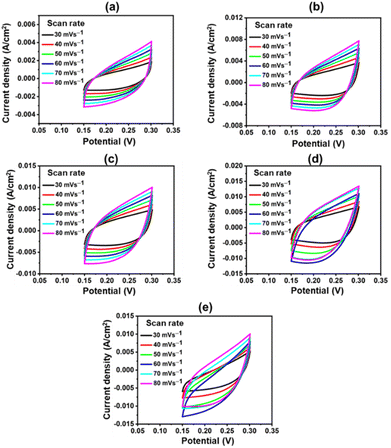 | ||
| Fig. 9 CV polarization curve at various scan rates; (a) CuFeOx-A, (b) CuFeOx-B, (c) CuFeOx-C, (d) CuFeOx-D, and (e) CuFeOx-E. | ||
| No. | Material | η (mV)/Jsc (mA cm−2) | Stability | Preparation process | Ref. |
|---|---|---|---|---|---|
| 1 | Cu–NiFe LDH/NF | 199/10 | 24 h | Chemical oxidation | 64 |
| 2 | Cu(OH)2:Fe(OH)3/CF | 365/10 | 12 h | In situ hydrothermal | 65 |
| 3 | NiFe/Cu2O NWs/CF | 215/10 | 25 h | In situ hydrothermal | 66 |
| 4 | FeCoNiMnCu | 280/10 | 40 h | Cathodic plasma electrolysis deposition | 67 |
| 5 | Cu(OH)2–NiFe LDH | 283/10 | 10 h | Unipolar pulse electro-deposition | 68 |
| 6 | CuFe2O4/NF | 340/10 | 1000 c | Electro-spume | 69 |
| 7 | CaCu3Fe4O12 | 450/05 | 11 h | Ion assisted solvothermal | 70 |
| 8 | CuO@Ni/NiFe (OH)x | 230/10 | 16 h | Chemical oxidation–calcination | 71 |
| 9 | Cu0.3Ir0.7Oδ | 150/100 | 6000 s | Hydrothermal doping | 72 |
| 10 | RuO2·NiO/NF | 144/10 | 72 h | In situ grown | 73 |
| 11 | RuO2·Ru | 172/10 | 10![[thin space (1/6-em)]](https://www.rsc.org/images/entities/char_2009.gif) 000 cycle 000 cycle |
Laser ablation | 74 |
| 12 | RuO2 | 320/10 | 20 h | Electro-chemical | 75 |
| 13 | RuO2/CeO2 | 350/10 | 70 h | In situ solution | 76 |
| 14 | Ru–RuO2/CNT | 210/10 | 30 h | In situ hybrid | 77 |
| 15 | CuFeOx-D | 175/10 | 50 h | In situ solvothermal | This work |
4.6 Stability
The physiochemical stability of electrocatalysts is one of the most important features of their practical application. In this study, the synthesized CuFeOx-based electrocatalysts were evaluated for their long-time stability. The synthesized electrocatalysts exhibit long-time durability in the assessment test. During the catalytic study, CuFeOx-D exhibits the lowest OP of 410 mV to reach the J of 100 mA cm−2. It shows excellent catalytic ability at a constant potential of 0.65 V vs. SAACE for 50 hours (Fig. 10(a)). The XRD diffractograms depicted in Fig. 10(b) validate that the diffraction peaks remain largely consistent. The peak position remained the same as before with slight decline in the intensity of all the peaks. Furthermore, Fig. 10(c) demonstrates that the rose-shaped nanostructured catalyst was maintained after the 50 hours stability study, ensuring the robustness of the catalyst in withstanding sustained alkali exposure without severe corrosion. Thus, in situ solvothermal deposited CuFeOx has shown potential for long time stable catalytic applications in the OER for water splitting.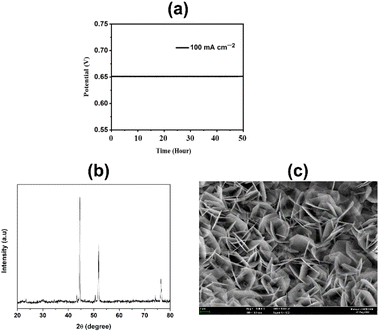 | ||
| Fig. 10 (a) Chronopotentiometry (CP) for the sample CuFeOx-D at a constant J of 100 mA cm−2 for 50 hours, (b) XRD diffractogram and (c) FESEM image of CuFeOx-D after 50 hours stability studies. | ||
5. Conclusion
The study highlights the potential of using natural complexing agents, such as Aloe vera–ethanol extract, in the production of efficient WS electrocatalysts based on CuFeOx. The use of green synthesis methods for bimetallic heterostructure electrocatalysts can contribute to sustainable and eco-friendly energy production. The phytochemicals in 75% AE are the most effective for high amount Fe content CuFeOx based OER catalysts with large ECSA and prospective morphological features. The best electrode CuFeOx-D shows excellent OER activity, particularly for large current densities. The catalyst performs reasonably well for OER in an alkaline electrolyte. This green synthesized CuFeOx-D catalyst able to attain cell voltage of 1.75 V and 3.1 V at 10 mA cm−2 and 100 mA cm−2, respectively. The synthesized electrocatalysts are excellent candidates for real-world use in energy-related domains such as water splitting due to their exceptional stability and catalytic activity.Author contributions
D. K Sarkar: writing – original draft and formal analysis; V. Selvanathan: reviewing, editing, revising, and formal analysis; M. Mottakin: drafting figures, validation, formal analysis, writing, and editing; A. K Mahmud Hasan: revision and formal analysis; Mohammod Ariful Islam: revision and editing, Hamad Almohamadi: validation and funding acquisition; Nabeel H. Alharthi: editing and funding acquisition and Md. Akhtaruzzaman: supervision & writing – review & editing.Conflicts of interest
There are no conflicts to declare.Acknowledgements
The authors would like to acknowledge Universiti Kebangsaan Malaysia (UKM) through the collaboration research grant scheme (RS-2022-004). This work is also funded by the Deputyship of Research & Innovation, Ministry of Education in Saudi Arabia, through project number 1047. In addition, the authors would like to express their appreciation for the support provided by the Islamic University of Madinah. Additionally, Rajshahi University in Bangladesh and the Bangabandhu Science and Technology Fellowship Trust, Ministry of Science and Technology, People's Republic of Bangladesh, are also to be thanked and heartily acknowledged.References
- D. Gielen, F. Boshell, D. Saygin, M. D. Bazilian, N. Wagner and R. Gorini, Energy Strategy Rev., 2019, 24, 38–50 CrossRef.
- Y. Zhou, S. Xi, X. Yang and H. Wu, J. Solid State Chem., 2019, 270, 398–406 CrossRef CAS.
- L. Lu, H. Zheng, Y. Li, Y. Zhou and B. Fang, Chem. Eng. J., 2023, 451, 138668 CrossRef CAS.
- S. Wang, A. Lu and C.-J. Zhong, Nano Convergence, 2021, 8, 1–23 CrossRef CAS PubMed.
- F. M. Sapountzi, J. M. Gracia, H. O. Fredriksson and J. H. Niemantsverdriet, Prog. Energy Combust. Sci., 2017, 58, 1–35 CrossRef.
- A. Vazhayil, L. Vazhayal, J. Thomas and N. Thomas, Appl. Surf. Sci. Adv., 2021, 6, 100184 CrossRef.
- W. Zhong, Z. Lin, S. Feng, D. Wang, S. Shen, Q. Zhang, L. Gu, Z. Wang and B. Fang, Nanoscale, 2019, 11, 4407–4413 RSC.
- G. Liu, F. Hou, X. Wang and B. Fang, Appl. Surf. Sci., 2023, 615, 156333 CrossRef CAS.
- Y. Li, F. Li, Y. Zhao, S.-N. Li, J.-H. Zeng, H.-C. Yao and Y. Chen, J. Mater. Chem. A, 2019, 7, 20658–20666 RSC.
- X. Xu, X. Tian, Z. Zhong, L. Kang and J. Yao, J. Power Sources, 2019, 424, 42–51 CrossRef CAS.
- T. Zhao, Y. Wang, X. Chen, Y. Li, Z. Su and C. Zhao, ACS Sustainable Chem. Eng., 2020, 8, 4863–4870 CrossRef CAS.
- G. Liao, J. Fang, Q. Li, S. Li, Z. Xu and B. Fang, Nanoscale, 2019, 11, 7062–7096 RSC.
- J.-F. Qin, M. Yang, S. Hou, B. Dong, T.-S. Chen, X. Ma, J.-Y. Xie, Y.-N. Zhou, J. Nan and Y.-M. Chai, Appl. Surf. Sci., 2020, 502, 144172 CrossRef CAS.
- K. S. Bhat and H. Nagaraja, ChemistrySelect, 2020, 5, 2455–2464 CrossRef CAS.
- Z. Xue, X. Li, Q. Liu, M. Cai, K. Liu, M. Liu, Z. Ke, X. Liu and G. Li, Adv. Mater., 2019, 31, 1900430 CrossRef PubMed.
- J.-J. Duan, Z. Han, R.-L. Zhang, J.-J. Feng, L. Zhang, Q.-L. Zhang and A.-J. Wang, J. Colloid Interface Sci., 2021, 588, 248–256 CrossRef CAS PubMed.
- S. Wang, W. Xue, Y. Fang, Y. Li, L. Yan, W. Wang and R. Zhao, J. Colloid Interface Sci., 2020, 573, 150–157 CrossRef CAS PubMed.
- Y. Ding, B.-Q. Miao, Y. Zhao, F.-M. Li, Y.-C. Jiang, S.-N. Li and Y. Chen, Chin. J. Catal., 2021, 42, 271–278 CrossRef CAS.
- J.-J. Duan, R.-L. Zhang, J.-J. Feng, L. Zhang, Q.-L. Zhang and A.-J. Wang, J. Colloid Interface Sci., 2021, 581, 774–782 CrossRef CAS PubMed.
- P. Klaiklang, S. Khongthon, R. Chueachot and R. Nakhowong, Mater. Lett., 2020, 275, 128094 CrossRef CAS.
- R. Rohit, A. D. Jagadale, S. K. Shinde, D.-Y. Kim, V. S. Kumbhar and M. Nakayama, J. Alloys Compd., 2021, 863, 158081 CrossRef CAS.
- X. Wu, J. Li, Y. Li and Z. Wen, Chem. Eng. J., 2021, 409, 128161 CrossRef CAS.
- L. Wu, L. Yu, F. Zhang, D. Wang, D. Luo, S. Song, C. Yuan, A. Karim, S. Chen and Z. Ren, J. Mater. Chem. A, 2020, 8, 8096–8103 RSC.
- H. Sun, X. Xu, Y. Song, W. Zhou and Z. Shao, Adv. Funct. Mater., 2021, 31, 2009779 CrossRef CAS.
- A. Raveendran, M. Chandran and R. Dhanusuraman, RSC Adv., 2023, 13, 3843–3876 RSC.
- Z. Angeles-Olvera, A. Crespo-Yapur, O. Rodríguez, J. L. Cholula-Díaz, L. M. Martínez and M. Videa, Energies, 2022, 15, 1609 CrossRef CAS.
- M.-I. Jamesh and M. Harb, J. Energy Chem., 2021, 56, 299–342 CrossRef CAS.
- C. Wang, L. Jin, H. Shang, H. Xu, Y. Shiraishi and Y. Du, Chin. Chem. Lett., 2021, 32, 2108–2116 CrossRef CAS.
- A. Muthurasu, B. Dahal, K. Chhetri and H. Y. Kim, Inorg. Chem., 2020, 59, 3817–3827 CrossRef CAS PubMed.
- Y. Zhang, X. Wang, F. Luo, Y. Tan, L. Zeng, B. Fang and A. Liu, Appl. Catal., B, 2019, 256, 117852 CrossRef CAS.
- G. Liu, F. Hou, X. Wang and B. Fang, Materials, 2022, 15, 7602 CrossRef CAS PubMed.
- F. Xu, G. Qian, W. Chen, L. Luo, F. Shen and S. Yin, J. Phys. Chem. C, 2020, 124, 19595–19602 CrossRef CAS.
- V. Selvanathan, M. Shahinuzzaman, S. Selvanathan, D. K. Sarkar, N. Algethami, H. I. Alkhammash, F. H. Anuar, Z. Zainuddin, M. Aminuzzaman and H. Abdullah, Catalysts, 2021, 11, 1523 CrossRef CAS.
- L. Jinlong and L. Tongxiang, Ceram. Int., 2017, 43, 6168–6174 CrossRef.
- C.-S. Song, C. V. M. Gopi, R. Vinodh, S. Sambasivam, R. M. N. Kalla, I. M. Obaidat and H.-J. Kim, J. Energy Storage, 2019, 26, 101037 CrossRef.
- S. Saha, A. Roy, A. Ray, T. Das, M. Nandi, B. Ghosh and S. Das, Electrochim. Acta, 2020, 353, 136515 CrossRef CAS.
- P. Kiaeerad and L. Naji, J. Electroanal. Chem., 2021, 901, 115779 CrossRef CAS.
- Y. B. Chan, V. Selvanathan, L.-H. Tey, M. Akhtaruzzaman, F. H. Anur, S. Djearamane, A. Watanabe and M. Aminuzzaman, Nanomaterials, 2022, 12, 3589 CrossRef CAS PubMed.
- V. Selvanathan, M. Aminuzzaman, L. X. Tan, Y. F. Win, E. S. G. Cheah, M. H. Heng, L.-H. Tey, S. Arullappan, N. Algethami and S. S. Alharthi, J. Mater. Res. Technol., 2022, 20, 2931–2941 CrossRef CAS.
- C. Quispe, M. Villalobos, J. Bórquez and M. Simirgiotis, J. Chem., 2018, 2018, 6123850 Search PubMed.
- M. Hęś, K. Dziedzic, D. Górecka, A. Jędrusek-Golińska and E. Gujska, Plant Foods Hum. Nutr., 2019, 74, 255–265 CrossRef PubMed.
- D. Sarkar, M. Mottakin, A. M. Hasan, V. Selvanathan, K. Sobayel, M. Khan, A. M. Rabbani, M. Shahinuzzaman, M. Aminuzzaman and F. H. Anuar, J. Photochem. Photobiol. Chem., 2023, 114623 CrossRef CAS.
- D. Sarkar, A. M. Hasan, M. Mottakin, V. Selvanathan, K. Sobayel, M. A. Islam, G. Muhammad, M. Aminuzzaman, M. Shahiduzzaman and K. Sopian, Sol. Energy, 2022, 243, 215–224 CrossRef CAS.
- Y. Wang, P. Che, X. Du and X. Zhang, Int. J. Hydrogen Energy, 2020, 45, 28598–28606 CrossRef CAS.
- T. Liu and P. Diao, Nano Res., 2020, 13, 3299–3309 CrossRef CAS.
- S. Sun, P. Diao, C. Feng, E.-M. Ungureanu, Y. Tang, B. Hu and Q. Hu, RSC Adv., 2018, 8, 19776–19785 RSC.
- Y. Dong, C. Cao, Y.-S. Chui and J. A. Zapien, Chem. Commun., 2014, 50, 10151–10154 RSC.
- S. Omeiri, B. Bellal, A. Bouguelia, Y. Bessekhouad and M. Trari, J. Solid State Electrochem., 2009, 13, 1395–1401 CrossRef CAS.
- S. Akin, F. Sadegh, S. Turan and S. Sonmezoglu, ACS Appl. Mater. Interfaces, 2019, 11, 45142–45149 CrossRef CAS PubMed.
- Q. Xu, R. Li, C. Wang and D. Yuan, J. Alloys Compd., 2017, 723, 441–447 CrossRef CAS.
- Z. Du, D. Xiong, S. K. Verma, B. Liu, X. Zhao, L. Liu and H. Li, Inorg. Chem. Front., 2018, 5, 183–188 RSC.
- G. Cheng, Q. Bai, C. Si, W. Yang, C. Dong, H. Wang, Y. Gao and Z. Zhang, RSC Adv., 2015, 5, 15042–15051 RSC.
- G. Rajender and P. Giri, J. Alloys Compd., 2016, 676, 591–600 CrossRef CAS.
- S.-C. Sun, F.-X. Ma, Y. Li, L.-W. Dong, H. Liu, C.-M. Jiang, B. Song, L. Zhen and C.-Y. Xu, Sustain. Energy Fuels, 2020, 4, 3326–3333 RSC.
- N. Rahemi, M. Haghighi, A. A. Babaluo, M. F. Jafari and S. Allahyari, Korean J. Chem. Eng., 2014, 31, 1553–1563 CrossRef CAS.
- T. Yamashita and P. Hayes, Appl. Surf. Sci., 2008, 254, 2441–2449 CrossRef CAS.
- A. Boronin, S. Koscheev and G. Zhidomirov, J. Electron. Spectrosc. Relat. Phenom., 1998, 96, 43–51 CrossRef CAS.
- W. Muhammad, L. Wu, A. El Kasmi, A. Muhammad and Z. Tian, J. Therm. Sci., 2023, 32, 531–541 CrossRef CAS.
- H. Xiao, H. Shin and W. A. Goddard III, Proc. Natl. Acad. Sci. U.S.A., 2018, 115, 5872–5877 CrossRef CAS PubMed.
- M. Görlin, J. Halldin Stenlid, S. Koroidov, H.-Y. Wang, M. Börner, M. Shipilin, A. Kalinko, V. Murzin, O. V. Safonova, M. Nachtegaal, A. Uheida, J. Dutta, M. Bauer, A. Nilsson and O. Diaz-Morales, Nat. Commun., 2020, 11, 6181 CrossRef PubMed.
- L. Han, S. Dong and E. Wang, Adv. Mater., 2016, 28, 9266–9291 CrossRef CAS PubMed.
- A. Peugeot, C. E. Creissen, D. Karapinar, H. N. Tran, M. Schreiber and M. Fontecave, Joule, 2021, 5, 1281–1300 CrossRef CAS.
- H.-H. Zou, C.-Z. Yuan, H.-Y. Zou, T.-Y. Cheang, S.-J. Zhao, U. Y. Qazi, S.-L. Zhong, L. Wang and A.-W. Xu, Catal. Sci. Technol., 2017, 7, 1549–1555 RSC.
- L. Yu, H. Zhou, J. Sun, F. Qin, F. Yu, J. Bao, Y. Yu, S. Chen and Z. Ren, Energy Environ. Sci., 2017, 10, 1820–1827 RSC.
- Z. Zhou, X. Li, Q. Li, Y. Zhao and H. Pang, Mater. Today Chem., 2019, 11, 169–196 CrossRef CAS.
- Y. Bai, L. Fang, H. Xu, X. Gu, H. Zhang and Y. Wang, Small, 2017, 13, 1603718 CrossRef PubMed.
- K. Huang, D. Peng, Z. Yao, J. Xia, B. Zhang, H. Liu, Z. Chen, F. Wu, J. Wu and Y. Huang, Chem. Eng. J., 2021, 425, 131533 CrossRef CAS.
- X. Ma, X. Li, A. D. Jagadale, X. Hao, A. Abudula and G. Guan, Int. J. Hydrogen Energy, 2016, 41, 14553–14561 CrossRef CAS.
- M. Li, Y. Xiong, X. Liu, X. Bo, Y. Zhang, C. Han and L. Guo, Nanoscale, 2015, 7, 8920–8930 RSC.
- X. Xiao, C.-T. He, S. Zhao, J. Li, W. Lin, Z. Yuan, Q. Zhang, S. Wang, L. Dai and D. Yu, Energy Environ. Sci., 2017, 10, 893–899 RSC.
- Y. Liu, Z. Jin, X. Tian, X. Li, Q. Zhao and D. Xiao, Electrochim. Acta, 2019, 318, 695–702 CrossRef CAS.
- W. Sun, Y. Song, X.-Q. Gong, L.-m. Cao and J. Yang, Chem. Sci., 2015, 6, 4993–4999 RSC.
- T. Yu, Q. Xu, L. Luo, C. Liu and S. Yin, Chem. Eng. J., 2022, 430, 133117 CrossRef CAS.
- Z. Wang, B. Xiao, Z. Lin, S. Shen, A. Xu, Z. Du, Y. Chen and W. Zhong, J. Energy Chem., 2021, 54, 510–518 CrossRef CAS.
- Y. Qin, T. Yu, S. Deng, X.-Y. Zhou, D. Lin, Q. Zhang, Z. Jin, D. Zhang, Y.-B. He, H.-J. Qiu, L. He, F. Kang, K. Li and T.-Y. Zhang, Nat. Commun., 2022, 13, 3784 CrossRef CAS PubMed.
- S. M. Galani, A. Mondal, D. N. Srivastava and A. B. Panda, Int. J. Hydrogen Energy, 2020, 45, 18635–18644 CrossRef CAS.
- M. Zhang, J. Chen, H. Li, P. Cai, Y. Li and Z. Wen, Nano Energy, 2019, 61, 576–583 CrossRef CAS.
Footnote |
| † Electronic supplementary information (ESI) available. See DOI: https://doi.org/10.1039/d3ra02512h |
| This journal is © The Royal Society of Chemistry 2023 |

