
 Open Access Article
 This Open Access Article is licensed under a Creative Commons Attribution-Non Commercial 3.0 Unported Licence
Enhancing catalytic efficiency of carbon dots by modulating their Mn doping and chemical structure with metal salts†
Wooseok Kang‡
,
Ahyun Lee‡,
Yoonjin Tae,
Byeongseung Lee and
Jin-sil Choi *
*
Department of Chemical and Biological Engineering, Hanbat National University, Daejeon 34158, Korea. E-mail: jinsil.choi@hanbat.ac.kr
First published on 17th March 2023
Abstract
Nanozymes are emerging materials in various fields owing to their advantages over natural enzymes, such as controllable and facile synthesis, tunability in catalytic activities, cost-effectiveness, and high stability under stringent conditions. In this study, the effect of metal salts on the formation and catalytic activity of carbon dots (CDs), a promising nanozyme, is demonstrated. By introducing Mn sources that possess different counter anions, the chemical structure and composition of the CDs produced are affected, thereby influencing their enzymatic activities. The synergistic catalytic effect of the Mn and N-doped CDs (Mn&N-CDs) is induced by effective metal doping in the carbogenic domain and a high proportion of graphitic and pyridinic N. This highly enhanced catalytic effect of Mn&N-CDs allows them to respond sensitively to the interference factors of enzymatic reactions. Consequently, ascorbic acid, which is an essential nutrient for maintaining our health and is a reactive oxygen scavenger, can be successfully monitored using color change by forming oxidized 3,3′,5,5′-tetramethylbenzidine with H2O2 and Mn&N-CDs. This study provides a basic understanding of the formation of CDs and how their catalytic properties can be controlled by the addition of different metal sources, thereby providing guidelines for the development of CDs for industrial applications.
1 Introduction
Nanozymes, nanoparticle-based artificial enzymes, have been actively investigated owing to their advantages over natural enzymes; their advantages include controllable and facile synthesis, tunability in catalytic activities, cost-effectiveness, and high stability against stringent conditions.1–6 Owing to these advantages, they are widely applied in various fields, including H2 generation, CO2 reduction, wastewater treatment, organic reactions, biosensors, cancer therapy, energy transfer, and pollutant removal.4,7–13 Representative nanozymes include metal oxide- or sulfide-based materials (e.g., Fe3O4, CeO2, Co9S8, CuO, MnO2); metal-based materials (e.g., Au, Ag, Pt, and Ir); and carbon-based materials (e.g., carbon dots (CDs), g-C3N4, graphene, CNT).1,4,14 CDs are emerging as enzyme-like catalytic agents, such as peroxidase, oxidase, and catalase, through proton-coupled electron transfer.15,16 They contain graphene-like crystalline sp2 domains and various defect sites at their edges.17–20 Modulation of chemical structures, including vacancies/holes, edge defects (e.g., zigzag and armchair), topological defects, and heteroatom doping (e.g., N, P, S, B, and metal atoms), can enhance the catalytic effect of CDs. For example, topological defects of CDs, such as pyridine, pyrrole, and zigzag-edge, generate local charge redistribution, thereby forming active sites on the electrocatalyst.21 Nitrogen is a representative dopant in the CD structure because lone-pair electrons in the pyridinic-N configuration provide active binding sites.22–24 Other heteroatoms, such as P and F, also cause variations in the local electron structure and lattice distortion, thus improving catalytic performance.21,25–27Metal salts may be involved in the formation of CDs and modulate their performance.28 Metal salts have been introduced in the synthesis of CDs, not only as chemical knots to form effective sp2 graphitic structures in carbonization processes29–31 but also as chemical modification agents for carbon-based materials.32–34 Metal ions can also be doped as enzymatic active centers in CDs, thereby enhancing their catalytic properties through their redox capability.35,36 Transition metals (e.g., Fe and Mn) or lanthanide metals (e.g., Ce) can act as effective catalytic centers for CDs. For example, Fe-doped CDs exhibit peroxidase properties owing to the Fenton effect.35,36 Fe ion doping and Mn ion addition allow CDs to exhibit catalytic effects at wide pH conditions, whereas undoped CDs are typically active at a low pH.24,37 The Fe-doped CDs have been further utilized in energy storage, photodynamic therapy, and colorimetric sensor probes.38,39 Mn is another good dopant to improve the catalytic effect of CDs. It can act as not only a scavenging agent to remove a wide range of free radicals but also a therapeutic agent for cancer or harmful bacteria by generating reactive oxygen species (ROS).34,40–43 Moreover, codoping of Fe and Mn in CDs can generate radicals effectively through their superior catalytic effect.44 The strong redox ability of Ce in the Ce3+ and Ce4+ states induces superior catalase mimetic activity of CDs.45–47 Because metal doping in CDs has only recently been investigated, numerous factors still need to be explored for securing optimal functional materials.38,40,48–51 In our previous study, when Mn(OAc)2 was introduced during the synthesis of CDs, even though the amount of doped metal ions was almost negligible, their catalytic properties were enhanced through chemical structure modification.34 In many studies, the amount of doped metal ions in CDs were also low.33,34,49 Sometimes specific precursors must be utilized for the effective doping of metal in CDs.48 Although metal doping in CDs with individual metal precursors has been explored, there has been no systematic research on the effect of different metal sources on CD formation.
In this study, we investigated the variation in the degree of metal doping and the chemical structure of CDs depending on metal salts. Metal salts with different counter anions, such as chloride, sulfate, and nitrate, were introduced to understand their effects on CD formation. The chemical structure and degree of Mn doping of each CD were intensively examined using infrared (IR) spectroscopy and X-ray photoelectron spectroscopy (XPS), and the relationship between the catalytic effect and chemical structure/composition of the CDs was further explored. Based on this, Mn and N-doped CDs (Mn&N-CDs) with optimized catalytic effects were further utilized for the detection of ascorbic acid (AA), which is an essential nutrient, whose deficiency can cause various diseases, including scurvy, cancer, and cardiovascular diseases.
2 Experimental
2.1 Reagents
All reagents were used as purchased. Citric acid (CA, 99.9%, Samchun), L(+)-ascorbic acid (AA, 99.5%, Samchun), hydrogen peroxide (H2O2, 34.5%, Samchun), ethylenediamine (EDA, 99%, Alfa Aesar), dimethyl sulfoxide (DMSO, >99.8%, Alfa Aesar), manganese(II) chloride tetrahydrate (MnCl2·4H2O, >98%, Acros Organics), manganese(II) sulfate monohydrate (MnSO4·H2O, >98%, Duksan), manganese(II) nitrate tetrahydrate (Mn(NO3)2·4H2O, ≥97%, Sigma Aldrich), and 3,3′,5,5′-tetramethylbenzidine (TMB, 97%, TCI).2.2 Equipment
The sizes and morphologies of the N-CD and Mn&N-CDs were examined using transmission electron microscopy (TEM, Hitachi, H-7650). The Mn content and crystalline structures of the N-CD and Mn&N-CDs were analyzed by inductively coupled plasma mass spectrometry (ICP-MS, NEXION-350X, PerkinElmer Korea) and X-ray diffraction (XRD, SmartLab, Rigaku, Japan), respectively. The chemical functional groups and compositions of the N-CD and Mn&N-CDs were investigated by Fourier-transform infrared (FT-IR) spectroscopy (Nicolet 6700, Thermo, USA) and XPS (K-Alpha+, ThermoFisher Scientific, USA), respectively.2.3 Synthesis of Mn&N-CDs
Mn&N-CDs were prepared using a hydrothermal method, which is a modified synthetic method reported in our previous work.34 First, CA (10.0 mmol), EDA (5.0 mmol), and Mn sources (5.0 mmol) were dissolved in deionized water (DIW, 15.0 mL). Next, the mixture was heated hydrothermally in a Teflon-equipped stainless-steel autoclave at 200 °C. After 1 h, the mixture was cooled to room temperature and the residue was purified using column chromatography to obtain brown Mn&N-CDs.2.4 Enzyme-mimicking activities of Mn&N-CDs
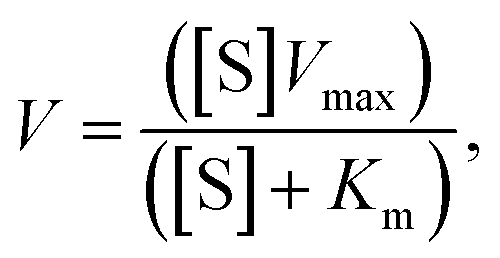
The peroxidase-like activity of the N-CD and Mn&N-CDs was measured using TMB as a substrate. A solution containing 100.0 mM H2O2, 10.0 mM TMB, and N-CD/Mn&N-CDs (500.0 μg mL−1) was mixed with a citric acid buffer (150.0 mM, pH 2). The solution was shaken thoroughly to ensure homogeneity. The absorbance of the sample at 652 nm was immediately measured using a multimode plate reader (SpectraMax M2e, Molecular Devices, LLC, USA).The relationship between the initial velocity, V, and substrate concentration, [S], is given by the Michaelis–Menten equation, as follows.
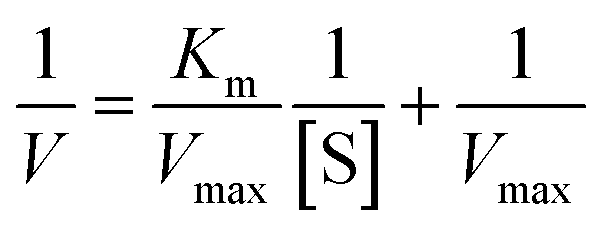
In the plot of 1/V vs. 1/[S], the ordinate and abscissa intercepts represent the inverse of Vmax and −1/Km, respectively; Km and Vmax values were estimated from these intercepts.
2.5 Detection of AA using the colorimetric sensor system
AA was detected using a colorimetric assay with TMB as the substrate. First, a mixture of H2O2 (100.0 mM), AA (5.0, 10.0, 20.0, 25.0, 30.0, 40.0, and 50.0 μM), and Mn&N-CDs (500.0 μg mL−1) was incubated for 15 min. Next, TMB (10.0 mM) was added to the mixture. After mixing, the absorbance of the solution was measured at 652 nm using a multimode plate reader.3 Results and discussion
Mn&N-CDs were prepared using a synthetic method similar to that of N-CD preparation which was previously reported.34,41 Various Mn sources, including MnCl2, MnSO4, and Mn(NO3)2, were added to the reaction solution containing CA and EDA (Fig. 1). Each CD is indicated as Mn&N-CDs depending on the Mn source used: MnCl2–Mn&N-CD_Cl, MnSO4–Mn&N-CD_SO4, and Mn(NO3)2–Mn&N-CD_NO3. The synthesized N-CD and Mn&N-CDs were confirmed to have spherical shapes, as shown in the TEM image (Fig. 1). The sizes of Mn&N-CDs were measured as 2.4 ± 0.6 (Mn&N-CD_Cl), 3.3 ± 1.1 (Mn&N-CD_SO4), and 3.0 ± 0.8 nm (Mn&N-CD_NO3), respectively (Fig. 1 c, e, and g inset) which are similar to that of the N-CD (3.5 ± 0.6 nm, Fig. 1a). High-resolution TEM images revealed that all N-CD and Mn&N-CDs had crystalline structures with a lattice spacing of ca. 0.2 nm, which corresponds to the spacing of the (100) plane of graphite (Fig. 1b, d, f, and h).52,53 The XRD patterns of all Mn&N-CDs exhibited broad diffraction peaks centered around approximately 19°, which is attributed to the (002) lattice spacing of typical carbon-based materials34,41,51,53 (Fig. S1†). Mn&N-CD_Cl exhibited additional peaks around 30°, which are attributed to a defective-carbon structure derived from the ordered sp2 layers in metal-doped CDs.54,55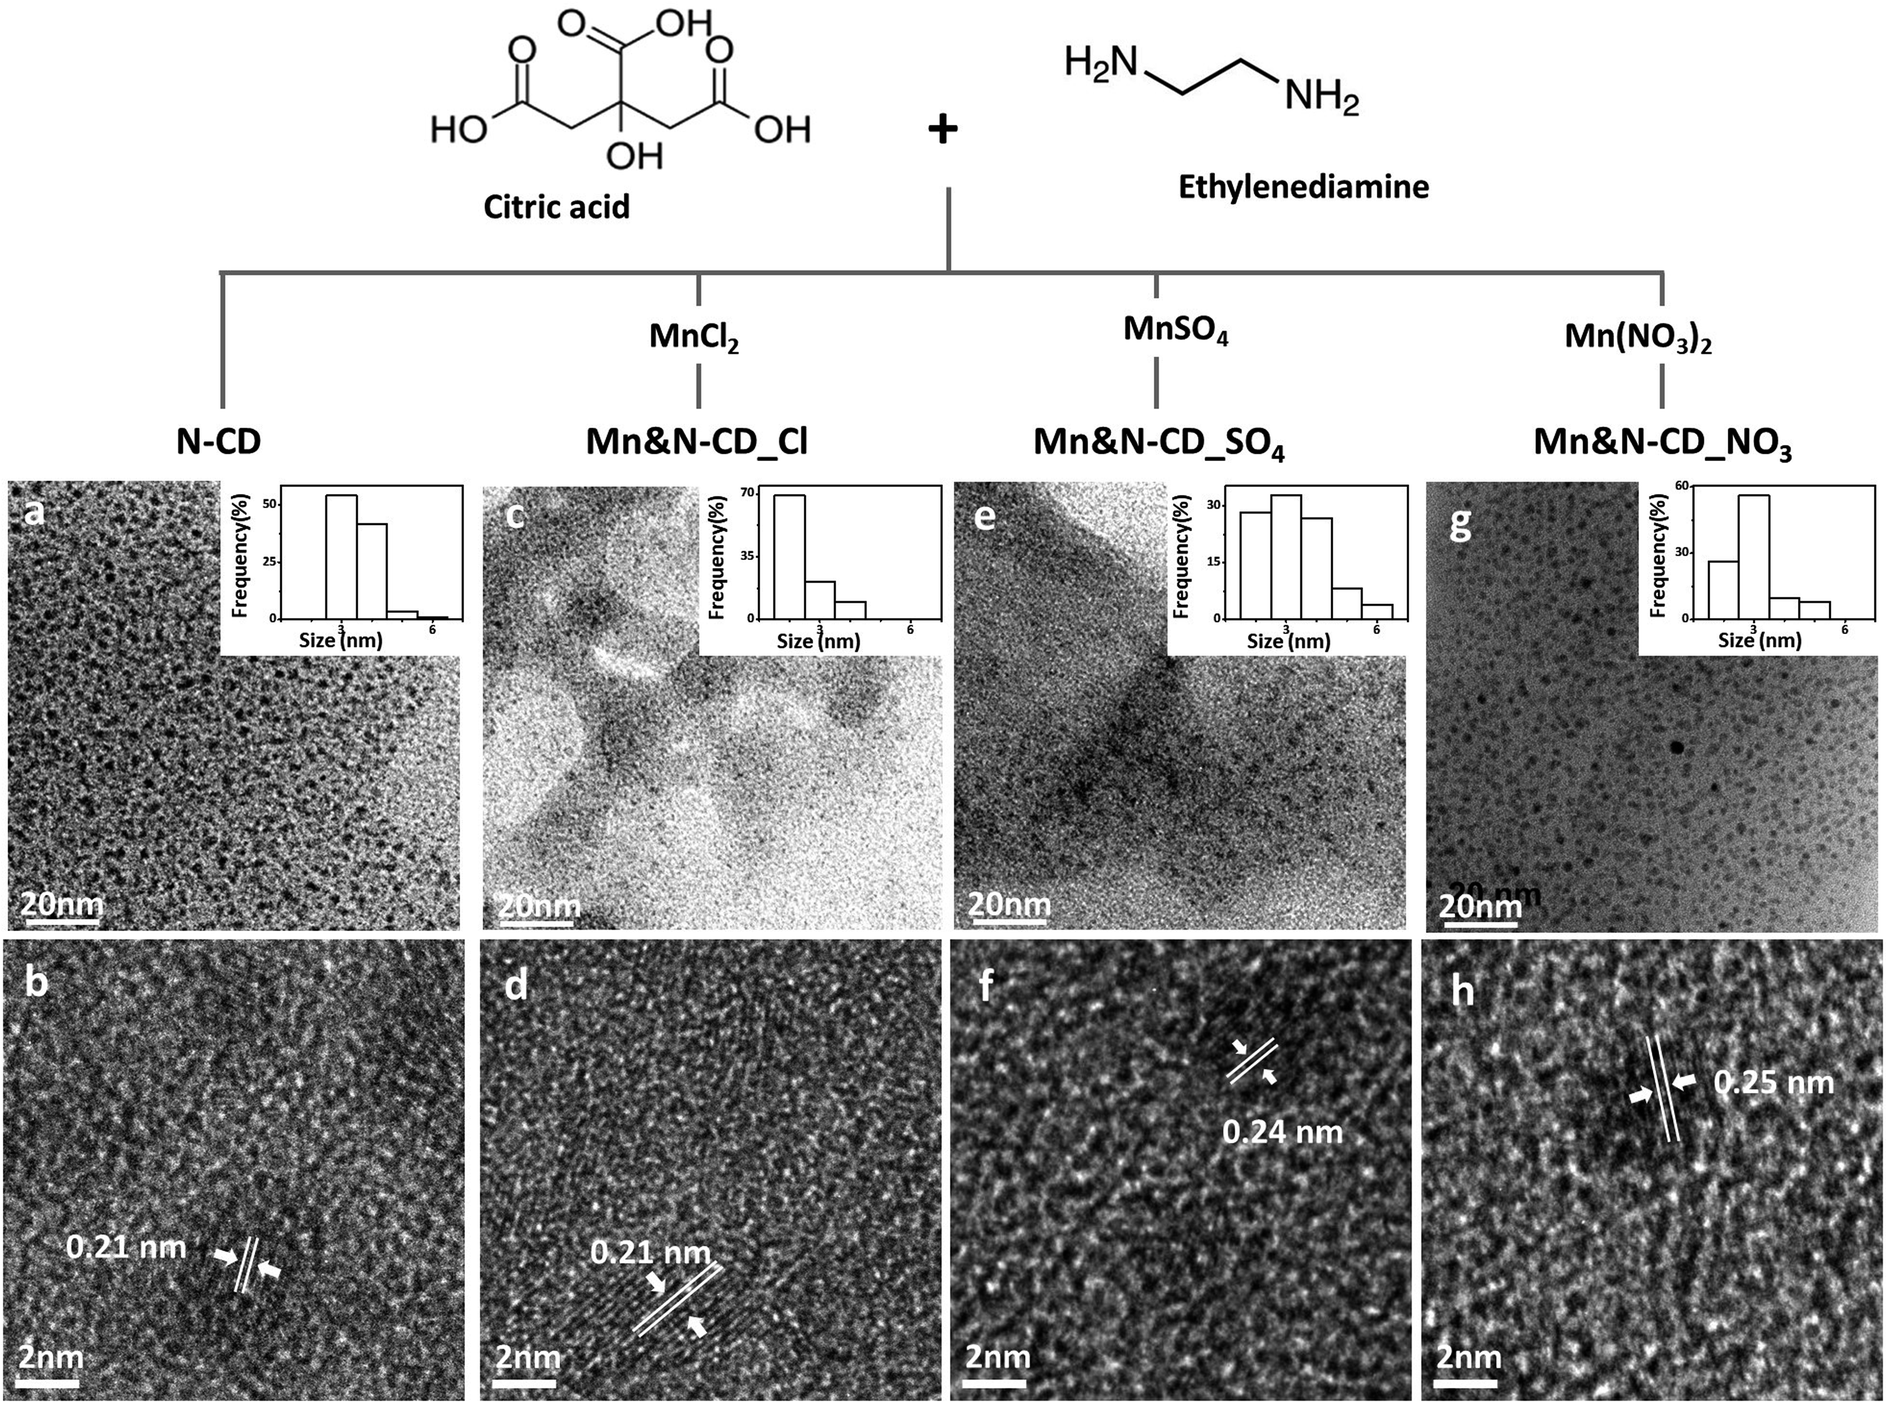 | ||
| Fig. 1 Scheme of the synthesis accompanied by low- and high-resolution TEM images of N-CD and Mn&N-CDs: (a), (b) N-CD; (c), (d) Mn&N-CD_Cl; (e), (f) Mn&N-CD_SO4; and (g), (h) Mn&N-CD_NO3. | ||
The chemical structure and composition of Mn&N-CDs were investigated using FT-IR spectroscopy and XPS. A comparison between the FT-IR spectra of N-CDs and Mn&N-CDs revealed that most compositions of the chemical functional groups were similar (Fig. S2†). However, the spectra of Mn&N-CDs_Cl and Mn&N-CDs_SO4 exhibited negligible peak intensities at 1560 cm−1, which corresponds to the stretching of the N–O bond. Strong peak intensity of N–O appeared in the spectrum of Mn&N-CD_NO3. In addition, Mn&N-CD_SO4 exhibited a significantly increased peak intensity at 1305 cm−1, corresponding to the S![[double bond, length as m-dash]](https://www.rsc.org/images/entities/char_e001.gif) O bond. The chemical compositions of the N-CD and Mn&N-CDs were analyzed using XPS. In the XPS survey profiles of the N-CD and Mn&N-CDs (Fig. 2a), C1s, N1s, and O1s signals were observed. The Mn2p peak at 641 eV (marked with a red arrow),42,49,56 appeared only in the spectra of Mn&N-CD_Cl. Based on the area of each peak in the XPS spectra (Fig. S3†), Mn&N-CD_Cl possessed 1.8 mol% of Mn ions, which is similar to the amount of Mn measured using ICP-MS (2.5 mol% of Mn ions, Fig. S4†). Essentially, Mn ions were barely doped into the other Mn&N-CDs. The atomic compositions (C and O) of Mn&N-CD_Cl were similar to those of the N-CD; however, Mn&N-CD_Cl possessed less N. Mn&N-CD_SO4 possessed the highest carbon proportion compared with the other CDs. Mn&N-CDs_NO3 tended to possess fewer carbons and more heteroatoms compared with the N-CD. Moreover, differences in functional groups composed of N-CD and Mn&N-CDs were observed. Detailed information on the chemical bonding of each atomic component was investigated through spectral peak fitting of the high-resolution C1s, N1s, and O1s spectra based on the reported chemical bond values, as shown in Fig. 2. In the C1s spectra, a strong peak at 284 eV corresponding to the C–C/CC bond of the carbogenic domain was observed for Mn&N-CD_Cl and Mn&N-CD_SO4, whereas the N-CD and Mn&N-CD_NO3 exhibited higher peak ratios of C–O (285.5 eV) and CO (288.0 eV). The majority of N among all the CDs was pyrrolic N (399.7 eV) at the edge of the carbogenic domain, and some N atoms located in the sp2 carbogenic domain as graphitic N (401.5 eV). A peak corresponding to pyridinic N (398 eV) appeared in the spectra of Mn&N-CDs, unlike that of the N-CD. Among all the Mn&N-CDs, Mn&N-CD_Cl exhibited the smallest peak area for pyrrolic N and the highest peak area for graphitic N. The O1s spectra were composed of two peaks corresponding to the C–O and CO bonds (532.6 and 531.1 eV, respectively) in all the CD spectra. Mn&N-CD_Cl exhibited an additional peak at 529.9 eV, which originates from O–Mn–O57 owing to Mn doping in the CDs. In addition, the peak at 641.0 eV (MnO satellite peak)51,56,58 in the Mn2p spectra of Mn&N-CD_Cl indicates that Mn ions are coordinated to oxygen. The peak density calculation revealed that the oxidation state of doped Mn is a mixture of Mn2+ and Mn3+.49 These results suggest that metal sources likely influence the formation of CDs in terms of chemical structure.
O bond. The chemical compositions of the N-CD and Mn&N-CDs were analyzed using XPS. In the XPS survey profiles of the N-CD and Mn&N-CDs (Fig. 2a), C1s, N1s, and O1s signals were observed. The Mn2p peak at 641 eV (marked with a red arrow),42,49,56 appeared only in the spectra of Mn&N-CD_Cl. Based on the area of each peak in the XPS spectra (Fig. S3†), Mn&N-CD_Cl possessed 1.8 mol% of Mn ions, which is similar to the amount of Mn measured using ICP-MS (2.5 mol% of Mn ions, Fig. S4†). Essentially, Mn ions were barely doped into the other Mn&N-CDs. The atomic compositions (C and O) of Mn&N-CD_Cl were similar to those of the N-CD; however, Mn&N-CD_Cl possessed less N. Mn&N-CD_SO4 possessed the highest carbon proportion compared with the other CDs. Mn&N-CDs_NO3 tended to possess fewer carbons and more heteroatoms compared with the N-CD. Moreover, differences in functional groups composed of N-CD and Mn&N-CDs were observed. Detailed information on the chemical bonding of each atomic component was investigated through spectral peak fitting of the high-resolution C1s, N1s, and O1s spectra based on the reported chemical bond values, as shown in Fig. 2. In the C1s spectra, a strong peak at 284 eV corresponding to the C–C/CC bond of the carbogenic domain was observed for Mn&N-CD_Cl and Mn&N-CD_SO4, whereas the N-CD and Mn&N-CD_NO3 exhibited higher peak ratios of C–O (285.5 eV) and CO (288.0 eV). The majority of N among all the CDs was pyrrolic N (399.7 eV) at the edge of the carbogenic domain, and some N atoms located in the sp2 carbogenic domain as graphitic N (401.5 eV). A peak corresponding to pyridinic N (398 eV) appeared in the spectra of Mn&N-CDs, unlike that of the N-CD. Among all the Mn&N-CDs, Mn&N-CD_Cl exhibited the smallest peak area for pyrrolic N and the highest peak area for graphitic N. The O1s spectra were composed of two peaks corresponding to the C–O and CO bonds (532.6 and 531.1 eV, respectively) in all the CD spectra. Mn&N-CD_Cl exhibited an additional peak at 529.9 eV, which originates from O–Mn–O57 owing to Mn doping in the CDs. In addition, the peak at 641.0 eV (MnO satellite peak)51,56,58 in the Mn2p spectra of Mn&N-CD_Cl indicates that Mn ions are coordinated to oxygen. The peak density calculation revealed that the oxidation state of doped Mn is a mixture of Mn2+ and Mn3+.49 These results suggest that metal sources likely influence the formation of CDs in terms of chemical structure.
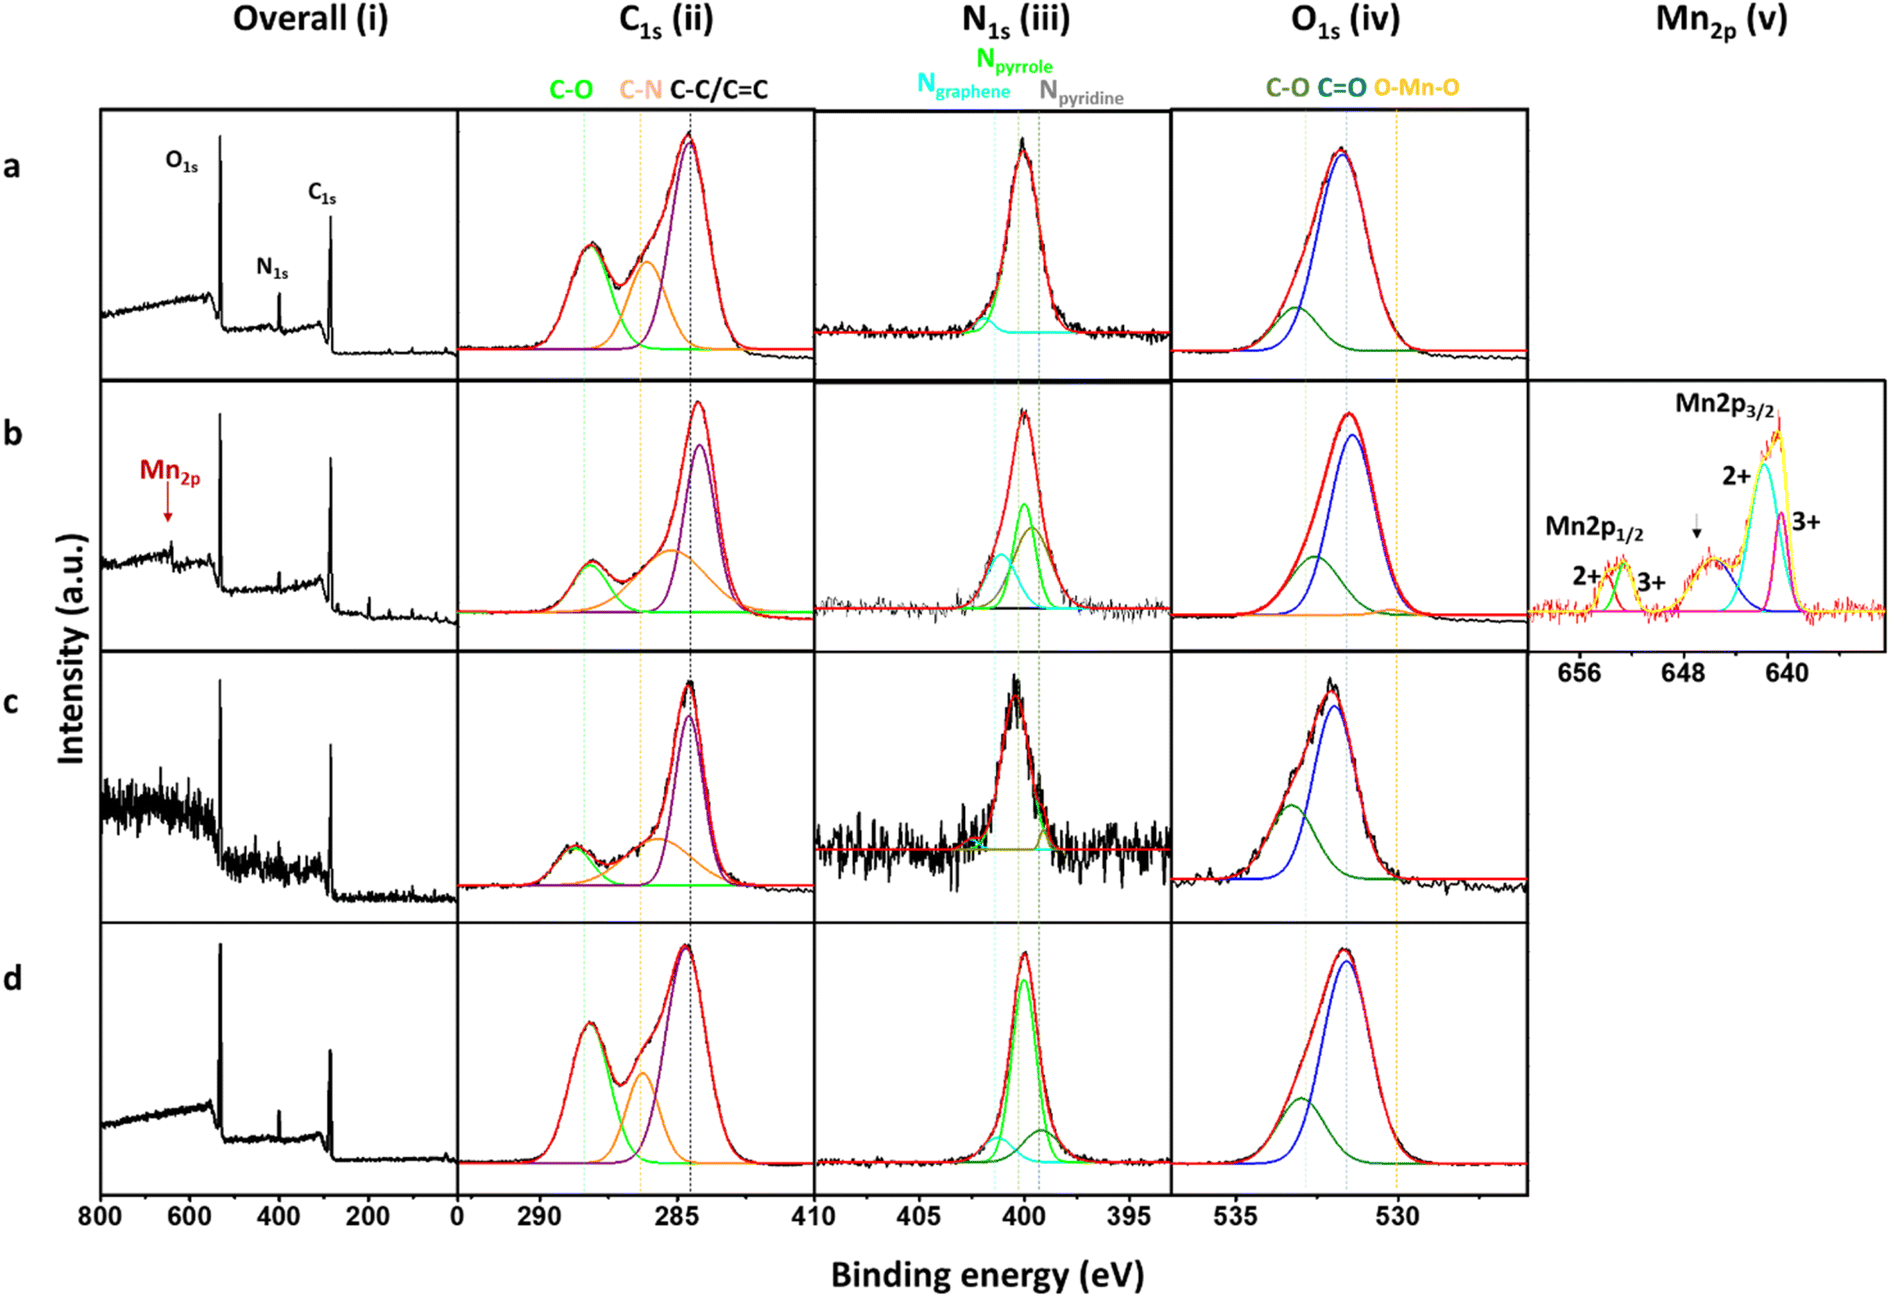 | ||
| Fig. 2 Survey scan and high-resolution XPS spectra of the (a) N-CD, (b) Mn&N-CD_Cl, (c) Mn&N-CD_SO4, and (d) Mn&N-CD_NO3. | ||
Different anions in metal sources having the same type of metal ion can affect the chemical composition and structure of CDs. In particular, considering the high proportion of SO and N–O in Mn&N-CD_SO4 and Mn&N-CD_NO3, anions can bind to the carbogenic domain during the synthesis stage, although the coordination of Cl in Mn&N-CD_Cl was not confirmed by IR spectroscopy. The coordinated anions can affect the formation of the carbogenic domain owing to their different properties (e.g., electron-withdrawing capability) in various reactions, such as aromatic substitution.59–61 As strong withdrawing groups deactivate aromatic substitution, Mn&N-CD_NO3 might possess a smaller population of sp2 domains than other Mn&N-CDs. In addition, strong electron-withdrawing groups may inhibit the coordination of metal ions into CD structures. Therefore, the addition of metal salts can be an effective method for controlling the physicochemical properties of CDs.
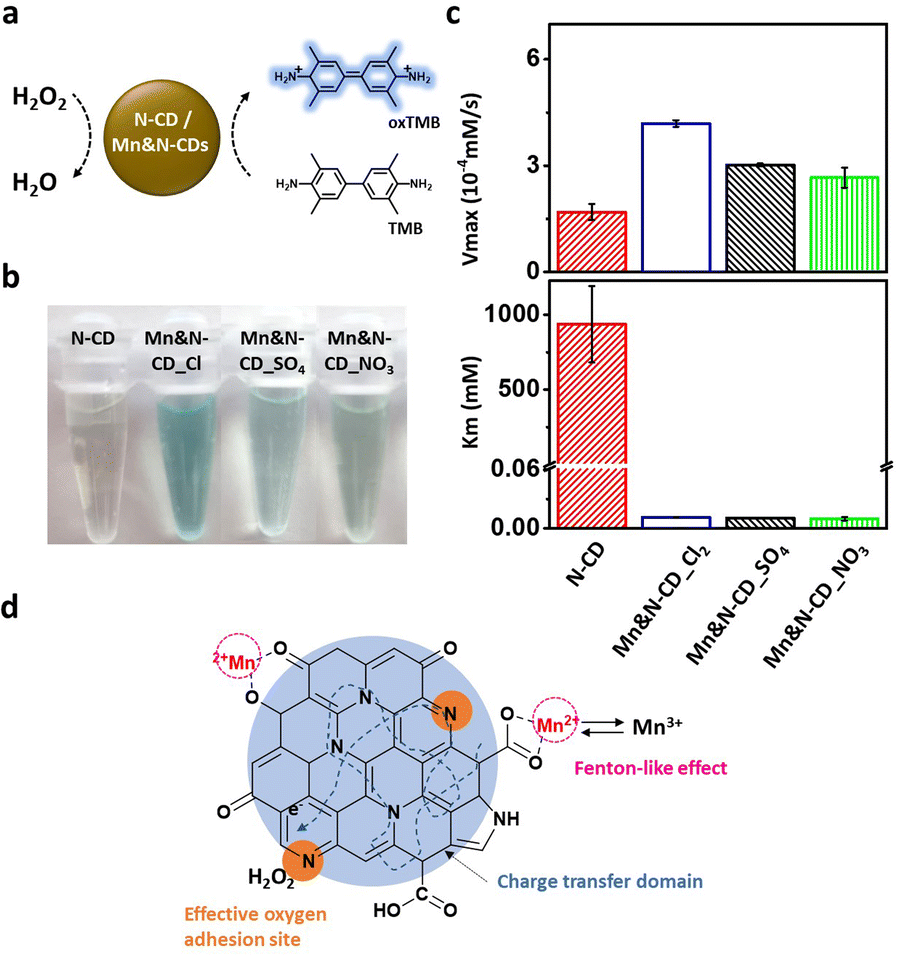
Next, the enzyme-mimicking activities of the N-CD and Mn&N-CDs were compared. As N-CDs have been confirmed to show peroxidase-like activity in our previous study, the peroxidase-like activities of Mn&N-CDs were examined herein by monitoring the change in color of the TMB (10.0 mM) and H2O2 (100 mM) solution at pH 2 (Fig. 3a). With Mn&N-CDs, the color of the TMB solution changed from pale yellow to blue because of the oxidation of TMB (Fig. 3b), whereas the N-CD exhibited a faint color change under the same experimental conditions. Among the Mn&N-CDs, Mn&N-CD_Cl exhibited the strongest blue color, thereby exhibiting superior peroxidase-like activity. The enzymatic activity of the Mn&N-CDs was estimated by calculating the Vmax and Km of the reaction in the presence of TMB and H2O2 at various concentrations using the Lineweaver–Burk equation (Fig. 3c). Mn&N-CDs yielded higher Vmax values than that of the N-CD, and Mn&N-CD_Cl exhibited superior Vmax values (ca. 3 times higher than that of the N-CD). Further, the Km values of all the Mn&N-CDs were much lower than that of the N-CD; thus, Mn&N-CDs have a higher affinity for H2O2. Overall, Mn&N-CD_Cl exhibited high Vmax and low Km values, thus resulting in exceptional peroxidase-like activity as shown in Fig. 3b. It is interesting to note that the optical properties of Mn&N-CDs, including their absorption and emission spectra, remained similar to those of N-CDs despite Mn doping and the chemical structure variation (Fig. S5†). Additionally, under ambient conditions, Mn&N-CDs exhibit stable catalytic properties as long as they are not directly exposed to light (Fig. S6†).
 | ||
| Fig. 3 (a) Schematic of the peroxidase mimetic activity of the N-CD and Mn&N-CDs, (b) images of TMB/H2O2 solutions with the N-CD or Mn&N-CDs. (c) Comparison of the Vmax and Km values of the N-CD and Mn&N-CDs; these were calculated using the Lineweaver–Burk plot (n = 3). (d) Schematics of synergistic charge transfer in Mn&N-CD_Cl. | ||
The catalytic effect of the Mn&N-CDs seems to be highly dependent on their chemical composition and structure. In particular, the heteroatoms in Mn&N-CDs can play a critical role in their catalytic effects. First, the bond character of the N dopant in Mn&N-CDs affected both Vmax and Km. The relatively high portion of pyridinic N in Mn&N-CDs compared to that of N-CD may enhance the affinity to H2O2. In addition, Mn&N-CD_Cl possessed the highest population of graphitic N atoms, which facilitated the adsorption of molecular oxygen to generate radical oxygen species on nearby carbon atoms,2,22,62–64 and the lowest population of Npyrrole, which does not have excess electrons to interact with H2O2.65 Second, the Mn ions in Mn&N-CD_Cl highly enhanced their catalytic effect through Fenton-like oxidation of Mn2+ to Mn3+. In addition, the coordination of metals in the carbogenic core appeared to improve charge transfer and transport for the catalytic reaction.25,38,66–68 When the catalytic activity of the N-CD and Mn ion mixture was examined, no noticeable improvement in color change was observed compared with the N-CD alone (Fig. S7†). Therefore, the high proportion of pyridinic and graphitic N and the effective doping of metal ions into the carbogenic domain led to the synergistic catalytic effect of Mn&N-CD_Cl (Fig. 3d).
The excellent catalytic effect of Mn&N-CD_Cl can be applied as a colorimetric detection probe owing to the significant color change capability of the TMB/H2O2 solution. AA is a well-known ROS scavenger that controls the oxidation reactions in the body. A deficiency can lead to various diseases, such as scurvy and various cancers.69,70 In addition, when comparing coronavirus patients with noninfected individuals, a change in the concentration of AA in the body was observed.71 Therefore, periodic checking of the amount of AA in the body can help maintain health. Because AA can reduce H2O2 to H2O,72–74 it may negatively interfere with TMB oxidation. Thus, AA can be detected by the color change of a solution containing H2O2, TMB, and Mn&N-CDs (Fig. 4a). The intensity of the color change of the solution decreased in the presence of AA. This color change was more clearly observed with Mn&N-CD_Cl than the other CDs owing to its superior catalytic effect (Fig. S8†). The color of the solution gradually faded with an increase in the concentration of AA from 0 to 50 μM (Fig. 4b). In the absorption spectra of the mixed solution, the absorbance at 652 nm increased with time. However, when AA was added to the solution, no noticeable change in absorption was observed for a while. After the lag time, the absorbance gradually increased. The delayed period of absorption increased with an increasing AA concentration (Fig. 4c). Evidently, H2O2 consumption by AA was faster than the enzymatic reaction of Mn&N-CD_Cl. The absorbance change compared to a solution without AA after 40 min of mixing exhibited a linear correlation with AA concentration (Fig. 4d). Because AA concentrations in the blood of noninfected people and scurvy patients are known to be 41.2 and 11.0 μM, respectively, these values are expected to fall within the linearly proportional range and can be used for AA monitoring.
 | ||
| Fig. 4 (a) Schematic of L-AA detection using Mn&N-CD_Cl. (b) Images of the mixed solution containing Mn&N-CD_Cl, AA, TMB, and H2O2 at different concentrations of AA. (c) Kinetic curves of Mn&N-CD_Cl for different AA concentrations for monitoring the catalytic oxidation of TMB. (d) Variation in absorption (at 652 nm) of the mixed solution containing Mn&N-CD_Cl, AA, TMB, and H2O2 as a function of the concentration of AA. | ||
4 Conclusions
In this study, the effect of metal salts on the modulation of Mn doping and chemical structure in CD was investigated. The counter anion in metal salts may involve in the structure and influence the chemical structure and composition of the CDs, thereby affecting their enzymatic activity. Considering the catalytic effect of Mn&N-CDs, the synergistic catalytic effect of the CDs was induced by effective metal doping in the carbogenic domain and a high proportion of graphitic and pyridinic N. Nonetheless, the exact role of metal salts in the synthesis of CDs should be evaluated in further intensive studies. The highly enhanced catalytic effect of CDs makes them respond sensitively to enzymatic reactions. Consequently, AA, an essential nutrient for maintaining health, was successfully monitored using Mn&N-CD_Cl. This study provides a basic understanding of the formation of CDs and how their catalytic properties can be controlled, thereby providing guidelines for the development of CDs for industrial applications.Author contributions
Conceptualization, data curation, funding acquisition investigation methodology, project administration, supervision, writing – review & editing: JC; formal analysis, validation, visualization: WK, AL, TY, and BL; writing – original draft: JC and WK.Conflicts of interest
There are no conflicts to declare.Acknowledgements
This work was supported by the research fund of Hanbat National University in 2022 and National Research Foundation of Korea (NRF) grants funded by the Korean government (MSIT) (2020R1C1C1011863 and 2020R1A5A8017671).References
- M. Bilal, N. Khaliq, M. Ashraf, N. Hussain, Z. Baqar, J. Zdarta, T. Jesionowski and H. M. N. Iqbal, Colloids Surf., B, 2023, 221, 112950 CrossRef CAS PubMed.
- Y. Zhang, Y. Jin, H. Cui, X. Yan and K. Fan, RSC Adv., 2020, 10, 10–20 RSC.
- Y. Huang, J. Ren and X. Qu, Chem. Rev., 2019, 119, 4357–4412 CrossRef CAS PubMed.
- D. He, M. Yan, P. Sun, Y. Sun, L. Qu and Z. Li, Chin. Chem. Lett., 2021, 32, 2994–3006 CrossRef CAS.
- D. Jiang, D. Ni, Z. T. Rosenkrans, P. Huang, X. Yan and W. Cai, Chem. Soc. Rev., 2019, 48, 3683–3704 RSC.
- Q. Wang, E. Pang, Q. Tan, S. Zhao, J. Yi, J. Zeng and M. Lan, Wiley Interdiscip. Rev. Nanomed., 2022, e1862 Search PubMed.
- A. Mei, Z. Xu, X. Wang, Y. Liu, J. Chen, J. Fan and Q. Shi, Environ. Res., 2022, 214, 114160 CrossRef CAS PubMed.
- X. Wang, H. Wang and S. Zhou, J. Phys. Chem. Lett., 2021, 12, 11751–11760 CrossRef CAS PubMed.
- J. Jin, L. Li, L. Zhang, Z. Luan, S. Xin and K. Song, Front. Chem., 2021, 9, 748044 CrossRef CAS PubMed.
- S. Sahani, K. Malika Tripathi, T. Il Lee, D. P. Dubal, C.-P. Wong, Y. Chandra Sharma and T. Young Kim, Energy Convers. Manage., 2022, 252, 115133 CrossRef CAS.
- Y. Vyas, P. Chundawat, D. Dharmendra, P. B. Punjabi and C. Ameta, Int. J. Hydrogen Energy, 2021, 46, 37208–37241 CrossRef CAS.
- H. Sun, Y. Zhou, J. Ren and X. Qu, Angew. Chem., Int. Ed., 2018, 57, 9224–9237 CrossRef CAS PubMed.
- X. Zhang, X. Chen and Y. Zhao, Nano-Micro Lett., 2022, 14, 95 CrossRef CAS PubMed.
- M. Raaja Rajeshwari, S. Kokilavani and S. Sudheer Khan, Chemosphere, 2022, 291, 132735 CrossRef CAS PubMed.
- M. N. Jackson, M. L. Pegis and Y. Surendranath, ACS Cent. Sci., 2019, 5, 831–841 CrossRef CAS PubMed.
- R. E. Warburton, P. Hutchison, M. N. Jackson, M. L. Pegis, Y. Surendranath and S. Hammes-Schiffer, J. Am. Chem. Soc., 2020, 142, 20855–20864 CrossRef CAS PubMed.
- L. Li and T. Dong, J. Mater. Chem. C, 2018, 6, 7944–7970 RSC.
- B. Domingo-Tafalla, E. Martínez-Ferrero, F. Franco and E. Palomares-Gil, Molecules, 2022, 27, 1081 CrossRef CAS PubMed.
- J. Liu, R. Li and B. Yang, ACS Cent. Sci., 2020, 6, 2179–2195 CrossRef CAS PubMed.
- Y. Wang, X. Li, S. Zhao, B. Wang, X. Song, J. Xiao and M. Lan, Coord. Chem. Rev., 2022, 470, 214703 CrossRef CAS.
- V. L. John, Y. Nair and T. P. Vinod, Part. Part. Syst. Charact., 2021, 38, 2100170 CrossRef CAS.
- Y. Hu, X. J. Gao, Y. Zhu, F. Muhammad, S. Tan, W. Cao, S. Lin, Z. Jin, X. Gao and H. Wei, Chem. Mater., 2018, 30, 6431–6439 CrossRef CAS.
- S. Bhattacharyya, F. Ehrat, P. Urban, R. Teves, R. Wyrwich, M. Döblinger, J. Feldmann, A. S. Urban and J. K. Stolarczyk, Nat. Commun., 2017, 8, 1401 CrossRef PubMed.
- W. Yang, T. Huang, M. Zhao, F. Luo, W. Weng, Q. Wei, Z. Lin and G. Chen, Talanta, 2017, 164, 1–6 CrossRef CAS PubMed.
- K. Dehvari, S.-H. Chiu, J.-S. Lin, W. M. Girma, Y.-C. Ling and J.-Y. Chang, Acta Biomater., 2020, 114, 343–357 CrossRef CAS PubMed.
- K. Luo, Y. Wen and X. Kang, Molecules, 2022, 27, 4620 CrossRef CAS PubMed.
- P. Gong, J. Wang, K. Hou, Z. Yang, Z. Wang, Z. Liu, X. Han and S. Yang, Carbon, 2017, 112, 63–71 CrossRef CAS.
- X. Li, Y. Fu, S. Zhao, J. Xiao, M. Lan, B. Wang, K. Zhang, X. Song and L. Zeng, Chem. Eng. J., 2022, 430, 133101 CrossRef CAS.
- L. Lin, Y. Luo, P. Tsai, J. Wang and X. Chen, TrAC, Trends Anal. Chem., 2018, 103, 87–101 CrossRef CAS.
- Z.-Y. Wu, S.-L. Xu, Q.-Q. Yan, Z.-Q. Chen, Y.-W. Ding, C. Li, H.-W. Liang and S.-H. Yu, Sci. Adv., 2018, 4, eaat0788 CrossRef CAS PubMed.
- J. Cheng, C.-F. Wang, Y. Zhang, S. Yang and S. Chen, RSC Adv., 2016, 6, 37189–37194 RSC.
- R. Miao, S. Zhang, J. Liu and Y. Fang, Chem. Mater., 2017, 29, 5957–5964 CrossRef CAS.
- S. Yun, E. S. Kang and J. Choi, Nanoscale Adv., 2022, 4, 2029–2035 RSC.
- A. Lee, W. Kang and J. Choi, Nanomaterials, 2021, 11, 3046 CrossRef CAS PubMed.
- S. Hussain, E. Aneggi and D. Goi, Environ. Chem. Lett., 2021, 19, 2405–2424 CrossRef CAS.
- J. Ding, Y.-G. Sun and Y.-L. Ma, ACS Omega, 2021, 6, 2949–2955 CrossRef CAS PubMed.
- J. Zhang, S. Wu, X. Lu, P. Wu and J. Liu, Nano Lett., 2019, 19, 3214–3220 CrossRef CAS PubMed.
- S. Daniel, M. G. Praveena and E. M. Mohammed, Mater. Sci. Eng., B, 2021, 269, 115145 CrossRef CAS.
- J. Li, Y. Zhao, L. Sun, A. Liang and Z. Jiang, Vib. Spectrosc., 2022, 118, 103334 CrossRef CAS.
- C. Li, Z. Qin, M. Wang, W. Liu, H. Jiang and X. Wang, Anal. Chim. Acta, 2020, 1104, 125–131 CrossRef CAS PubMed.
- A. Lee, S. Yun, E. S. Kang, J. W. Kim, J. H. Park and J. Choi, RSC Adv., 2021, 11, 18776–18782 RSC.
- N. Irmania, K. Dehvari, G. Gedda, P. Tseng and J. Chang, J. Biomed. Mater. Res. Part B Appl. Biomater., 2020, 108, 1616–1625 CrossRef CAS PubMed.
- X. Chu, G. Ning, Z. Zhou, Y. Liu, Q. Xiao and S. Huang, Microchim. Acta, 2020, 187, 659 CrossRef CAS PubMed.
- L. Li, Y. Deng, J. Ai, L. Li, G. Liao, S. Xu, D. Wang and W. Zhang, Sep. Purif. Technol., 2021, 263, 118409 CrossRef CAS.
- R. Kannan, A. R. Kim, S. K. Eo, S. H. Kang and D. J. Yoo, Ceram. Int., 2017, 43, 3072–3079 CrossRef CAS.
- A. Sachdev and P. Gopinath, ChemNanoMat, 2016, 2, 226–235 CrossRef CAS.
- Y. Hu, L. Zhang, S. Chen, L. Hou, S. Zhao, Y. Huang and H. Liang, Nanoscale Adv., 2021, 3, 6869–6875 RSC.
- T. Luo, Y. Nie, J. Lu, Q. Bi, Z. Cai, X. Song, H. Ai and R. Jin, ACS Omega, 2021, 208, 109878 CAS.
- S. Sun, L. Zhao, D. Wu, H. Zhang, H. Lian, X. Zhao, A. Wu and L. Zeng, ACS Appl. Bio Mater., 2021, 4, 1969–1975 CrossRef CAS PubMed.
- S. Zhuo, J. Fang, M. Li, J. Wang, C. Zhu and J. Du, Microchim. Acta, 2019, 186, 745 CrossRef CAS PubMed.
- Y. Wang, T. Wang, X. Chen, Y. Xu and H. Li, Opt. Mater., 2018, 78, 118–125 CrossRef CAS.
- A. Pal, M. P. Sk and A. Chattopadhyay, Mater. Adv., 2020, 1, 525–553 RSC.
- X. Miao, D. Qu, D. Yang, B. Nie, Y. Zhao, H. Fan and Z. Sun, Adv. Mater., 2018, 30, 1704740 CrossRef PubMed.
- Q. Xu, R. Su, Y. Chen, S. Theruvakkattil Sreenivasan, N. Li, X. Zheng, J. Zhu, H. Pan, W. Li, C. Xu, Z. Xia and L. Dai, ACS Appl. Nano Mater., 2018, 1, 1886–1893 CrossRef CAS.
- Q. Xu, Y. Liu, R. Su, L. Cai, B. Li, Y. Zhang, L. Zhang, Y. Wang, Y. Wang, N. Li, X. Gong, Z. Gu, Y. Chen, Y. Tan, C. Dong and T. S. Sreeprasad, Nanoscale, 2016, 8, 17919 RSC.
- H. Fan, G. Q. Xiang, Y. Wang, H. Zhang, K. Ning, J. Duan, L. He, X. Jiang and W. Zhao, Spectrochim. Acta A Mol. Biomol. Spectrosc., 2018, 205, 221–226 CrossRef CAS PubMed.
- Z. Yang, J. Lv, H. Pang, W. Yan, K. Qian, T. Guo and Z. Guo, Sci. Rep., 2015, 5, 17473 CrossRef CAS PubMed.
- Y. Wang, Y. Zhang, M. Jia, M. Hu, L. Hui, Y. Guan and F. Liang, Chem. – Eur. J., 2015, 21, 14843–14850 CrossRef CAS PubMed.
- J. Munárriz, M. Gallegos, J. Contreras-García and Á. M. Pendás, Molecules, 2021, 26, 513 CrossRef PubMed.
- B. Galabov, D. Nalbantova, P. R. Schleyer and H. F. Schaefer, Acc. Chem. Res., 2016, 49, 1191–1199 CrossRef CAS PubMed.
- L. Jiang, T. Chen, E. Song, Y. Fan, D. Min, L. Zeng and G.-M. Bao, Chem. Eng. J., 2022, 427, 131563 CrossRef CAS.
- Z. Lou, S. Zhao, Q. Wang and H. Wei, Anal. Chem., 2019, 91, 15267–15274 CrossRef CAS PubMed.
- H. Zhang, S. Hwang, M. Wang, Z. Feng, S. Karakalos, L. Luo, Z. Qiao, X. Xie, C. Wang, D. Su, Y. Shao and G. Wu, J. Am. Chem. Soc., 2017, 139, 14143–14149 CrossRef CAS PubMed.
- R. M. Pallares, X. Su, S. H. Lim and N. T. K. Thanh, J. Mater. Chem. C, 2016, 4, 53–61 RSC.
- S. Sarkar, M. Sudolská, M. Dubecký, C. J. Reckmeier, A. L. Rogach, R. Zbořil and M. Otyepka, J. Phys. Chem. C, 2016, 120, 1303–1308 CrossRef CAS.
- H. Gao, Y. Wang, W. Li, S. Zhou, S. Song, X. Tian, Y. Yuan, Y. Zhou and J. Zang, Int. J. Hydrogen Energy, 2021, 46, 36742–36752 CrossRef CAS.
- M. W. Abbas, R. A. Soomro, N. H. Kalwar, M. Zahoor, A. Avci, E. Pehlivan, K. R. Hallam and M. Willander, Microchem. J., 2019, 146, 517–524 CrossRef CAS.
- H. Wang, Z. Wei, H. Matsui and S. Zhou, J. Mater. Chem. A, 2014, 2, 15740–15745 RSC.
- A. Baluch and D. Landsberg, J. Investig. Med. High Impact Case Rep., 2021, 9, 232470962110679 CrossRef PubMed.
- C. R. Mayland, M. I. Bennett and K. Allan, Palliat Med., 2005, 19, 17–20 CrossRef PubMed.
- T. Patterson, C. M. Isales and S. Fulzele, Aging Dis., 2021, 12, 14 CrossRef PubMed.
- R. Grinstead, J. Am. Chem. Soc., 1960, 82, 3464–3471 CrossRef CAS.
- J. C. Deutsch, Anal. Biochem., 1998, 255, 1–7 CrossRef CAS PubMed.
- F. Martinello and E. Luiz da Silva, Clin. Chim. Acta, 2006, 373, 108–116 CrossRef CAS PubMed.
Footnotes |
| † Electronic supplementary information (ESI) available: XRD, IR spectra, XPS based relative atomic compositions, ICP-MS based Mn ion quantification, and comparison of AA detection capability of N-CD and Mn&N-CDs, and evaluation on synergistic catalytic effect of Mn&N-CD_Cl. See DOI: https://doi.org/10.1039/d3ra01001e |
| ‡ Those authors contributed equally to this work. |
| This journal is © The Royal Society of Chemistry 2023 |