 Open Access Article
Low-cost membrane from polyethylene terephthalate bottle waste for water purification and chromium removal: modification and application†
Badrut Tamam Ibnu Alia,
Yuly Kusumawatia,
Juhana Jaafarb,
Dety Oktavia Sulistionoac and
Nurul Widiastuti *a
*a
aDepartment of Chemistry, Faculty of Science and Data Analytics, Institut Teknologi Sepuluh Nopember, Jl. Arif Rahman Hakim, Kampus ITS Keputih-Sukolilo, Surabaya 60111, Indonesia. E-mail: nurul_widiastuti@chem.its.ac.id
bAdvanced Membrane Technology Research Centre (AMTEC), Universiti Teknologi Malaysia, 81310 Skudai, Johor Bahru, Malaysia
cAutomotive Engineering, Engineering Department, Politeknik Negeri Jember, Jember 68101, Indonesia
First published on 17th March 2023
Abstract
River water has become contaminated with numerous hazardous compounds due to the rapid rise in population and industry expansion. Due to unchecked population growth and the improper disposal of electroplating industrial waste, issues with river water filtration and the elimination of chromium contamination have developed. Various technologies have been developed to overcome these problems. One of the technologies that have been proposed until now is membrane technology. On the other hand, the waste from plastic bottles, which grows yearly and now weighs 381.73 million tons, can create thin films or layers. Therefore, there is a lot of potential in employing plastic bottle trash as a low-cost, sustainable, and eco-friendly membrane material. In this study, the immersion-precipitation phase inversion method was used in the membrane preparation process from plastic bottle waste by modifying fillers (zeolite-NaY) and additives (LiCl and PEG-400) to improve membrane performance. The effect of filler and additive modification on the fabricated membrane was studied for its performance in water purification and chromium ion contaminant removal. The results demonstrated that the modified LiCl membrane performed optimally for water purification and the removal of chromium ions, along with a reduction in turbidity to 1.42 NTU (from 400 NTU) and a 54.75% removal of chromium.
Introduction
The increase in global population and the number of industries in various countries cause river water pollution. The decline in river water quality makes it unfit for reuse. Turbidity, total dissolved solids (TDS), total suspended solids (TSS), pH, temperature, and color are frequently used as the basic parameters to evaluate whether water quality is suitable for consumption or not.1 In addition, industrial waste, such as chromium ions produced from the electroplating industry, pollutes river water. The Environmental Protection Agency (EPA) finds significant amounts of chromium ions in waters in India, the United States, Nepal, and Indonesia (250 times higher than the WHO-permitted level of 50 mg L−1).2 Several methods have been reported to overcome wastewater treatment problems: precipitation,3 coagulation–flocculation,4 adsorption,5 ion exchange,6 and membrane filtration.7 The adsorption method that uses heterogeneous catalysis is one of the commonly used methods. However, post-treatment after adsorption becomes a new problem in the desorption process.8 For the last 20 years, membrane technology has been reported to be more effective than adsorption in the wastewater treatment industry due to its simple, sustainable, low-energy consumption nature.9 However, high-priced membrane materials are still required for optimum membrane performance.On the other hand, the global population produces 381.73 million tons of plastic waste yearly, which is a significant issue for many nations.10 Waste made of plastic can layer or create films.11,12 Plastic bottles of polyethylene terephthalate (PET) are a type of plastic waste that is frequently encountered in daily life. Waste PET bottles are commonly reused in packaging foods and drinks13 and recycled for wastewater treatment14–17 applications. The issue of expensive membrane materials and environmental contamination could be solved using PET waste in low-cost membrane materials.
Additives and fillers must be introduced to the dope solution to improve the performance of the membranes manufactured from PET bottle waste (PET-BW). The additives used in this study were LiCl and PEG-400. LiCl is intended to lessen the development of macro voids in the membrane due to its lower molecular weight than other additives (polyvinylpyrrolidone and polyethylene oxide).18 Additionally, it is anticipated that good interaction between LiCl and water (non-solvent) will result in a sponge-like pore structure, which will increase hydrophilicity.19 According to Zheng, adding 5% LiCl to the dope solution of the PVDF membrane causes the distillation membrane to have a porosity of 70.88%, a water flux of 23 L m−2 h−1, and a rejection of 100%.20 According to other researchers, the addition of LiCl 11 improved the PSF membrane's performance in terms of salt rejection (from 94.3 to 95.3%), salt flux (from 1.23 L m−2 h−1 bar−1 to 1.43 L m−2 h−1 bar−1), and water flux (from 0.446 L m−2 h−1 bar−1 to 0.539 L m−2 h−1 bar−1).21 The membrane's porosity should rise as a result of the PEG-400 addition. The membrane's selectivity and flux in removing chromium ions from water can be improved with an increase in porosity. A study suggested that low molecular weight might increase the porosity and permeability of the resultant membrane, which led to the choice of a molecular weight of 400 Da.22 According to Kusumocahyo et al., adding PEG-400 to the dope solution caused bovine serum albumin rejection values of 91% and 90% (BSA).23 According to Ma et al., porosity and water flux increased from 0.81 L m−2 h−1 to 420 L m−2 h−1 by adding 10% PEG-400 to the membrane dope solution.24 LiCl and PEG-400 have been used as additives in polymer membranes. However, their use in membranes manufactured from PET-BW for applications, such as water purification and chromium ion removal, has not yet been reported.
Adding filler to the membrane impression solution is one way to increase the membrane's selectivity to chromium ions and particles dissolved in water. Zeolite-NaY is a filler that is easy to synthesize and is reported to produce better separation performance than metal–organic frameworks (MOF), silica, and carbon.25 Based on the negatively charged nucleophilic functional groups in a zeolite (OH, Si–O–Al, Al–O–Al, O–Si–O), zeolite-NaY has a good interaction with heavy metal ions (positively charged) in wastewater as compared to other types of zeolite, such as ZnO zeolite, ZSM-5 zeolite, and Z zeolite.26–28 The selection of zeolite is based on its distinctive characteristics, including its uniformly sized pores made of aluminosilicate in a tetrahedral shape with excellent thermal and chemical stability and the location of the oxygen atom in the corner of the geometric design. Additionally, zeolites can overcome polymer membrane drawbacks, such as thermal decomposition or distortion, at high temperatures and pressures.29 Using zeolite is expected to increase the percentage of rejection of chromium ions and particles dissolved in water. Generally, zeolites are used as fillers in gas separation applications.30 Zeolites have not yet been reported for use in water purification and chromium ion removal.
This project investigates the conversion of PET-BW into a low-cost, sustainable, and ecologically friendly membrane material for water purification and chromium ion removal application. The membranes were prepared by immersion-soak phase inversion technique. LiCl and PEG-400 additives and zeolite-NaY filler were used to improve membrane performance for water purification and chromium ion removal.
Experimental
Materials
The polymer was obtained from drinking water bottle waste made from polyethylene terephthalate (PET). Polyethylene glycol (PEG-400), sodium dichromate (K2Cr2O7, 99%), ethanol (C2H5OH, 99%), and phenol (C6H6O, 99%) were bought from Merck and Germani. Sigma-Aldrich supplied the lithium chloride (LiCl, 99%), and zeolite-NaY was synthesized in a previous study28 and PT. Bratachem Indonesia provided demineralized water.Membrane preparation
We prepared membranes from PET-BW that involved the immersion precipitation phase inversion. The PET-BW was cleaned and dried for 30 minutes in a 45 °C oven. Next, a 1 × 1 cm piece of a dry plastic bottle was cut out. Additionally, until homogenous, up to 17% of PET waste was gradually added to a Duran container containing 83% phenol. No light was present, and the temperature was 100 °C. The stirring speed was maintained at 200 rpm during the dissolution process. Before the membrane casting, the homogenized dope solution was bubbled using a sonicator for 15 minutes. Following the casting procedure, an immersion was performed to undergo a phase change into a membrane in a coagulation bath that contained ethanol and water in a ratio of 15![[thin space (1/6-em)]](https://www.rsc.org/images/entities/char_2009.gif) :
:![[thin space (1/6-em)]](https://www.rsc.org/images/entities/char_2009.gif) 1 (v/v).
1 (v/v).
The modification was done by adding additives (LiCl and PEG-400) and filler (zeolite-NaY) in PET dope solution. The dissolution of additives and fillers was carried out separately by dividing the amount of solvent used. The dope solution containing homogeneous additives and fillers was combined with the PET dope solution prepared with the same dissolution conditions. The concentrations of LiCl and PEG-400 additives used were 4, 6, 8%, and 20, 30, and 40%, respectively, by weight of the polymer. The concentration of zeolite-NaY added was 2, 4, and 6% by weight of the polymer. Table 1 shows the chemical makeup of the dope solution.
| Membranes (symbol name) | Composition of the dope solution (%) | ||||
|---|---|---|---|---|---|
| Polymer | Solvent | LiCl | PEG-400 | Zeolite-NaY | |
| M1 | 17 | 83 | — | — | — |
| M2 | 17 | 83 | — | 2 | — |
| M3 | 17 | 83 | — | 3 | — |
| M4 | 17 | 83 | — | 4 | — |
| M5 | 17 | 83 | 4 | — | — |
| M6 | 17 | 83 | 6 | — | — |
| M7 | 17 | 83 | 8 | — | — |
| M8 | 17 | 83 | — | — | 2 |
| M9 | 17 | 83 | — | — | 4 |
| M10 | 17 | 83 | — | — | 6 |
Membrane characterization
Membrane characterization includes determining the functional group analysis, surface cross-section, cross-section, hydrophilicity, and porosity. Before and after modification of the PET-BW membrane, the functional groups were determined using the Fourier transform infrared (FTIR), Shimadzu, in the 400–4000 cm−1 wavenumber region. Using a scanning electron microscope (SEM), Zeiss EVO MA10, it was examined how additives and fillers affect the surface and cross-sectional morphology of the PET-BW membrane. The dynamic sessile drop method and the contact angle readings acquired with the CAM 200 instrument were used to compare the hydrophilicity of the PET-BW membrane before and after modification. The gravimetric method was used to calculate the membrane porosity.31 The porosity of the membrane was determined using eqn (1).
 | (1) |
Membrane performance test
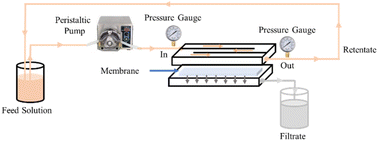
The feed solution used was Brantas River water in Surabaya, Indonesia, and chromium solution. The polluted water of the Brantas Surabaya River was a challenge to be treated appropriately with membrane technology. For the chromium solution, the 10 ppm chromium feed solution was created by dissolving 10 milligrams of K2Cr2O7 in 1000 mL of distilled water (Cf). For the creation of calibration curves, standard solutions with a concentration of 0.2 to 1.0 ppm were prepared.The 500 mL feed solution was filtered with the M1–M10 membranes for 40 minutes at a flow rate of 200 mL per minute and a pressure of 1 bar. A cross-flow module (Sartorius, Vivaflow 50R) and a peristaltic pump (FSD 400, SNI 0089) were used during the filtration process (Fig. 1). Every five minutes, the volumes of the permeate and retentate were measured. Eqn (2) and (3) were used to determine the flow and rejection values. Before measuring the permeate concentration (Cp), the complexing agent 1,5-diphenylcarbazide, was added to the filtrate to give color (readable by UV-Vis spectrophotometer).32,33 UV-Vis spectrophotometer measurement was carried out at a wavelength of 540 nm. The absorbance obtained was then entered into the linear equation of the chromium calibration curve. The results of the permeate concentration were used in calculating the percent rejection using eqn (3).
 | (2) |
 | (3) |
The physical characteristics of the filtrate from the Brantas River's water filtering process in Surabaya were examined to see whether it qualified as potable water after treatment. The physical parameters include turbidity, pH, temperature, color, odor, TDS, and TSS. Physical parameters are the initial basis to determine whether water is suitable for further use.35 The resulting filtrate was compared with the minimum standard value of suitable water. Water turbidity before and after filtration was measured using a turbidimeter. The pH value and temperature were measured using a pH meter and thermometer. TDS and TSS values were determined using the gravimetric method.36
Results and discussion
The PET-BW membrane before and after being modified was distinguished by the extent of its porosity and thickness (Table 2). The M1 membrane had a porosity and thickness of 74.81% and 0.098 m, respectively. The addition of additives (PEG and LiCl) and filler (zeolite-NaY) could increase the porosity of the membrane by 3–4% (for PEG), 6–7% (for LiCl), and 5% (for zeolite). Adding hydrophilic additives and fillers accelerates the exchange rate between phenol (solvent) and water–ethanol (non-solvent).18,22,37,38 As a result, the process of pore formation becomes faster, and the porosity of the membrane increases. In addition, the thickness of the membrane also increases after the addition of additives and fillers. Here, the increase in thickness was 0.03–0.04 μm (for PEG), 0.04–0.09 μm (for LiCl), and 0.03–0.06 μm (for zeolites). The addition of additives and fillers to the dope solution causes an increase in the viscosity of the solution. The increased viscosity of the solution inhibits the membrane's compaction, producing a thicker membrane than the M1 membrane. The order of porosity and membrane thickness values from the largest to the smallest for the modified M1 membrane was LiCl > zeolite > PEG.| Membranes | Characteristics | |
|---|---|---|
| Porosity (%) | Thickness (μm) | |
| M1 | 74.81 | 0.098 |
| M2 | 77.36 | 0.11 |
| M3 | 77.49 | 0.12 |
| M4 | 78.36 | 0.13 |
| M5 | 80.04 | 0.13 |
| M6 | 80.89 | 0.14 |
| M7 | 81.36 | 0.18 |
| M8 | 79.23 | 0.11 |
| M9 | 79.73 | 0.13 |
| M10 | 79.83 | 0.15 |
Membrane hydrophilicity
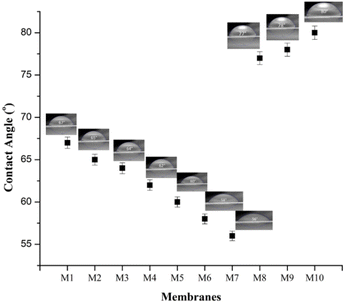
The hydrophilicity of the membrane is determined based on the contact angle value obtained. Contact angle values below 90° are classified as hydrophilic membranes, while those above 90° are classified as hydrophobic membranes.39 The M1 membrane before and after modification was classified as a hydrophilic membrane because it had a contact angle of 67° (Fig. 2). The addition of PEG and LiCl can increase the hydrophilicity of a membrane, as evidenced by a decrease in the value of the contact angle by 2–5° (for PEG) and 7–11° (for LiCl). The structure of PEG, which has OH functional groups, and LiCl, which has Li+ and Cl− ions, enhances the ability to interact with water. This interaction has a relatively small contact angle (<90°). The interaction between LiCl and water (ionic bond) is stronger than between PEG and water (hydrogen bond). The contact angle value obtained by the membrane added with LiCl was lower than that of PEG. The addition of zeolite-NaY to the dope solution resulted in a membrane with hydrophilicity lower than that of M1. However, it was still classified as a hydrophilic membrane because the contact angle value was below 90°. The decrease in the value of hydrophilicity or the increase in the value of the contact angle is due to the nature of the zeolite, which is classified as hydrophobic because of the Si![[thin space (1/6-em)]](https://www.rsc.org/images/entities/char_2009.gif) :
:![[thin space (1/6-em)]](https://www.rsc.org/images/entities/char_2009.gif) Al ratio in the zeolite structure.40 Zeolite can fill the membrane's pores as a filler in the membrane. Therefore, it interacts directly with water and forms a relatively larger angle than the M1 membrane. The order of membranes with high to lowest hydrophilicity was modified LiCl > PEG > zeolite.
Al ratio in the zeolite structure.40 Zeolite can fill the membrane's pores as a filler in the membrane. Therefore, it interacts directly with water and forms a relatively larger angle than the M1 membrane. The order of membranes with high to lowest hydrophilicity was modified LiCl > PEG > zeolite.
Functional group and structural analysis
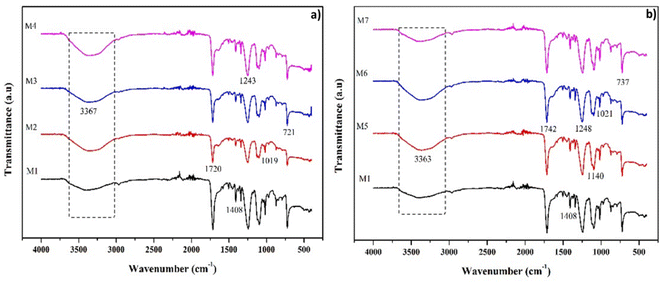
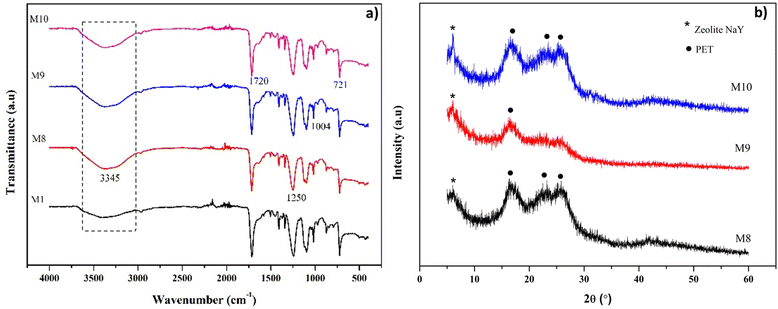
Analysis of functional groups on the membrane was used to determine the functional groups that play a role in the separation process. Fig. 3 compares the FTIR spectra of the membrane before and after modification. The FTIR spectra of the M1 membrane showed similar characteristics to the spectra of PET polymers reported by other researchers.41 The absorption peaks at 3367, 3363, and 3365 cm−1 indicate the presence of OH or hydroxyl groups. Peak widening occurs due to hydrogen bond interactions in the PET structure. The peaks at 1720 and 1742 cm−1 were associated with a carboxylic acid group (C![[double bond, length as m-dash]](https://www.rsc.org/images/entities/char_e001.gif) O stretching), while 1408 cm−1 indicated the presence of a C–O stretching bond. The terephthalate group (OOCC6H4–COO) was observed in the 1243, 1248, 1140, and 1250 cm−1 regions, while the methylene group and vibrations of the C–O bond ester were observed in 1019, 1021, and 1004 cm−1 regions. The absorption peaks at 721 and 737 cm−1 indicate the interaction of polar ester groups and benzene rings. The addition of PEG and LiCl caused an increase in the absorption intensity of the OH functional group (Fig. 3a and b). The sharper absorption peaks indicated increased intensity in the 3367 and 3363 cm−1 regions. PEG structure with the OH functional group and LiCl, both of which interact well with water (non-solvent), can increase the intensity of OH absorption in PET. The addition of zeolite-NaY as a filler caused an increase in the absorption intensity of the OH functional group in the 3345 cm−1 area. The characteristics of the zeolite absorption band were observed in the area of 973.17 cm−1 (Si–O–Al), making it different from M1.42 A silanol group (Si–OH) in the zeolite causes a shift in the FTIR spectra of the M1 membrane toward a higher wave number (Fig. 4a). The change in the FTIR spectra towards higher wave numbers indicates the presence of hydrogen bonds between PET and the additives or fillers.43
O stretching), while 1408 cm−1 indicated the presence of a C–O stretching bond. The terephthalate group (OOCC6H4–COO) was observed in the 1243, 1248, 1140, and 1250 cm−1 regions, while the methylene group and vibrations of the C–O bond ester were observed in 1019, 1021, and 1004 cm−1 regions. The absorption peaks at 721 and 737 cm−1 indicate the interaction of polar ester groups and benzene rings. The addition of PEG and LiCl caused an increase in the absorption intensity of the OH functional group (Fig. 3a and b). The sharper absorption peaks indicated increased intensity in the 3367 and 3363 cm−1 regions. PEG structure with the OH functional group and LiCl, both of which interact well with water (non-solvent), can increase the intensity of OH absorption in PET. The addition of zeolite-NaY as a filler caused an increase in the absorption intensity of the OH functional group in the 3345 cm−1 area. The characteristics of the zeolite absorption band were observed in the area of 973.17 cm−1 (Si–O–Al), making it different from M1.42 A silanol group (Si–OH) in the zeolite causes a shift in the FTIR spectra of the M1 membrane toward a higher wave number (Fig. 4a). The change in the FTIR spectra towards higher wave numbers indicates the presence of hydrogen bonds between PET and the additives or fillers.43
Zeolite-modified M1 membranes were also characterized by XRD, which aims to determine changes in the membrane structure. Zeolite-NaY has a characteristic XRD diffractogram at 6° [111]; 10° [220]; 11.8° [311]; 20.2° [440]; 23.5° [533]; and 26.9° [642], as shown in Fig. S1† and the characteristics of the d-spacing values. Meanwhile, the characteristic XRD diffractogram of the PET membrane lies at 16.4°, 22.9°, and 25.6°.44 On the M8, M9, and M10 membranes (Fig. 4b), the zeolite characteristic peak only appears in the 6° region. The characteristic intensity of the zeolite-NaY was observed to be higher with an increase in the amount of filler in the membrane. Another characteristic peak of the unobserved zeolite-NaY is caused by the addition of too little filler to the PET membrane matrix, which dominates the amorphous phase of the broad peaks at 2θ = 16° and 26°. The amorphous peaks in the M1 membrane slightly shifted towards the larger angle, indicating a decrease in interplanar spacing due to the interaction between PET and filler.45
Membrane morphology analysis
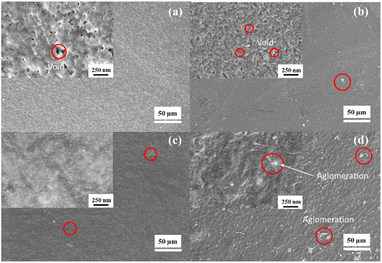
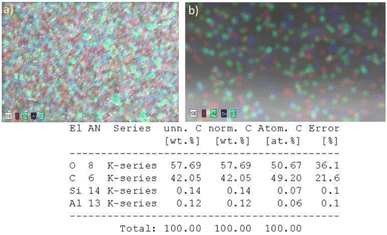
The membrane morphology analysis includes the surface and cross-section of the membrane. The morphology of the membrane surface before and after modification is shown in Fig. 5. M1 membrane has a rougher surface than the modified LiCl, PEG, and zeolite-NaY surfaces. Adding additives (LiCl and PEG) and filler (zeolite-NaY) reduced the voids formed on the M1 membrane. The smaller void size after adding additives and fillers was due to the increase in the viscosity of the dope solution. Dope solutions with relatively higher viscosity produce smaller pore and void sizes.46 The surface of the LiCl-modified membrane had a more uniform and relatively small pore size compared to PEG and zeolite-NaY. Being an inorganic salt additive, LiCl can accelerate the phase inversion process, as it can bind water (non-solvent). Thus, the exchange rate between solvent and non-solvent becomes faster, resulting in quicker membrane compaction. As a result, surface pores are uniform and relatively small (tighter). PEG, a polymer-type additive with a rather considerable molecular weight than LiCl, causes larger voids or pores.Meanwhile, the addition of zeolite-NaY resulted in a membrane with a slightly agglomerated surface. Agglomeration occurs because the zeolite-NaY filler is not entirely dispersed but occurs only in some parts of the membrane surface.47 The presence of zeolite on the membrane surface was analyzed using SEM-EDX. Fig. 6a is the result of SEM-EDX for the zeolite-modified PET-BW membrane surface. The presence of zeolite on the membrane surface is indicated by the presence of Si–O–Al elements, characteristic of the zeolite structure. The distribution of zeolite on the surface of the membrane looks uniform which is indicated by the dominant color of the Si–O–Al atoms (Fig. 6a).
Fig. 7 shows the cross-section of the membrane before and after modification. The PET-BW membrane has a sponge-like pore structure in the top layer of the membrane. The LiCl-modified PET-BW membrane also demonstrated the same cross-sectional characteristics. Overall, the PET-BW membrane had sponge-like pores before and after modification with the additive or filler. The average sponge-like pore size on PET-BW membranes before and after modification was calculated using the Guerout–Elford–Ferry equation.48 The PET-BW membrane pore size was more significant (0.085 μm) than the other membranes because it had a relatively higher porosity. The addition of LiCl, PEG, and zeolite-NaY was able to reduce the average pore size of the PET-BW membrane up to 0.081 (for LiCl), 0.083 (for PEG), and 0.082 μm (for zeolite).
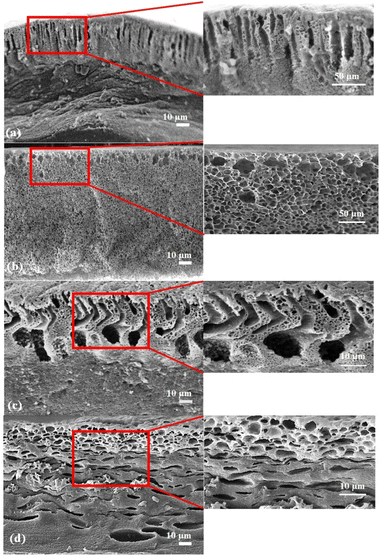 | ||
| Fig. 7 SEM cross-section of membranes: (a) PET-BW, (b) PET-BW/PEG, (c) PET-BW/LiCl, (d) PET-BW/zeolite. | ||
The decrease in the average pore size of the PET-BW membrane was caused by an increase in the dope solution's viscosity after adding additives and fillers. The increased viscosity causes the exchange rate of solvent and non-solvent to become slower, and the pore size formed is relatively small. Changes in the average pore size are insignificant because the percentage of additives and fillers added to the dope solution is relatively small. An increase in the viscosity of the dope solution is caused by the sponge-like pores after adding PEG, LiCl, and zeolite-NaY. The relatively high viscosity slows down the rate of exchange between solvent and non-solvent. This slow process delays demixing and produces sponge-like pores.49 The number of sponge-like pores in PEG-modified membranes is relatively more than the others because PEG is a polymer-type additive with a rather sizeable molecular weight.22 The nature of PEG causes its viscosity to be somewhat higher than the others.
Moreover, adding PEG and LiCl also resulted in a membrane pore structure with voids. The voids formed are due to the nature of the two, which are hydrophilic additives.21,22 Adding PEG and LiCl to the dope solution accelerates the exchange rate of solvent and non-solvent. The fast exchange rate causes instant demixing and produces voids in the membrane.50 However, the voids in the PEG-modified membrane were smaller than the LiCl-modified membrane due to the higher molecular weight of PEG than LiCl, which inhibited void formation.22
Furthermore, adding zeolite-NaY as a filler to the PET-BW membrane resulted in a different pore structure. There was accumulation caused by the distribution of filler in the dope solution. Thus it interacts with the membrane pores. The distribution of zeolite-NaY on the membrane cross-section is shown in Fig. 6b.
Membrane performance test
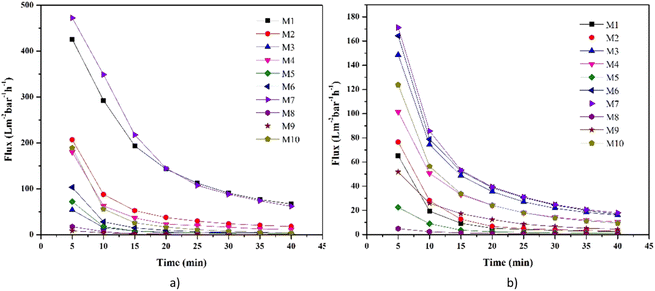
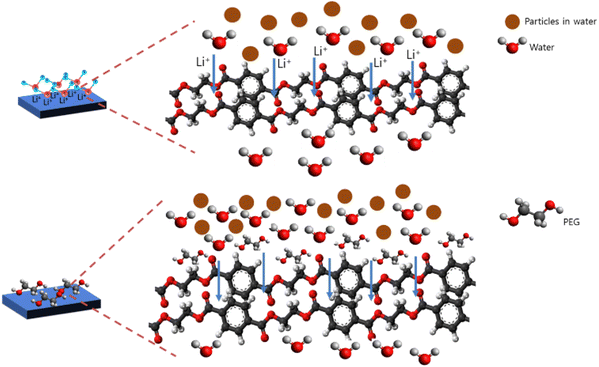
The performance of the membrane was first tested against control water and water from the Surabaya Brantas River. Fig. 8 shows the value of water flux and river water flux. Water flux decreased during the filtration process due to fouling. The highest water flux in the first 5 minutes was presented by the M7 membrane, while the lowest was presented by the M8 and M9 membranes. The high water flux in the M7 membrane was caused by the addition of LiCl additive in the dope solution. The nature of LiCl, which has good interaction with water, can increase the value of water flux (Fig. 9).21 In addition, the high porosity of the M7 membrane causes water to easily pass through the membrane, resulting in a higher flux than the other membranes. The M1 membrane features the second-highest water flux value. This high water flux is caused by the voids in the M1 membrane, which allow water to quickly pass through the membrane with low selectivity. The M2 membrane also presents a relatively high water flux. M2 membrane, which has a relatively higher porosity and hydrophilicity than M1, causes water to pass through the membrane pores easily.The PEG structure, which has a polar (OH) group, also helps increase the water flux value (Fig. 9).18 The water transport mechanism shown in Fig. 9 is based on the HOMO–LUMO orbital approach of each molecular structure calculated by the density functional theory method and the B3LYP/def2-TZVP RIJCOSX basis set (Fig. S2†). The computational software used in this study to calculate the HOMO and LUMO orbitals is Orca,51 and to visualize the results of the calculations, Avogadro software52 is used. PET, LiCl, and PEG molecular structures were drawn using the Avogadro software. The structural optimization was performed with commands, including molecular orbital calculations using the DFT/B3LYP/def2-TZVP RIJCOSX method on Orca. The use of the DFT calculation method with functional hybrids B3LYP because it has better accuracy than the others.53–56 The HOMO–LUMO orbital is often used to show the interactions between molecules based on their electron density.57,58 In addition, the interaction is also supported by previously reported research.21,22 The low water flux in the M8 and M9 membranes was due to the closing of the pores by the zeolite, thus preventing water from entering through the membrane pores. Due to membrane fouling, the river water flux decreased during filtration. The fouling occurred due to dissolved particles, ions, and organic compounds in river water.59 Membranes with modified LiCl (M6 and M7) still performed better than other river water filtration membranes. These were followed by the PEG-modified membrane and then the zeolite-modified membrane.
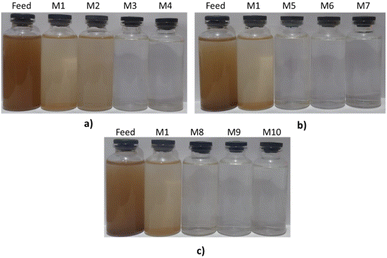
The filtrate produced from the filtration process was analyzed following the standard physical parameters of usable water set by the Government Regulation of the Republic of Indonesia.35 The physical parameters include turbidity, pH, temperature, TDS, and TSS. Physical parameters are the initial parameters to determine whether water is suitable for use. Fig. 10 shows the filtrates produced from the river water filtration process. Overall, before and after modification, the membranes reduced the turbidity, TDS, and TSS in river water (Table 3). The color of the river water, originally dark brown, became light brown and clear. The M1 membrane reduced river water's turbidity, TDS, and TSS up to two times. With the addition of PEG as an additive, the membrane could reduce turbidity to 2 NTU, 348 ppm of TDS, and 31.1 ppm of TSS. PEG-modified membranes' relatively high porosity and hydrophilicity resulted in excellent water filtration ability. However, with the addition of low PEG (M2), the color of the water still did not look clear.
| Membranes/solution | Filtrate characteristics | ||||
|---|---|---|---|---|---|
| Turbidity (NTU) | TDS (ppm) | TSS (ppm) | pH | T (°C) | |
| Threshold limit value | 5 | 1000 | 1000 | 6.5–8.5 | 31 ± 3 |
| Feed | 400 | 506 | 793 | 7.99 | 27.9 |
| M1 | 247 | 498 | 294 | 7.88 | 28.1 |
| M2 | 120 | 462 | 111 | 7.95 | 28.1 |
| M3 | 6.23 | 348 | 109 | 7.95 | 28.1 |
| M4 | 2.44 | 362 | 31.1 | 8.22 | 28.0 |
| M5 | 1.42 | 374 | 37.0 | 8.08 | 28.1 |
| M6 | 4.64 | 404 | 16.0 | 8.08 | 28.1 |
| M7 | 3.82 | 380 | 6.00 | 8.20 | 28.1 |
| M8 | 11.2 | 350 | 150 | 8.42 | 28.0 |
| M9 | 2.67 | 402 | 58.2 | 8.47 | 28.0 |
| M10 | 1.91 | 252 | 18.0 | 8.20 | 28.1 |
On the other hand, LiCl and zeolite-NaY-modified membranes produced a relatively clear filtrate compared to PEG-modified membranes at relatively low concentrations (Fig. 8b and c). LiCl reduced turbidity to 1.42 NTU, 374 ppm of TDS, and 37 ppm of TSS in river water. Meanwhile, zeolite-NaY produced filtrate with a turbidity of 1.91 NTU, 252 ppm of TDS, and 18 ppm of TSS. The excellent performance of the two, which can prevent dissolved particles from passing through the membrane, is due to their porosity and hydrophilicity. The turbidity, TDS, and TSS values in the filtrate obtained with membranes modified by additives and fillers were below the maximum limits for suitable water. In addition, the pH and temperature values of the filtrate were also below the allowable threshold.
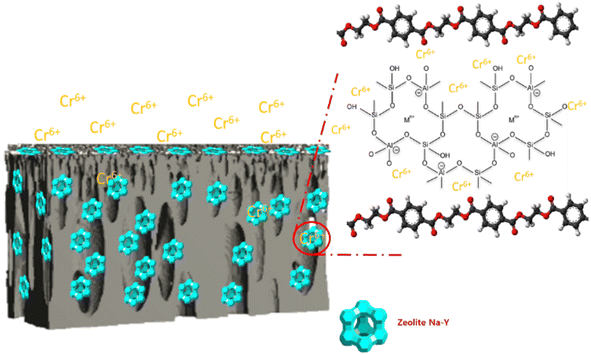
Fig. 11a displays the values of the membrane's chromium ion flux. The reduction in chromium ion flux values was caused by fouling during filtration. Due to the lower ion particle size (2.5 μm) than the water particle size, the chromium ion flux had a better value than the water ion flux (4.9 μm). It was observed that the M1 membrane (PET-BW) had the highest chromium flux compared to other membranes. However, it had a meager rejection value for chromium ions (4.07%) (Fig. 11b). The high flux and low rejection value were caused by the PET-BW membrane's voids so that it could not hold more than 4.07% chromium ions that passed through the membrane. A total of 4.07% may be trapped in the membrane pores or obstructed by blockages in the membrane. The highest rejection value was presented by PET-BW membrane with modified LiCl, which was 54.75%. The addition of LiCl has been reported to increase the porosity of the membrane and the hydrophilicity of the membrane.21 The high porosity and hydrophilicity allow many chromium ions to be trapped in the membrane. The zeolite-NaY-modified PET-BW membrane experienced rejection, which continued to increase with the amount of filler added. The presence of zeolite in the M1 membrane structure supports the filtration process through the adsorption method. As illustrated in Fig. 12, the interaction between chromium ions and the zeolite's active site causes the binding of chromium ions, which can inhibit the filtration rate.60 Zeolite's ability as a porous material can adsorb chromium ions, which are then retained on the membrane, causing an increase in the rejection value.
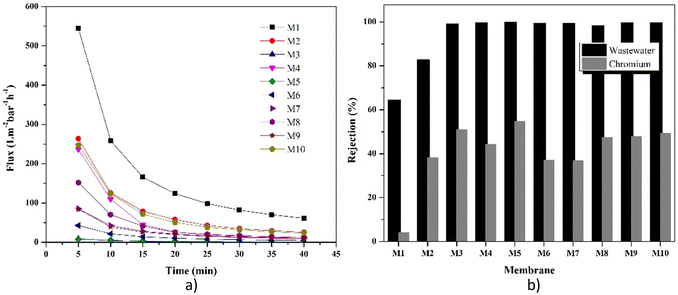 | ||
| Fig. 11 Comparison of the performance of each membrane in chromium ion removal: (a) flux and (b) rejection value. | ||
Conclusions
Waste plastic bottles made from polyethylene terephthalate have been successfully utilized as low-cost membranes for water purification and chromium ion removal. Modifications with PEG-400, LiCl, and zeolite-NaY improved the PET-BW membrane's performance. LiCl-modified PET-BW membrane produced the best performance as compared to the other membranes with a decrease in turbidity to 1.42 NTU (from 400 NTU) and a 54.75% rejection of chromium ions. The PEG-modified PET-BW membrane reduced turbidity to 2 NTU (from 400 NTU) and a 50.9% rejection of chromium ions. Meanwhile, the zeolite-modified PET-BW membrane produced a filtrate with a turbidity of 1.91 NTU (reduced from 400 NTU) and featured a 49.2% rejection of chromium ions.Author contributions
Badrut Tamam Ibnu Ali: conceptualization, investigation, resources, methodology, and writing-original draft. Yuly Kusumawati: co-supervision, methodology. Nurul Widiastuti: supervision, conceptualization, review & editing. Juhana Jaafar: review, resources, formal analysis. Dety Oktavia Sulistiono: review & editing.Conflicts of interest
There are no conflicts to declare.Acknowledgements
The authors would like to thank Kementerian Pendidikan Kebudayaan Riset dan Teknologi, Indonesia, for the financial support through the Doctoral Research Grant (PDD) No. 1560/PKS/ITS/2022 and Kurita Water and Environment Foundation (KWEF) Grant No. 21Pid071-15R.References
- N. H. Omer, in Science, Assessments and Policy, ed. K. Summers, IntechOpen, Rijeka, 2019, pp. 1–18 Search PubMed.
- W. H. Organization, Chromium in drinking-water: A background document for development of World Health Organisation guidelines for drinking water, 2020 Search PubMed.
- A. Kumar, H. Song, S. Mishra, W. Zhang and Y. Zhang, Chemosphere, 2023, 318, 137894 CrossRef CAS PubMed.
- C. U. Montaño-Medina, L. M. Lopéz-Martínez, A. Ochoa-Terán, E. A. López-Maldonado, M. I. Salazar-Gastelum, B. Trujillo-Navarrete, S. Pérez-Sicairos and J. M. Cornejo-Bravo, Chem. Eng. J., 2022, 451, 138396 CrossRef.
- M. A. Irshad, R. Nawaz, E. Wojciechowska, M. Mohsin, N. Nawrot, I. Nasim and F. Hussain, Water, Air, Soil Pollut., 2023, 234, 54 CrossRef CAS.
- S. Zhou, W. Li, W. Liu and J. Zhai, Hydrometallurgy, 2023, 215, 105992 CrossRef CAS.
- S. Hube, F. Hauser, M. Burkhardt, S. Brynjólfsson and B. Wu, Sep. Purif. Technol., 2023, 310, 123083 CrossRef CAS.
- N. Abdullah, N. Yusof, W. J. Lau, J. Jaafar and A. F. Ismail, J. Ind. Eng. Chem., 2019, 76, 17–38 CrossRef CAS.
- A. Asad, D. Sameoto and M. Sadrzadeh, in Nanocomposite Membranes for Water and Gas Separation, Elsevier, 2020, pp. 1–28 Search PubMed.
- V. Stock, C. Laurisch, J. Franke, M. H. Dönmez, L. Voss, L. Böhmert, A. Braeuning and H. Sieg, Toxicol. In Vitro, 2021, 70, 105021 CrossRef CAS PubMed.
- I. V Korolkov, A. B. Yeszhanov, M. V Zdorovets, Y. G. Gorin, O. Güven, S. S. Dosmagambetova, N. A. Khlebnikov, K. V Serkov, M. V Krasnopyorova, O. S. Milts and D. A. Zheltov, Sep. Purif. Technol., 2019, 227, 115694 CrossRef.
- B. T. I. Ali, N. Widiastuti, Y. Kusumawati and J. Jaafar, Mater. Today: Proc., 2022, 65, 3030–3036 CAS.
- P. Benyathiar, P. Kumar, G. Carpenter, J. Brace and D. K. Mishra, Polymers, 2022, 14, 2366 CrossRef CAS PubMed.
- M. A. El-Khateeb, M. A. Saad, H. I. Abdel-Shafy, F. A. Samhan and M. F. Shaaban, Desalin. Water Treat., 2018, 111, 94–100 CrossRef CAS.
- M. A. El-Khateeb, Clean: Soil, Air, Water, 2021, 49, 2100147 CAS.
- M. A. El-Khateeb, W. M. Emam, W. A. Darweesh and E. S. Abd El-Sayed, Desalin. Water Treat., 2019, 164, 48–55 CrossRef CAS.
- M. A. El-Khateeb, S. H. Kenawy, A. M. Khalil and F. A. Samhan, Desalin. Water Treat., 2021, 217, 214–220 CrossRef CAS.
- H. Bin Li, W. Y. Shi, Y. F. Zhang, D. Q. Liu and X. F. Liu, Polymers, 2014, 6, 1846–1861 CrossRef.
- A. Mansourizadeh and A. F. Ismail, Chem. Eng. J., 2010, 165, 980–988 CrossRef CAS.
- L. Zheng, Z. Wu, Y. Zhang, Y. Wei and J. Wang, J. Environ. Sci., 2015, 45, 28–39 CrossRef PubMed.
- N. Bin Darwish, A. Alkhudhiri, H. AlRomaih, A. Alalawi, M. C. Leaper and N. Hilal, J. Water Process Eng., 2020, 33, 101049 CrossRef.
- E. Saljoughi, M. Amirilargani and T. Mohammadi, Desalination, 2010, 262, 72–78 CrossRef CAS.
- S. P. Kusumocahyo, S. K. Ambani, S. Kusumadewi, H. Sutanto, D. I. Widiputri and I. S. Kartawiria, J. Environ. Chem. Eng., 2020, 8, 104381 CrossRef CAS.
- Y. Ma, F. Shi, J. Ma, M. Wu, J. Zhang and C. Gao, Desalination, 2011, 272, 51–58 CrossRef CAS.
- M. Vinoba, M. Bhagiyalakshmi, Y. Alqaheem, A. A. Alomair, A. Pérez and M. S. Rana, Sep. Purif. Technol., 2017, 188, 431–450 CrossRef CAS.
- K. K. Jena, K. Suresh Kumar Reddy, G. N. Karanikolos and D. S. Choi, Appl. Surf. Sci., 2023, 611, 155777 CrossRef CAS.
- A. A. Melaibari, A. S. Elamoudi, M. E. Mostafa and N. H. Abu-Hamdeh, Eng. Anal. Bound. Elem., 2023, 148, 317–323 CrossRef.
- R. A. Rachman, U. T. I. Martia, W. Aulia, R. M. Iqbal, N. Widiastuti and F. Kurniawan, AIP Conf. Proc., 2018, 2049, 020073 CrossRef.
- M. R. A. Hamid and H. K. Jeong, Korean J. Chem. Eng., 2018, 35, 1577–1600 CrossRef CAS.
- P. S. Goh, A. F. Ismail, S. M. Sanip, B. C. Ng and M. Aziz, Sep. Purif. Technol., 2011, 81, 243–264 CrossRef CAS.
- N. A. A. Hamid, A. F. Ismail, T. Matsuura, A. W. Zularisam, W. J. Lau, E. Yuliwati and M. S. Abdullah, Desalination, 2011, 273, 85–92 CrossRef CAS.
- M. Khorram, A. Mousavi and N. Mehranbod, J. Environ. Chem. Eng., 2017, 5, 2366–2377 CrossRef CAS.
- M. Bhattacharya, S. K. Dutta, J. Sikder and M. K. Mandal, J. Membr. Sci., 2014, 450, 447–456 CrossRef CAS.
- M. Mulder, Basic Principles of Membrane Technology, Kluwer Academic Publishers, London, 2nd edn, 1996 Search PubMed.
- Menteri Kesehatan Republik Indonesia, Peraturan Menteri Kesehatan Republik Indonesia, 2017, pp. 1–20 Search PubMed.
- T. E. Aniyikaiye, T. Oluseyi, J. O. Odiyo and J. N. Edokpayi, Int. J. Environ. Res. Public Health, 2019, 16, 1235 CrossRef CAS PubMed.
- A. K. Fard, G. McKay, A. Buekenhoudt, H. Al Sulaiti, F. Motmans, M. Khraisheh and M. Atieh, Materials, 2018, 11, 74 CrossRef PubMed.
- E. Yuliwati and A. F. Ismail, Desalination, 2011, 273, 226–234 CrossRef CAS.
- R. S. Hebbar, A. M. Isloor and A. F. Ismail, Contact Angle Measurements, Elsevier B.V., 2017 Search PubMed.
- W. Lutz, Adv. Mater. Sci. Eng., 2014, 13, 20 Search PubMed.
- A. P. Dos Santos Pereira, M. H. P. Da Silva, É. P. Lima, A. Dos Santos Paula and F. J. Tommasini, Mater. Res., 2017, 20, 411–420 CrossRef.
- A. Mekki, A. Benmaati, A. Mokhtar, M. Hachemaoui, F. Zaoui, H. Habib Zahmani, M. Sassi, S. Hacini and B. Boukoussa, J. Inorg. Organomet. Polym. Mater., 2020, 30, 2323–2334 CrossRef CAS.
- X. Lv, X. Li, L. Huang, S. Ding, Y. Lv and J. Zhang, Korean J. Chem. Eng., 2022, 39, 475–483 CrossRef CAS.
- S. Agrawal, N. Ingle, U. Maity, R. V. Jasra and P. Munshi, ACS Omega, 2018, 3, 6692–6702 CrossRef CAS PubMed.
- B. Zhang, C. Yang, Y. Zheng, Y. Wu, C. Song, Q. Liu and Z. Wang, J. Membr. Sci., 2021, 627, 119239 CrossRef CAS.
- E. Yuliwati and A. F. Ismail, Desalination, 2011, 273, 226–234 CrossRef CAS.
- D. Bastani, N. Esmaeili and M. Asadollahi, J. Ind. Eng. Chem., 2013, 19, 375–393 CrossRef CAS.
- M. Yong, Y. Zhang, S. Sun and W. Liu, J. Membr. Sci., 2019, 575, 50–59 CrossRef CAS.
- L. Zheng, J. Wang, D. Yu, Y. Zhang and Y. Wei, J. Membr. Sci., 2018, 550, 480–491 CrossRef CAS.
- M. Farjami, V. Vatanpour and A. Moghadassi, Chem. Eng. Res. Des., 2020, 153, 8–20 CrossRef CAS.
- F. Neese, F. Wennmohs, U. Becker and C. Riplinger, J. Chem. Phys., 2020, 152, 224108 CrossRef CAS PubMed.
- M. D. Hanwell, D. E. Curtis, D. C. Lonie, T. Vandermeersch, E. Zurek and G. R. Hutchison, J. Cheminf., 2012, 4, 17 CAS.
- S. J. Basha, S. P. V. Chamundeeswari, S. Muthu and B. R. Raajaraman, J. Mol. Liq., 2019, 296, 111787 CrossRef CAS.
- M. Taghizadeh, A. Taghizadeh, V. Vatanpour, M. R. Ganjali and M. R. Saeb, Sep. Purif. Technol., 2021, 258, 118015 CrossRef CAS.
- T. M. McCormick, C. R. Bridges, E. I. Carrera, P. M. Dicarmine, G. L. Gibson, J. Hollinger, L. M. Kozycz and D. S. Seferos, Macromolecules, 2013, 46, 3879–3886 CrossRef CAS.
- Y. Li, L. Qing, H. Yu, Y. Peng, X. Xu, P. Li and S. Zhao, Chem. Eng. Sci., 2021, 246, 116978 CrossRef CAS.
- M. Aier, S. Baruah and A. Puzari, J. Indian Chem. Soc., 2022, 99, 100683 CrossRef CAS.
- B. T. I. Ali, N. Widiastuti, Y. Kusumawati, A. L. Ivansyah and J. Jaafar, Mater. Res. Express, 2022, 9, 125302 CrossRef.
- X. Shi, G. Tal, N. P. Hankins and V. Gitis, J. Water Process Eng., 2014, 1, 121–138 CrossRef.
- L. Sellaoui, E. P. Hessou, M. Badawi, M. S. Netto, G. L. Dotto, L. F. O. Silva, F. Tielens, J. Ifthikar, A. Bonilla-Petriciolet and Z. Chen, Chem. Eng. J., 2021, 420, 127712 CrossRef CAS.
Footnote |
| † Electronic supplementary information (ESI) available. See DOI: https://doi.org/10.1039/d3ra00827d |
| This journal is © The Royal Society of Chemistry 2023 |

