
 Open Access Article
 This Open Access Article is licensed under a Creative Commons Attribution-Non Commercial 3.0 Unported Licence
Controllable DNA nanodevices regulated by logic gates for multi-stimulus recognition†
Yingxin Hu *a,
Yufeng Jiab,
Yuefei Yanga and
Yanjun Liua
*a,
Yufeng Jiab,
Yuefei Yanga and
Yanjun Liua
aSchool of Information Science and Technology, Shijiazhuang Tiedao University, Shijiazhuang 050043, P. R. China. E-mail: huyingxin@stdu.edu.cn
bSchool of Management, Shijiazhuang Tiedao University, Shijiazhuang 050043, P. R. China
First published on 20th March 2023
Abstract
DNA biosensors have attracted considerable attention due to their great potential in environmental monitoring and medical diagnosis. Despite the great achievements, the single function and uncontrollability of the sensors restrict their further application. Therefore, it is necessary to construct controllable nanodevices with both sensing and responding capabilities to external stimuli. Herein, we develop a strategy to engineer structure-switching biosensors which can respond to external stimuli while preserving the sensing capability. The engineered nanodevice consists of an actuation module and a sensing module. Initially, the sensing module is disabled by a blocker strand which acts as an allosteric switch. Once the stimuli-responsive actuation module displaces the blocker DNA, the sensing module is activated. Based on the strategy, the engineered nanodevice could recognize both the target and external stimuli. As a demonstration of this strategy, a controllable Hg2+ sensor was designed, in which a ‘YES’, ‘AND’, and ‘OR’ logic gate is employed as the actuation module respectively to facilitate recognition of oligonucleotide inputs. The modular nature of the proposed strategy makes it easily generalizable to other structure-switching sensors. As a demonstration of this, we successfully apply it to the ATP sensor. The proposed strategy has potential in the fields of programmable biosensing, disease diagnosis, DNA computing, and intelligent nanodevices.
Introduction
Physiological processes and disease occurrence are closely related to signals such as chemical small molecules and epigenetic changes (microRNA or methylation).1 For instance, abnormal expression of microRNAs is closely correlated to a variety of serious diseases, and the concentration variation in metal ions or the presence of toxic metal ions are associated with various diseases.2,3 Therefore, developing sensors that detect pathogenesis-related genes or clinically relevant small molecules is important for medical diagnosis. Recently, great efforts have been devoted to establishing nanodevices for detecting disease-related nucleic acids, metal ions, or other small molecules.4–9 Among various nanodevices, DNA aptamer-based sensors have drawn extensive attention due to their high specificity and affinity.4,10 Despite these achievements, the single-function nature and uncontrollability of the sensors limit their further application. On one hand, the recognition of multiple analytes is very important for diagnosis and treatment because it is often not sufficient to make a diagnosis only by monitoring a single target under some condition.11 On the other hand, the sensors with controllable features allow their functioning in a certain time or at certain target sites. Therefore, it is essential to construct controllable sensors with both sensing and responding capabilities to external stimuli. The development of the stimulus-responsive nanodevices provides an opportunity for addressing the above issues.Over the past two decades, diverse stimulus-responsive nanodevices or strategies have been developed to achieve multiple sensing. For instance, electrochemical nanodevices or amplification methods such as enzyme/DNAzyme, HCR reaction, RCA reaction, and positional encoding/decoding are utilized to detect multiple nucleic acid molecules.2,6,12,13 Great efforts have also been made to sense multiple metal ions simultaneously.3,14,15 Moreover, some studies have proven multiplexed sensing of small molecules such as ATP and cocaine or thrombin.16–20 Detection of metal ions and ATP based on DNAzyme-induced intelligent mesoporous SiO2 nanoparticles was also reported.21 Besides metal ions, small molecules, and nucleic acid molecules, the nanodevices that could respond to pH, light or other stimuli were also constructed.22–26 In view of these respects, it is hopeful to develop a controllable nanodevice to recognize multiple stimuli by incorporating stimulus-responsive modules.
Herein, we develop a simple yet versatile strategy to construct a controllable nanodevice that can adjust its state according to external stimulus. Specifically, the nanodevice consists of a sensing module and an actuation module. The actuation module generates the key strand which could unlock the sensing module locked by blocker strand through strand displacement reaction. The function of the actuation module could be implemented by a simple DNA strand or complex logic gate. Based on this strategy, we successfully constructed a nanodevice that could recognize Hg2+ and multiple DNA stimuli.
The strategy was also applied to the ATP sensor. The experiments were verified by both fluorescence response and gel electrophoresis. The results indicated that the proposed strategy is particularly suitable to operate structure-switching sensors and could have broad applications in biosensing and smart nanodevice.
Results and discussion
The mechanism of external stimulus-controlled nanodevice for multiple recognition
In the design of typical structure-switching DNA sensors, the assembled DNA complex typically contains a partially exposed conserved domain. The interaction of the specific domain with the corresponding target analyte changes the conformation of the sensor and causes an observable signal. For example, the Hg2+ sensor is achieved by its specific interaction with the specific domain (thymine bases) which forms more thermal stable T–Hg2+–T mismatched base pairs than A–T base pairs in DNA duplexes.27 The ATP sensor is designed through its interaction with the corresponding aptamer domain.28 Beyond that, the Ag+ sensor, K+ sensor, Cocaine sensor, and so on were also reported.29,30 In these biosensors, the exposed conserved domain plays an important role to control the activity of the biosensors. We envision that the sensor could be inhibited or activated via a conformational change which could block or liberate the exposed conserved domain. In this way, an engineered nanodevice controlled by external stimulus could be established.As illustrated in Scheme 1, the nanodevice consists of an actuation module and a sensing module. The sensor complex in the sensing module is locked within a rigid, linear double helix structure due to the repressed accessibility to the target analyte (e.g., Hg2+, ATP). This is achieved by blocking the exposed specific sequence through hybridizing with a complementary DNA sequence (purple color or orange color). Here, the complementary DNA serves as a switch or lock. Further lengthening the lock DNA to introduce a toehold will expose a keyhole for the locked sensor. The actuation module could be stimulus-responsive elements such as YES, AND, and OR logic gate. Initially, the gate complex encapsulated the key strand through hybridization. Only when external stimuli such as specific nucleic acid molecules were present, could the key strand be released through strand displacement reaction. The hybridization of the released key strand with the switch strand alters the sensor from OFF-state to ON-state and facilitates the sensor to interact with the target analyte and then produce signals. Thus, only under the cooperative action of external stimuli and target analyte, the fluorescence signal changes.
 | ||
| Scheme 1 Illustration of the mechanism of external stimulus-controlled nanodevice for multiple recognition. | ||
Combining logic gates with DNA biosensors enables multiple detections and will help drive further advances in analytical chemistry and biosensing. Regulation of biosensor by logic gates will make the sensors have the capability of sensing not only the target analyte but also other external stimuli, which expands the functionality of the sensors.
A nanodevice recognizing Hg2+ and nucleic acids
To demonstrate the feasibility of the scheme, the Hg2+ sensor was engineered as a model firstly. As shown in Fig. 1a, the design of the Hg2+ sensor is based on the conformation change of DNA containing T–T mismatches triggered by mercury ions.27 The sensor consists of T-rich strand ‘A’ labelled by FAM at 5′ end and strand ‘B’ modified by BHQ at 3′ end. One part of the T-rich domain is exposed and exhibits a single-stranded state, and the other part is blocked by strand ‘B’. In the absence of Hg2+, the fluorophore and the quencher are in proximity due to the hybridization between strand ‘A’ and ‘B’, leading to low fluorescence due to fluorescence resonance energy transfer. However, in the presence of Hg2+, the exposed and the blocked T-rich sequence in strand ‘A’ will form T–Hg–T base pairs, leading to the folding of some segments of ‘A’ into a hairpin structure and strand ‘B’ is released from strand ‘A’, resulting in high signal due to separation of fluorophore and quencher. Based on the design of the sensor, an extra strand ‘L’ as a lock is introduced to partly hybridize with remaining segments of strand ‘A’, thus the T-rich segments of ‘A’ are occupied and the conformation will not change upon addition of Hg2+. Here, the sensor (A/B) is repressed by strand ‘L’ and in OFF-state if no key strand is added. Specifically, the strand ‘L’ contains a toehold as a keyhole for the subsequent reaction. | ||
| Fig. 1 (a) Schematic illustration of engineering the Hg2+ sensor for multi-stimulus recognition. (b) Fluorescence intensity analysis of the ON-state sensor (A/B) upon addition of different concentrations of Hg2+. [A/B] = 0.1 μM, [Hg2+] = 1 μM, 2 μM, 3 μM and 4 μM respectively. (c) Fluorescence intensity analysis of the ON-state sensor (A/B) and the OFF-state sensor (A/B/L) upon the addition of Hg2+. [A/B] = 0.1 μM, [A/B/L] = 0.1 μM, [Hg2+] = 4 μM. (d) (Left) the ‘YES’ logic gate and its corresponding truth table; (right) the fluorescence results of the experiment. [A/B/L] = 0.1 μM, [K] = 0.12 μM, [Hg2+] = 4 μM. ‘+’ denotes the addition of the component and ‘−’ denotes the absence of the component. | ||
The reaction of the sensor toward mercury ions and its repression was carried out at room temperature and was confirmed by fluorescence assay in Fig. 1b and c. Without the addition of mercury ions, the intensity of fluorescence almost remained unchanged. With the increase of the concentration of mercury ions, the intensity of fluorescence increased correspondingly, demonstrating that there were more T–Hg–T compound forming and more strand ‘B’ falling off from the (A/B) complex. However, the intensity of fluorescence was reduced by 5 times upon the addition of the mercury ions in the presence of strand ‘L’, i.e., the introduction of the lock strand caused the dramatic change in fluorescence (Fig. 1c). Therefore, the experimental results verified that the sensor was repressed by the lock strand.
Several factors for the experiment were optimized to achieve better performance. Firstly, excess strands ‘B’ was used to ensure low background signals in the absence of Hg2+, here 1![[thin space (1/6-em)]](https://www.rsc.org/images/entities/char_2009.gif) :4 was selected as the ratio of the concentration of strand ‘A’ and ‘B’. The control experiments of PAGE analysis were implemented to choose the appropriate length and concentration of lock strand ‘L’ (Fig. S1†). A series of different lengths (29–32 nt) of strands ‘L’ and different concentrations of each length were introduced to inhibit the sensor. According to PAGE gel results, 31 nt strand ‘L8’ was chosen as the final lock strand and its final concentration was 4 times higher than that of the complex (A/B) to avoid unexpected background signals.
:4 was selected as the ratio of the concentration of strand ‘A’ and ‘B’. The control experiments of PAGE analysis were implemented to choose the appropriate length and concentration of lock strand ‘L’ (Fig. S1†). A series of different lengths (29–32 nt) of strands ‘L’ and different concentrations of each length were introduced to inhibit the sensor. According to PAGE gel results, 31 nt strand ‘L8’ was chosen as the final lock strand and its final concentration was 4 times higher than that of the complex (A/B) to avoid unexpected background signals.
As shown in Fig. 1a, to achieve multi-stimulus responsiveness, strand ‘K’ was introduced to activate the sensor. The sensor would change to ON-state upon the addition of strand ‘K’ due to its hybridization with strand ‘L’ through 8 nt toehold. Therefore, the complex (A/B) underwent conformation change upon the addition of Hg2+. Thus, the sensor was turned on by strand ‘K’. The activating reaction was confirmed by the fluorescence assay in Fig. 1d, the fluorescence intensity in the presence of key strand ‘K’ was around 4 times higher than that of in the absence of ‘K’. The results indicated that the strand ‘K’ had opened the lock and activated the sensor, thus the fluorescence signal increased after the addition of the mercury ions. The simulation results (Fig. S4–S6†) also verified the ON–OFF switch in the nanodevices. Here, we defined the fluorescent intensity above the threshold of 0.7 as ‘1’ in the logic gate, the above reaction corresponded to a ‘YES’ logic gate using ‘K’ as input and high fluorescence as output, based on this logic gate, mercury ions and nucleic acids could be identified.
The state change of the sensor could be transformed by not only the direct key DNA strand but also by other modules such as logic gates. Here, a stimulus-responsive module was designed which sequestered the key strand initially and would release it after stimulation by inputs. As a model implementation of the above strategy, a ‘YES’ logic gate was first established which accepted ‘I1’ as input and output ‘K’ (Fig. 2a). The gate contained two strands, one was ‘G1’ and the other was ‘K’ and they hybridized with each other. Initially, strand ‘K’ was insulated in the gate, only when the input strand ‘I1’ was added, it could be released and activated the sensor.
 | ||
| Fig. 2 (a) Schematic illustration of the upstream ‘YES’ logic gate that output the key strand ‘K’. (b) The cascading ‘YES–YES’ logic gate and native PAGE analysis of the locked sensor (A/B/L) upon the addition of upstream ‘YES’ logic gate. (c) (Top) The truth table of the circuit; (bottom) the fluorescence analysis of the mixture of the complex (A/B/L) and (G1/K) upon addition of Hg2+ in the presence and absence of upstream input ‘I1’. ‘+’ denotes the addition of the components and ‘−’ denotes the absence of the components. [A/B/L] = 0.1 μM, [G1/K] = 0.4 μM, [I1] = 0.48 μM and [Hg2+] = 4 μM. | ||
The reaction of the upstream logic gate and the operation of activating the sensor was confirmed by native PAGE analysis. As shown in Fig. 2b, the mixture of gate complex (G1/K) and (A/B/L) appeared two distinct bands (Lane 3), indicating there was no leakage in the cascading reaction. However, upon the addition of strand ‘I1’ (Lane 4), the band corresponding to the (A/B/L) disappeared and yielded the waste (G1/I1) and (K/L), indicating that the upstream input ‘I1’ activated the sensor. Further, the reaction was confirmed by fluorescence experiments. As shown in Fig. 2c, upon the addition of Hg2+, the intensity of fluorescence in the presence of ‘I1’ was almost 6 times higher than that without ‘I1’. The results demonstrated that the upstream ‘YES’ logic gate had opened the lock and then activated the sensor, thus the fluorescence signal increased. Here, we defined the fluorescent intensity above the threshold of 0.5 as ‘1’ in the logic gate, the above reaction corresponded to a ‘YES–YES’ logic circuit using ‘I1’ as input and high fluorescence as output, based on this logic circuit, mercury ions and nucleic acids could be identified.
In the above activating operation, a single input was used to displace the key strand from one end of the gate complex. In order to achieve multiple stimuli-responsiveness, an ‘OR’ logic gate which could release the key strand from different ends was established. As shown in Fig. 3a, strands ‘I2’ and ‘I3’ displaced ‘K’ at 5′ end or 3′ end of strand ‘G2’ respectively. Subsequently, the released ‘K’ functioned as an input of the ‘YES’ gate to actuate the sensor (Fig. 3b). Thus, a cascading ‘OR–YES’ gate was constructed. It is worth noting that the middle segment of strand ‘K’ was in a loop form to decrease the repeat sequence between ‘K’ and ‘I2’ or ‘I3’. Therefore, the sensor could be activated by inputs that had few correlations with the sensor.
 | ||
| Fig. 3 (a) Schematic illustration of the upstream ‘OR’ logic gate that output the key strand ‘K’. (b) Two-level cascading circuits ‘OR–YES’. (c) Native PAGE analysis of the components of ‘OR’ logic gate and the operation upon addition of inputs. Lane 1: strand ‘G2’, Lane 2: strand ‘K’, Lane 3: strand ‘I2’, Lane 4: strand ‘I3’, Lane 5: complex (G2/I2), Lane 6: complex (G2/I3), Lane 7: gate complex (G2/K), Lane 8: gate complex (G2/K) + I2, Lane 9: gate complex (G2/K) + I3, Lane 10: gate complex (G2/K) + I2 + I3. (d) Native PAGE analysis of the mixture of the complex (A/B/L) and (G2/K) upon addition of upstream input ‘I2’ and ‘I3’. Lane 1: gate complex (G2/K), Lane 2: (A/B/L), Lane 3: (A/B/L) + (G2/K), Lane 4: (A/B/L) + (G2/K) + I2, Lane 5: (A/B/L) + (G2/K) + I3, Lane 6: (A/B/L) + (G2/K) + I2 + I3. (e) (Top) the truth table of the cascading circuit; (bottom) the fluorescence analysis of the mixture of the complex (A/B/L) and (G2/K) upon addition of Hg2+ in the presence or absence of upstream inputs. ‘+’ denotes the addition of the components and ‘−’ denotes the absence of the components. [A/B/L] = 0.1 μM, [G2/K] = 0.4 μM, [I2] = 0.48 μM, [I3] = 0.48 μM, [Hg2+] = 4 μM. | ||
Gel results shown in Fig. 3c confirmed that any one of ‘I2’ and ‘I3’ was able to release ‘K’. Specifically, in lane 8, lane 9, and lane 10, the band of gate complex (G2/K) disappeared and yielded the waste (G2/I2) and (G2/I3) upon addition of inputs. Further gel analysis shown in Fig. 3d verified that either of the inputs ‘I2’ and ‘I3’ could turn on the sensor. In lane 4, lane 5, and lane 6, the band of the complex (A/B/L) disappeared upon the addition of a single input or both inputs. The fluorescence experiments were carried out to further validate the cascading ‘OR–YES’ operation for activation of the sensor. As shown in Fig. 3e, upon the addition of Hg2+, the intensity of fluorescence in the presence of ‘I2’ or ‘I3’ was significantly higher than that without inputs. Specifically, the fluorescence intensity of the samples with input was at least 5 times higher than that without inputs. The results indicated that the upstream ‘OR’ logic gate had opened the lock and then activated the sensor, thus the fluorescence signal increased. Here, we defined the fluorescent intensity above the threshold of 0.5 as ‘1’ in the logic circuit, the above reaction corresponded to an ‘OR–YES’ logic circuit using ‘I2’ or ‘I3’ as input and high fluorescence as output, based on this logic gate, mercury ions and nucleic acids could be identified.
In the above cascading ‘OR–YES’ gate, either of the inputs could turn on the sensor. However, under some conditions, an event would be triggered only in the case that multiple factors were present at the same time. Thus, an ‘AND’ logic gate was constructed and wired with the ‘YES’ gate. As shown in Fig. 4a, only strands ‘I4’ and ‘I5’ were present at the same time, strand ‘K’ could be displaced from the gate complex (G3/K/T). It is worth mentioning that strand ‘I4’ hybridized with ‘T’ firstly and then strand ‘I5’ hybridized with ‘G3’ through exposed toehold in the reaction process.
 | ||
| Fig. 4 (a) Schematic illustration of the upstream ‘AND’ logic gate that output the key strand ‘K’. (b) (Left) The cascading ‘AND–YES’ logic gate and the corresponding truth table. (Right) The fluorescence intensity analysis of the mixture of the complex (A/B/L) and gate complex (G3/K/T) upon the addition of Hg2+ in the presence or absence of upstream inputs. ‘+’ denotes the addition of the components and ‘−’ denotes the absence of the components. [A/B/L] = 0.1 μM, [G3/K/T] = 0.4 μM, [I4] = 0.48 μM, [I5] = 0.48 μM, [Hg2+] = 4 μM. | ||
Gel results confirmed that the two inputs were essential to release ‘K’ (Fig. S2 and S3†). The fluorescence experiments were carried out to further validate the operation of activating the sensor. As shown in Fig. 4b, upon the addition of Hg2+, the intensity of fluorescence in the presence of ‘I4’ and ‘I5’ was significantly higher than that without inputs or a single input. Specifically, the fluorescence intensity of the sample with both inputs was at least 5 times higher than that without inputs or with only one input. The results indicated that the upstream ‘AND’ logic gate had opened the lock and then activated the sensor, thus the fluorescence signal increased. Here, we defined the fluorescent intensity above the threshold of 0.3 as ‘1’ in the logic gate, the above reaction corresponded to an ‘AND–YES’ logic gate using ‘I4’ and ‘I5’ as inputs and high fluorescence as output, based on this logic gate, mercury ions and nucleic acids could be recognized.
A nanodevice recognizing ATP and nucleic acids
After engineering the Hg2+ sensor successfully, we applied the strategy to ATP sensor. As shown in Fig. 5a, the ON-state ATP sensor (M/F/Q) contained the aptamer sequence.28 In the presence of ATP, the exposed aptamer sequence in strand ‘M’ will form the aptamer-ATP complex, leading to the folding of some segments of ‘M’ into a hairpin structure and strand ‘Q’ is released from strand ‘M’, resulting in high signal due to the separation of fluorophore and quencher. The sensor was in OFF-state in the presence of strand ‘L1’, thus the conformation of (M/F/Q/L1) would not change upon addition of ATP. However, the sensor was in ON-state upon the addition of strand ‘K1’ due to the toehold-mediated displacement reaction. Therefore, the complex of (M/F/Q/L1) would undergo conformation change upon the addition of strand ‘K1’ and ATP. Thus, the fluorescence changes only occurred when both ‘K1’ and ATP were present simultaneously.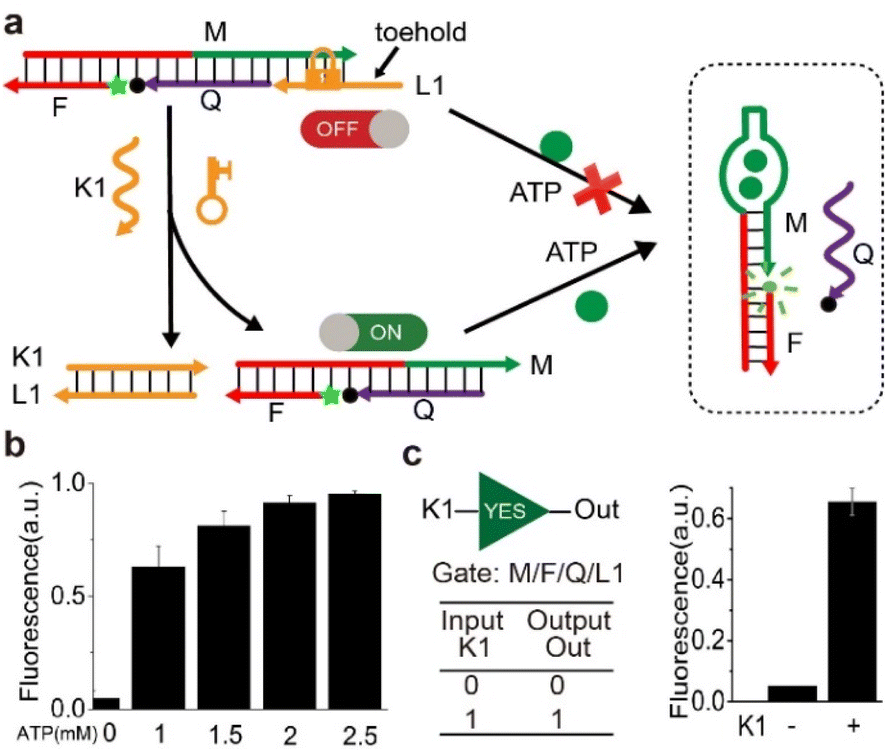 | ||
| Fig. 5 (a) Schematic illustration of engineering the ATP sensor for recognition of ATP and nucleic acid inputs. (b) Fluorescence intensity analysis of the ON-state sensor (M/F/Q) upon addition of different concentration of ATP. [M/F/Q] = 0.05 μM, [ATP] = 1 mM, 1.5 mM, 2 mM and 2.5 mM respectively. (c) (Left) The ‘YES’ logic gate and the corresponding truth table; (right) the fluorescence intensity analysis of the OFF-state sensor (M/F/Q/L1) upon addition of ATP in the presence and absence of the key strand ‘K1’. ‘+’ denotes the addition of the components and ‘−’ denotes the absence of the components. [M/F/Q/L1] = 0.05 μM, [K1] = 0.06 μM, [ATP] = 2 mM. | ||
The reaction of the ON-state ATP sensor was carried out at room temperature and was confirmed by fluorescence assay. As can be seen in Fig. 5b, without the addition of ATP molecules, the intensity of fluorescence almost remained unchanged. With the increasing concentration of ATP (1 mM, 1.5 mM, 2 mM, and 2.5 mM), the intensity of fluorescence increased correspondingly. Then, the inhibition and activation of the sensor was examined. As shown in Fig. 5c, the fluorescence intensity remained almost unchanged upon addition of ATP in the absence of key strand ‘K1’. However, the fluorescence intensity had a distinct increase upon the addition of ATP in the presence of key strand ‘K1’. The results indicated that the key strand ‘K1’ had opened the lock and then activated the sensor, thus the fluorescence signal increased. Here, a ‘YES’ logic gate was also performed using ‘K1’ as input and high fluorescence as output. Based on this logic gate, ATP and nucleic acids could be identified.
Different from previous sensing studies, this work constructed controllable nanodevices with multi-recognition capability by introducing the actuation module to the sensing module. The state of the sensing module was controlled by the actuation module. Compared with the previous studies, the nanodevices developed in this study are easy to build, free of synthesizing nanoparticles and heterozygous nucleic acid molecules, capable of responding to multiple stimuli, and facilitating the integration with diverse nucleic acid circuits. Meanwhile, the proposed strategy could apply to not merely aptamer-based structure-switching DNA sensing but the ones using specific interactions such as DNA-metal base pairs. On the other hand, the proposed nanodevices respond to the stimuli in a relatively higher concentration. Thus, the sensitivity and specificity of the nanodevice need to be improved coupled with signal amplification methods.2
Experimental
Materials
All the DNA strands (Table S1†) were purchased from Sangon Biotech Co., Ltd (Shanghai, China). Unmodified DNA strands were purified by polyacrylamide gel electrophoresis (PAGE), and modified DNA strands with fluorophore and quenchers were purified by high-performance liquid chromatography (HPLC). Mercury(II) nitrate [Hg (NO3)2] was obtained from Wanshan Mineral Products (Tongren, Guizhou, China). ATP2Na was purchased from Sigma-Aldrich Co. LLC. The DNA oligonucleotides for mercury reaction were dissolved in buffer A consisting of 50 mM Tris-HOAc, 100 mM NaOAc, 5 mM Mg(OAc)2, and 30 mM KNO3 at pH 7.4. The DNA oligonucleotides for ATP reaction were dissolved in Tris–HCl (20 mM, pH 8.3) containing 5 mM MgCl2 and 300 mM NaCl as buffer B. The concentration of DNA solutions was quantified using a Quawell Q6000, and absorption intensities were recorded at λ = 260 nm. The DNA concentrations were calculated by using extinction coefficients. All other chemicals were of analytical grade and used without further purification.The preparation of the sensor
The Hg2+ sensor structure (A/B) was formed by mixing corresponding single strands with 1:4 ratio of concentrations in reaction buffer A. The ATP sensor (M/F/Q) was formed by mixing corresponding single strands with 2:1:3 ratio of concentrations in buffer B. The mixtures were annealed in a polymerase chain reaction (PCR) thermal cycler at the reaction condition of 85 °C for 5 min, 65 °C for 30 min, 50 °C for 30 min, 37 °C for 30 min, 25 °C for 30 min, and finally kept at 25 °C.
The inhibition of the sensor
To achieve the suppression of the Hg2+ sensor, (A/B/L) was formed by mixing corresponding single strands with 1:4:4 ratio of concentrations in buffer A. To repress ATP sensor, (M/F/Q/L1) was formed by mixing corresponding single strands with 2:1:3:2 ratio of concentrations in buffer B. The mixtures were annealed in a polymerase chain reaction (PCR) thermal cycler at the reaction condition of 85 °C for 5 min, 65 °C for 30 min, 50 °C for 30 min, 37 °C for 30 min, 25 °C for 30 min, and finally kept at 25 °C.
Fluorescent experiments
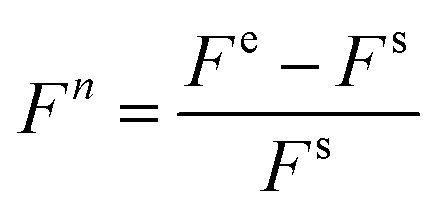
All experiments were performed at 25 °C in the reaction buffer using real-time fluorescence PCR (Xi'An TianLong Science and Technology Co., Ltd). In a typical reaction, the total volume of the solution was 100 μL for detection. The FAM fluorescence signal was measured at 492 nm excitation and 518 nm emission and was monitored at 2 min intervals. Here, fluorescence data were calculated for the first 30 minutes after addition of target analyte by the formula:where Fn is the calculated fluorescence intensity of each sample, Fe is the final fluorescence intensity of the sample after addition of mercury ions or ATP, and Fs is the initial fluorescence intensity of the sample before adding target analytes. The fluorescence results were obtained by the average values from at least three times repeated experimental results.
PAGE experiment
The samples were mixed with 6× loading buffer (Takara) and subjected to electrophoresis analysis on a 15% native polyacrylamide gel. The analysis was carried out in 1× TAE buffer (40 mM Tris, 20 mM acetic acid, 2 mM EDTA, pH 8.0) supplemented with 12.5 mM MgCl2 at 90 V for 1–2 hours at 4 °C. After EB (Sigma-Aldrich) staining, Gels were imaged using MiniGel (Beijing Sage Creation Science Co, Ltd).Conclusions
To sum up, we proposed a universal strategy to engineer the structure-switching biosensor by programmed sequestration and liberation of the conserved domain. The strategy was able to sense and respond to external stimulus in a sense-respond mode. Based on this strategy, the engineered nanodevices could respond to not only Hg2+ but also multiple DNA inputs. The reformed nanodevice was composed of separate actuation and sensing modules and had the advantage of modularity, which makes it easier to integrate with other DNA functional modules such as pH-sensitive unit31 or light-controlled unit.24 As a demonstration of the generality, an engineered ATP sensor that could recognize nucleic acid stimulus was also established. The experimental results show that the proposed strategy is particularly suitable to operate a structure-switching sensor and could have potential in biosensing, DNA computing, and smart nanodevice.Author contributions
Conceptualization, Y. X. H and Y. F. J; methodology, Y. F. J., Y. F. Y. and Y. J. L.; writing-original draft preparation, Y. X. H.; writing-review and editing, Y. X. H., Y. F. J., Y. F. Y. and Y. J. L.; all authors have read and agreed to the published version of the manuscript.Conflicts of interest
There are no conflicts to declare.Acknowledgements
This research was funded by the Science and Technology Project of Hebei Education Department (ZD2022098).Notes and references
- C. J. Marsit, J. Exp. Biol., 2015, 218, 71–79 CrossRef PubMed.
- H. Peng, A. M. Newbigging, M. S. Reid, J. S. Uppal, J. Xu, H. Zhang and X. C. Le, Anal. Chem., 2020, 92, 292–308 CrossRef CAS PubMed.
- X. Liu, Y. Wang and Y. Song, Biosens. Bioelectron., 2018, 117, 644–650 CrossRef CAS PubMed.
- X. Zhou, Q. Zhu and Y. Yang, Biosens. Bioelectron., 2020, 165, 112422 CrossRef CAS PubMed.
- S. Ling, M. Dong, Y. Xu, A. Xu, J. Lin, M. Lin, Q. Zhao and S. Wang, Biosens. Bioelectron., 2022, 217, 114676 CrossRef CAS PubMed.
- Z. Zhang, P. Sen, B. R. Adhikari, Y. Li and L. Soleymani, Angew. Chem., Int. Ed., 2022, 61, e202212496 CAS.
- Y. Dou, J. Su, S. Chen, T. Li, L. Wang, X. Ding, S. Song and C. Fan, Chem. Commun., 2022, 58, 6108–6111 RSC.
- M. Yu, G. Fenghua, W. Yongxiang, X. Maotian and S. Congying, et al., Biosens. Bioelectron., 2019, 134, 36–41 CrossRef PubMed.
- J. K. Jung, C. M. Archuleta, K. K. Alam and J. B. Lucks, Nat. Chem. Biol., 2022, 18, 385–393 CrossRef CAS PubMed.
- M. Andrianova and A. Kuznetsov, Pharmaceuticals, 2020, 13, 417 CrossRef CAS PubMed.
- C. Zhang, Y. Zhao, X. Xu, R. Xu, H. Li, X. Teng, Y. Du, Y. Miao, H.-c. Lin and D. Han, Nat. Nanotechnol., 2020, 15, 709–715 CrossRef CAS PubMed.
- S. Sun, H. Yao, F. Zhang and J. Zhu, Chem. Sci., 2015, 6, 930–934 RSC.
- X. Gong, J. Wei, J. Liu, R. M. Li, X. Q. Liu and F. Wang, Chem. Sci., 2019, 10, 2989–2997 RSC.
- H. Chen, J. Cao, P. Zhou, X. Li, Y. Xie, W. Liu and Y. Tang, Biosens. Bioelectron., 2018, 122, 1–7 CrossRef CAS PubMed.
- W. Zhou, W. Liang, D. Li, R. Yuan and Y. Xiang, Biosens. Bioelectron., 2016, 85, 573–579 CrossRef CAS PubMed.
- X. Liu, F. Wang, R. Aizen, O. Yehezkeli and I. Willner, J. Am. Chem. Soc., 2013, 135, 11832–11839 CrossRef CAS PubMed.
- B. Yin, B. Ye, H. Wang, Z. Zhu and W. Tan, Chem. Commun., 2012, 48, 1248–1250 RSC.
- X. Liu, R. Aizen, R. Freeman, O. Yehezkeli and I. Willner, Acs Nano, 2012, 6, 3553–3563 CrossRef CAS PubMed.
- H. Wang, J. Zheng, Y. Sun and T. Li, Biosens. Bioelectron., 2018, 117, 729–735 CrossRef CAS PubMed.
- Y. Du, P. Peng and T. Li, Chem. Commun., 2018, 54, 6132–6135 RSC.
- Z. Zhang, D. Balogh, F. Wang and I. Willner, J. Am. Chem. Soc., 2013, 135, 1934–1940 CrossRef CAS PubMed.
- Q. Jiang, Q. Liu, Y. Shi, Z. Wang, P. Zhan, J. Liu, C. Liu, H. Wang, X. Shi, L. Zhang, J. Sun, B. Ding and M. Liu, Nano Lett., 2017, 17, 7125–7130 CrossRef CAS PubMed.
- X. Chen, T. Chen, L. Ren, G. Chen, X. Gao, G. Li and X. Zhu, Acs Nano, 2019, 13, 7333–7344 CrossRef CAS PubMed.
- M. Cui, L. Chen, X. Li, J. Xu and H. Chen, Anal. Chem., 2020, 92, 4558–4565 CrossRef CAS PubMed.
- J. Fan, Y. Tang, W. Yang and Y. Yu, J. Mater. Chem. B, 2020, 8, 7501–7510 RSC.
- X.-P. He, X.-L. Hu, T. D. James, J. Yoon and H. Tian, Chem. Soc. Rev., 2017, 46, 6687–6696 RSC.
- Z. Wang, J. H. Lee and Y. Lu, Chem. Commun., 2008, 6005–6007 RSC.
- R. Nutiu and Y. Li, J. Am. Chem. Soc., 2003, 125, 4771 CrossRef CAS PubMed.
- J. Liu and Y. Lu, Adv. Mater., 2010, 18, 1667–1671 CrossRef.
- X. Li, L. Sun and T. Ding, Biosens. Bioelectron., 2011, 26, 3570–3576 CrossRef CAS PubMed.
- D. Mariottini, D. Del Giudice, G. Ercolani, S. Di Stefano and F. Ricci, Chem. Sci., 2021, 12, 11735–11739 RSC.
Footnote |
| † Electronic supplementary information (ESI) available. See DOI: https://doi.org/10.1039/d3ra00295k |
| This journal is © The Royal Society of Chemistry 2023 |