
 Open Access Article
 This Open Access Article is licensed under a Creative Commons Attribution-Non Commercial 3.0 Unported Licence
Kinetic effects of cationic surfactants on the photocatalytic degradation of anionic dyes in aqueous TiO2 dispersions†
Raimondo
Germani
ab,
Matteo
Mancinelli
 a,
Arianna
Roselli
a,
Matteo
Tiecco
a,
Simona
Fantacci
c,
Stefano
di Bona
a and
Tiziana
Del Giacco
*ab
a,
Arianna
Roselli
a,
Matteo
Tiecco
a,
Simona
Fantacci
c,
Stefano
di Bona
a and
Tiziana
Del Giacco
*ab
aDipartimento di Chimica, Biologia e Biotecnologie, Università di Perugia, Via Elce di Sotto 8, 06123 Perugia, Italy. E-mail: tiziana.delgiacco@unipg.it
bCentro di Eccellenza Materiali Innovativi Nanostrutturati (CEMIN), Università di Perugia, Via Elce di Sotto 8, 06123 Perugia, Italy
cComputational Laboratory for Hybrid/Organic Photovoltaics(CLHYO) – Istituto CNR di Scienze e Tecnologie Chimiche “Giulio Natta” (CNR-SCITEC) c/o Dipartimento di Chimica, Biologia e Biotecnologie, Via Elce di Sotto 8, 06213, Perugia, Italy
First published on 18th November 2022
Abstract
In this study, oxidative degradation of Orange G (OG) and Eosin Y (EY) dyes with TiO2 as the catalyst was explored in air-equilibrated aqueous dispersions under UV light irradiation. To determine the optimal operating conditions for degradation, various effects were investigated, such as the pH of the dye dispersion, the addition of cationic surfactants and the specific additive. The photodegradation efficiency of both dyes was significantly enhanced at alkaline pH, particularly in the presence of tetraalkylammonium bromide surfactants, as they promote a mutual interaction between the dye and TiO2 surface, otherwise prevented due to their negative charge under basic conditions. The surfactant concentration also played an important role, because it influences the state of surfactant aggregation on the semiconductor surface. The kinetic trend of the fragmentation process was strongly affected by different hydrophobic and electrostatic interactions that OG and EY and their derivative intermediates are able to establish with surfactant/TiO2 in various forms of aggregation, as well as by their redox properties. Density functional theory (DFT) calculations of charge distribution and Gibbs free energy changes of solvation, performed on optimized molecular geometry, were useful to support and rationalize the surfactant involvement in the degradation process.
Introduction
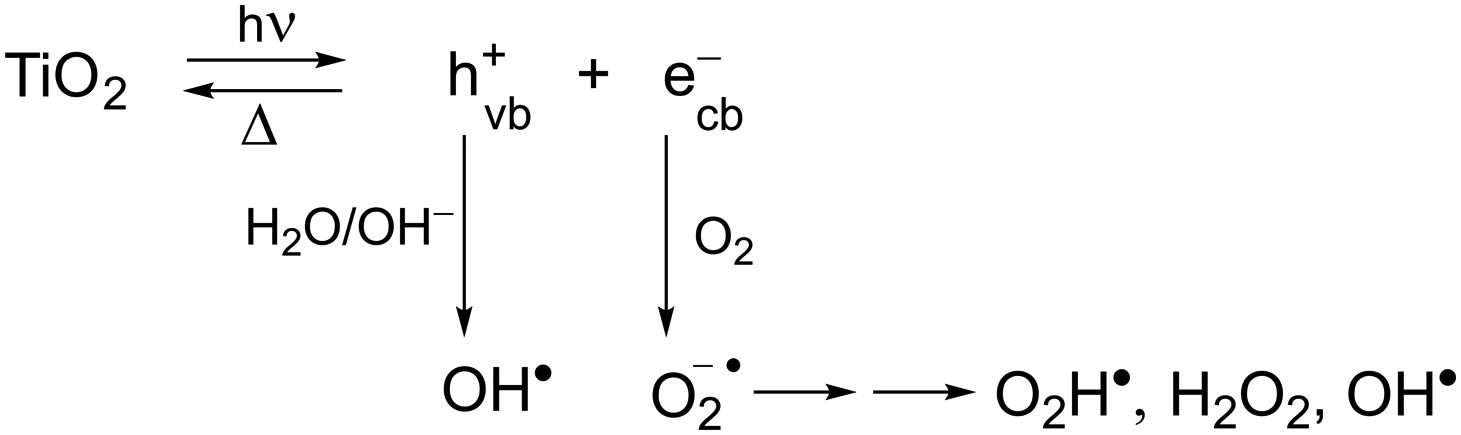
Currently the textile industry represents the most expanding and emerging sector worldwide. The various processing steps and operations of fiber production involve different chemicals and dyes, which then end up in wastewater discharge as toxic pollutants. In particular, dyes are mainly heterocyclic aromatic structures linked to polar groups, namely very stable compounds with complicated degradation. Various technologies, such as biological, chemical and physicochemical methods, of dye removal from textile effluents to reduce water pollution have been reported.1–5 In general, biodegradation treatments are more effective than chemical ones because of the low production of by-products, low processing costs and complete dye mineralization. Interestingly, as reported in recent studies, the emergent combination of chemical oxidative processes with biological treatment methods seems to increase the biodegradability of pollutant dyes.5The considerable need to treat colored effluents before discharging them into various water bodies has induced the use of heterogeneous catalysis employing advanced oxidation processes (AOPs) as potential destructive technologies leading to the total removal of most organic pollutants.6,7 TiO2-based photocatalytic reactions have been extensively used in these works. Although this semiconductor is activated by UV light rather than visible light, its use is advantageous over the others because it is chemically inert, photocatalytically stable, cheap and eco-friendly. As is well known, these types of reactions are induced by absorption of a photon with a light energy greater than the band gap (Eg = 3.2 eV, accordingly λ < 385 nm)8 leading to electron and hole pairs (ecb−/hvb+) generated, respectively, in the conduction and valence band (Scheme 1). In aqueous dispersions, polluting dyes can be oxidized either directly by the hole or by the powerful oxidant OH˙, typically produced from the reaction of hvb+ with H2O and OH− adsorbed. In addition, molecular oxygen yields a superoxide anion radical, which can lead to the formation of further reactive oxygen species, such as O2H˙, H2O2, and OH˙.9,10 The low quantum efficiency of TiO2 due to the fast recombination of photogenerated electrons and holes is one of the main problems in its use as a catalyst.
 | ||
| Scheme 1 Production of reactive oxygen species under UV light irradiation of TiO2. | ||
Extensive literature has covered the use of TiO2 as a photocatalyst in wastewater dye treatment. Recently, several other forms and structures of TiO2, also incorporating different additives (such as, for example, carbon-based nanomaterials, silver nanoparticles and various oxides) were evaluated in order to improve the optical and photo-catalytic effects. In an updated review, Ruan et al., collected and analyzed various catalytic systems involving a TiO2 semiconductor and their effectiveness in the degradation of organic dye pollutants.11 Surfactants also play a key-role in this topic, generally favoring the photodegradation process of organic pollutant dyes under different pH conditions.12–15 The degradation enhancement by TiO2 was mainly attributed to the increased adsorption of pollutant dyes, assisted by differently aggregated surfactants present on the solid surface of the semiconductor. In this context, still little explored, we have previously reported the use of amphiphilic molecules combined with Degussa P25 TiO2 as a strategy to reduce the coupling electron–hole, as able to increase the adsorption of the donor (an organic compound) on the TiO2 surface.16–19 Our recent developments in this area have involved an improvement of the oxidative degradation of pollutant organic dyes dissolved in an aqueous medium. This was due to the introduction of different surfactants, which induced an adequate environment for the aggregation of ionic dyes at concentrations around the critical micelle concentration (cmc). The addition of a surfactant has therefore proved to be a convenient approach for covering TiO2 and allowing the dye to be more efficiently adsorbed on the semiconductor surface.20,21 The role of surfactants as a mediator of the interaction of dye and semiconductor in favoring the electron injection from the dye to the photogenerated positive hole proved crucial for the oxidative degradation process.22–25
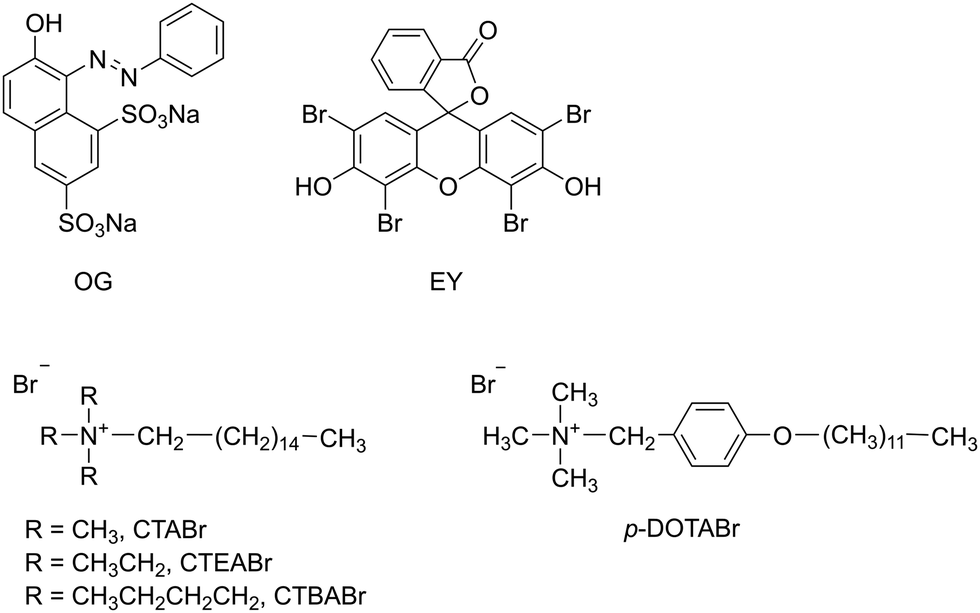
In the present article, we attempted to determine the feasibility of total degradation by UV/TiO2 in the presence of cationic surfactants of two dyes, both anionic at working pH, such as monoazo dye Orange G (OG) and Eosin Y (EY), a brominated derivative of fluorescein belonging to the xanthene group (Scheme 2). These particular dyes, widely used for dyeing in the textile industry, were selected due to the variety of functional groups in their structure. Moreover, this choice was based on availability, potential susceptibility to sensitized photolysis and chemical similarity to dyes of commercial importance. With regard to surfactants, cationic alkylammonium bromides, with different headgroup size (cetyltrimethylammonium bromide, CTABr, cetyltriethylammonium bromide, CTEABr, cetyltributylammonium bromide, CTBABr) and aromatic structure tail (p-dodecyloxybenzyltrimethylammonium, p-DoTABr) were used (Scheme 2). The effects of various parameters, such as pH of the dye dispersion, surfactant concentration and addition of specific additive, were investigated. However, the focus of this study was not only to examine the potentiality of the UV/TiO2/surfactant system to degrade the dyes, but also that to analyze the kinetic aspects of the degradation process.
 | ||
| Scheme 2 Dyes and surfactants used in this work. | ||
DFT calculations at the B3P86/6-311++G**/CPCM level of theory were carried out in order to obtain information about the charge distribution and the Gibbs free energy change of hydration of OG and EY in different protolytic forms. Calculations allowed us to rationalize how the different structural characteristics influenced not only the dye reactivity, but also that of the intermediates involved in the photodegradation process.
Experimental
Materials
Orange G (OG, Sigma-Aldrich), Eosin Y (EY, Sigma-Aldrich) and TiO2 (P25, Degussa, dried at 110 °C) were analytical grade reagents. CTABr was purchased from Sigma-Aldrich and recrystallized from the acetone/methanol mixture before use. CTEABr and CTBABr were synthesized by quaternization reaction of the correspondent tertiary amines with the appropriate alkyl bromide and purified by subsequent crystallizations from acetone or ethyl acetate with different amounts of methanol.26 Surfactant p-DoTABr was synthesized by quaternization reaction of trimethylamine with p-(dodecyloxy)benzyl bromide in ethanol solution and purified by crystallization from dried THF.27 Distilled water (pH 5.7) was used for all photodegradation experiments. The pH values were adjusted using either NaOH or HCl.Photodegradation experiments
For the photocatalytic tests, the suspended mixture was prepared by adding a weighed quantity of P25 TiO2 powder (0.4 g L−1) and surfactant (0−2.0×10⁻³ M) to 50 mL of the dye aqueous solution (2.0 × 10⁻⁴ M) at a certain pH. This catalyst dose was found to be the amount that best optimized the photodegradation efficiency. The suspension was then loaded into a reactor equipped with a jacket filled with re-circulated water by means of a thermostat set at 30 °C. Explorative irradiations were carried out in Applied Photophysics multilamp apparatus equipped with 6–12 phosphor-coated fluorescent lamps (15 W each) emitting at 355 nm (Δλ1/2 = 20 nm), wavelengths absorbed above all by TiO2.28 Before irradiation, the suspension was magnetically stirred in the dark for 30 min to reach equilibrated adsorption between TiO2, dye and atmospheric oxygen. The irradiated dispersion was kept under constant air-equilibrated and stirred conditions.Analytical procedures
With OG, in order to evaluate the percentage of degradation, 0.5 mL of mixture samples were collected at time 0 and after irradiation. To recover quantitatively the dye adsorbed on TiO2, 3.5 mL of ethanol and 0.1 mL of HCl 1.2 M were added into the sample. The same experimental procedure was followed with EY samples, but by diluting 2 mL of dispersion with 2 mL of ethanol, due to its lower extinction coefficient. Under the acidic analysis conditions used, both dyes were determined as protonated structures. Only with p-DoTABr, CH3CN was used for sample dilution, as ethanol was unable to desorb completely the components from the TiO2 surface. The catalyst was separated by filtration through a 0.2 μm-pore size membrane filter (Minisart RC) after adequately shaking the reaction mixture. The filtrate was then transferred into a 4 mL quartz cuvette for UV/Vis analysis. Absorption spectra were recorded on an Agilent 8453 Diode Array UV-Vis spectrophotometer.Observed rate constants for OG and EY degradation were determined by monitoring the change of absorbance at an appropriate wavelength as a function of the irradiation time at 30 °C. The k values were the average of at least three determinations. The average error estimated on the observed rate constants was ±10%.
Product analysis of both dyes irradiated using 12 lamps, in the presence of TiO2 (0.4 g L−1) and CTEABr (1.0 × 10⁻³ M) at pH 12 and 30 °C, was carried out following the above procedure, using methanol instead of ethanol for the sample dilution. LCMS-ESI analysis was performed on the diluted samples using an Agilent 1290 LC system coupled with an Agilent 6540 UHD accurate mass Q-TOF LC/MS instrument. The analysis of the irradiated samples at different times was compared with that of the corresponding not-irradiated samples, prepared following the same experimental procedure.
Computational details
Unconstrained geometry optimizations were performed in vacuo by means of Density Functional Theory (DFT),29 as implemented in the Gaussian09 (G09) program package,30 using B3LYP31–33 as the exchange–correlation functional and 6-311++g** as the basis set.34,35 Molecular geometries were optimized in water including solvation effects by means of the conductor-like polarizable continuum model C-PCM,36–38 as implemented in G09. The free energy of solvation (ΔGsolv) was computed as the difference between the C-PCM energy of the species optimized in solution and the reference calculation in vacuo, at the geometry optimized in solution. The molecular electrostatic potential (MEP) maps were obtained by plotting the electrostatic potential on the molecular density isosurface with a cutoff = 0.01.Results and discussion
TiO2-photocatalyzed degradation of OG assisted by surfactants at different pH
Before carrying out the OG photodegradation, absorption spectra were recorded in water at different pH. They showed identical shape at all pH examined, both in terms of absorbance and position of the bands (Fig. S1 in the ESI†). The visible band centred at 478 nm and a shoulder at ca. 400 nm were attributed to the n → π* transition of the azo-bond chromophore of hydrazon and diazo tautomers (Scheme 3a), respectively, with the bands at 248 and 330 nm assigned to benzene and naphthalene rings of both structures.39 A red shift was observed increasing the pH up to 13, tested by color change of the solution from yellow to orange, with maxima at 274, 390 and 504 nm, all assignable to the deprotonated structure OG(–H+)− (Scheme 3a). Such spectral variations with pH are in agreement with the pKa value of ca. 11.540 (a value of 12.8 was also reported),41 an unexpectedly high value for a delocalized structure such as OG(–H+)−, but in line with OG structures stabilized by an internal hydrogen bond due to the ortho-OH substituent. The presence of isosbestic points (Fig. S1, ESI†), where all spectra intersect, confirms the existence of a single pKa value in the pH range investigated.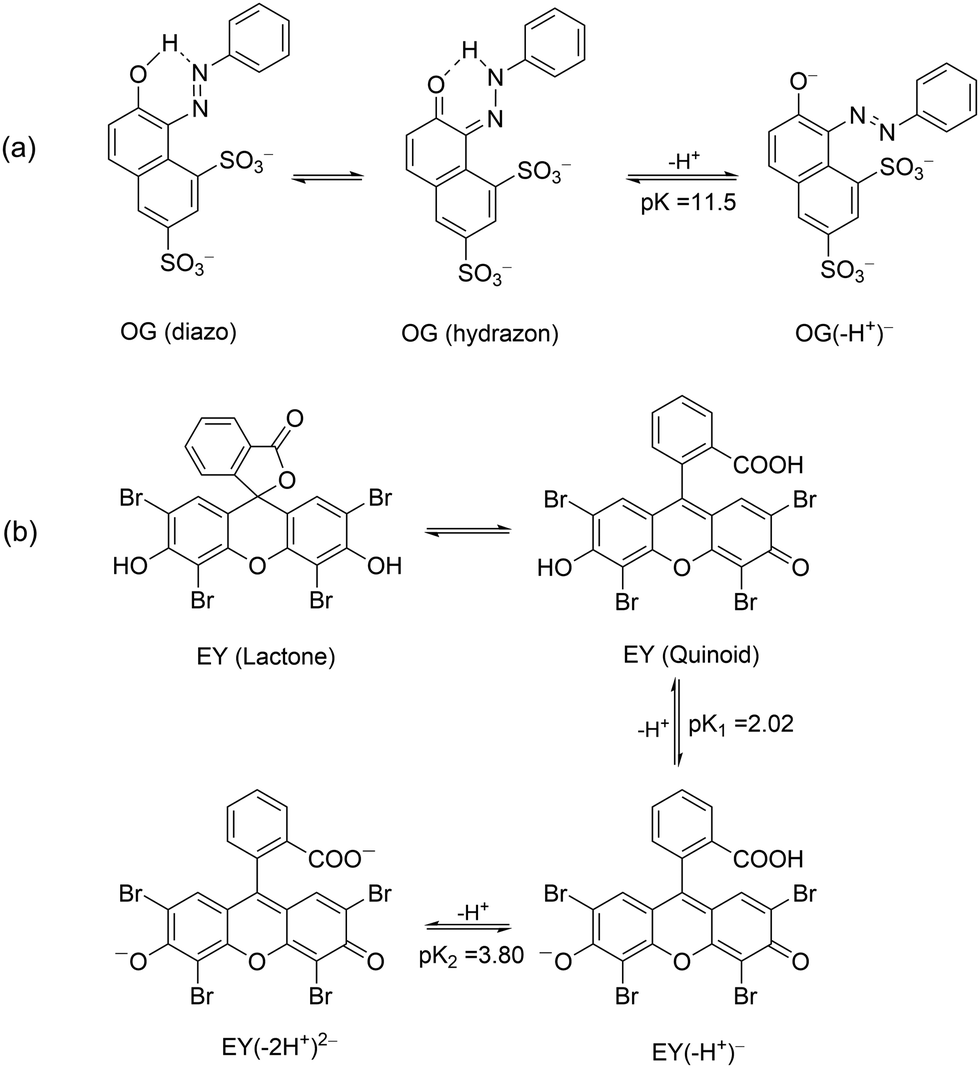 | ||
| Scheme 3 Deprotonation steps in aqueous solution of OG (a) and EY (b) dyes. | ||
Addition of CTEABr, CTBABr or p-DoTABr produced evident changes particularly of the visible band shape. The spectra of OG solutions at pH 5.7 in the presence of 1.0 × 10⁻³ M surfactants, value higher than the corresponding cmcs (7.9 × 10⁻⁴, 3.3 × 10⁻⁴ and 5.0 × 10⁻⁴ M for CTEABr, CTBABr or p-DoTABr, respectively)18,42 are shown in Fig. S2 (ESI†). As observed, the absorbance band at 400 nm moved to 427 nm and increased in intensity at the expense of absorption at 474 nm, which looked vibronically more structured with a slight shift to the red. By comparing with the spectral bands observed in water, it could be hypothesized that the micellar aggregates influence the keto–enol tautomerism equilibrium, shifting it towards the OG (diazo) form. This could be due to the intervention of electrostatic interactions between micellar surface headgroups and the OG diazo group, which could influence the formation of a N–H bond. The spectra of OG solutions recorded at pH 12 in the presence of CTEABr concentrations from 2.0 × 10⁻⁴ M (concentration close to cmc in 0.01 M NaOH, which is 2.5 × 10⁻⁴ M)18 to 5.0 × 10⁻³ M are shown in Fig. S3 (ESI†). As observed, the spectral shape, assigned to OG(–H+)−, was quite different than that recorded at pH 12 without surfactant, confirming a significant interaction between micelles and dye at alkaline pH too. The spectra highlighted two isosbestic points (at 530 to 443 nm), thus OG(–H+)− establishes an equilibrium with the micellar aggregates.
Initially the photodegradation of OG with UV light was performed at pH 5.7 under different experimental conditions including: (i) dye alone, (ii) dye in the presence of TiO2 and (iii) dye in the presence of TiO2 and cationic surfactants such as CTEABr, CTBABr and p-DoTABr at 1.0 × 10⁻³ M concentration. Under UV light (12 fluorescent lamps), but in the absence of catalyst, a negligible variation of the dye absorption spectra was detected at various time intervals up to 180 min, as observed in Fig. S4 (ESI†). After TiO2 addition the characteristic absorption bands at ca. 250, 330 and 495 nm decreased until they almost disappeared after 180 minutes of irradiation, indicating that both the aromatic moiety and –N![[double bond, length as m-dash]](https://www.rsc.org/images/entities/char_e001.gif) N– group were being destroyed (Fig. 1). The addition of all surfactants tested inhibited the photocatalytic degradation of OG in TiO2 aqueous dispersions, as observed by the absorption spectra recorded in the presence of CTABr and shown in Fig. S5 (ESI†) as an example. In general, the shape of the absorption spectra recorded over time in the presence of surfactant was very similar to those recorded without surfactant; this indicates that the surfactant role is mainly to affect the process kinetics. The absorbance values elaborated in terms of ratios of residual OG concentration (C) on its initial concentration (C0) as a function of the irradiation time are collected in Fig. S6 (ESI†). In all the cases, the reactions followed clean pseudo-first order kinetic law with observed rate constants collected in Table 1. The inhibiting effect is clearly due to the preferable electrostatic interaction of OG with the denser positive charge on the micellar surface as compared to that on the patchy bilayer structures adsorbed on TiO2.19,43 The greater inhibition of CTBABr compared to CTEABr, namely with decreasing of the headgroup size, is in line with the more ionized CTBABr (ionization degree, α, equal to 0.51, against 0.36 of CTEABr).18 Therefore CTBABr will be able to interact more efficiently with the negatively charged dye, subtracting it from the photodegradation process.17 The slower dye degradation process observed with p-DoTABr, despite an even smaller α value (0.25 in water),27 likely depends on π–π stacking as well as van der Waals interaction due to the presence of aromatic rings in both surfactant and dye. The intervention of specific chemical bonds of one of the two negative –SO3− groups of the dye with the surface hydroxyl groups of the semiconductor at lower pH, as suggested by Kordulis and coworkers,44 could be a further explanation of the increased reactivity due to TiO2 alone.
N– group were being destroyed (Fig. 1). The addition of all surfactants tested inhibited the photocatalytic degradation of OG in TiO2 aqueous dispersions, as observed by the absorption spectra recorded in the presence of CTABr and shown in Fig. S5 (ESI†) as an example. In general, the shape of the absorption spectra recorded over time in the presence of surfactant was very similar to those recorded without surfactant; this indicates that the surfactant role is mainly to affect the process kinetics. The absorbance values elaborated in terms of ratios of residual OG concentration (C) on its initial concentration (C0) as a function of the irradiation time are collected in Fig. S6 (ESI†). In all the cases, the reactions followed clean pseudo-first order kinetic law with observed rate constants collected in Table 1. The inhibiting effect is clearly due to the preferable electrostatic interaction of OG with the denser positive charge on the micellar surface as compared to that on the patchy bilayer structures adsorbed on TiO2.19,43 The greater inhibition of CTBABr compared to CTEABr, namely with decreasing of the headgroup size, is in line with the more ionized CTBABr (ionization degree, α, equal to 0.51, against 0.36 of CTEABr).18 Therefore CTBABr will be able to interact more efficiently with the negatively charged dye, subtracting it from the photodegradation process.17 The slower dye degradation process observed with p-DoTABr, despite an even smaller α value (0.25 in water),27 likely depends on π–π stacking as well as van der Waals interaction due to the presence of aromatic rings in both surfactant and dye. The intervention of specific chemical bonds of one of the two negative –SO3− groups of the dye with the surface hydroxyl groups of the semiconductor at lower pH, as suggested by Kordulis and coworkers,44 could be a further explanation of the increased reactivity due to TiO2 alone.
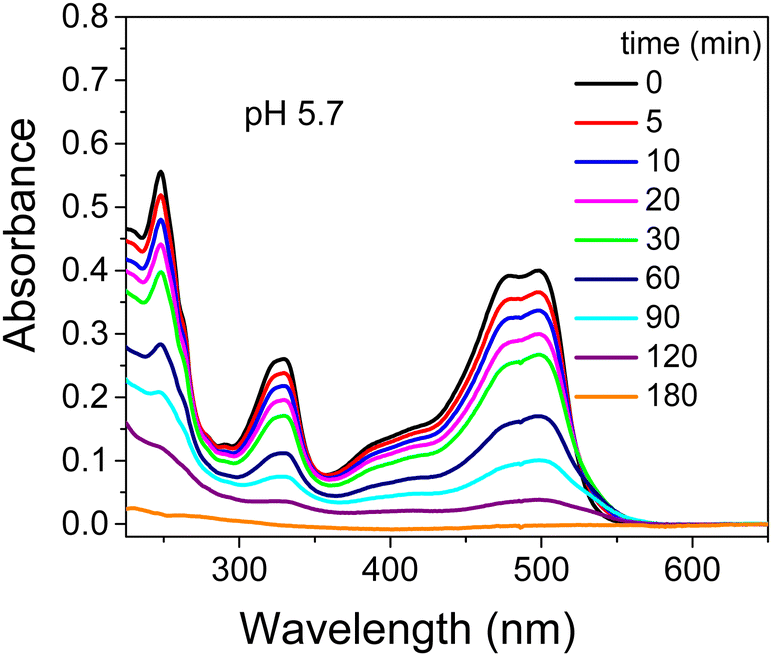 | ||
| Fig. 1 Absorption spectra recorded during the photodegradation of 2.0 × 10⁻⁴ M OG (analysis at 2.5 × 10⁻⁵ M after dilution with ethanol in acid solution) by TiO2 (0.4 g L−1) in aqueous dispersion at pH 5.7 as a function of irradiation time (12 UV lamps). | ||
| Surfactant | k obs (min−1) (R2) |
|---|---|
| a [OG] = 1.0 × 10⁻⁴ M, [TiO2] = 0.4 g L−1, [surfactant] = 1.0 × 10⁻³ M, pH 5.7, 12 UV fluorescent lamps, 30 °C. kobs values were determined by pseudo first-order kinetic fitting. | |
| No surfactant | 1.5 × 10⁻² (0.995) |
| CTEABr | 9.9 × 10⁻³ (0.997) |
| CTBABr | 7.5 × 10⁻³ (0.998) |
| p-DoTABr | 4.4 × 10⁻³ (0.998) |
Regarding the pH effect, the investigation involved in particular CTEABr, the surfactant showing a less inhibitory effect at pH 5.7. Initially, the degradation reactions were carried out at pH values of 5.7, 9.0 and 12 under UV light (6 fluorescent lamps). Fig. 2a shows the degradation kinetics in the absence of surfactant at the three pH investigated. The reactivity was almost the same at pH values of 5.7 and 9 (see the kobs values collected in Table 2), but it increased about twice at pH 12. In Fig. S7 (ESI†) the time resolved absorption spectra at pH 12 are shown as an example. The two main factors that could influence the pH effect on degradation are the dye ionization state and the charge of the catalyst surface. As the TiO2 surface, it is positively and negatively charged below and above its point zero charge (pzc) (5.43 for TiO2 P25),45 respectively. To rationalize the influence of the chemical structures of the differently ionized dye, electrostatic potentials maps (EPMs), visualized in Fig. 3, were calculated for the protolic and deprotonated forms, after determining the conformers at the minimum energy, optimized in water by the B3LYP/6-311++G**/C-PCM method (Fig. S8, ESI†). As observed by chromatic variations, the EPMs of the not deprotonated specie suggest that the condensed aromatic rings are weakly negatively charged with respect to the –SO3− groups. Passing to OG(–H+)−, the whole structure is almost more negatively charged, with the charge density which gradually increases by shifting towards the sulfonate group. The much higher value (−311.6 kcal mol−1) of hydration Gibbs free energy changes of OG(–H+)− than that of OG(diazo) and OG(hydrazon) (−160.5 and 160.2 kcal mol−1, respectively) is in line with a more intense and delocalized negative charge as highlighted by EPMs. Therefore, on the base of electrostatic interactions, slower photocatalytic degradation should occur at higher pH, contrary to what was observed. This result therefore supports the possibility of specific interactions (chemical bonding) of –SO3− groups of the dye with the surface hydroxyl groups of the catalyst also at alkaline pH.44 Besides, the improved efficiency of OG degradation at pH 12 could depend on production increase of OH˙ radicals, generated by oxidation of hydroxyl ions more available on the TiO2 surface.46,47 The stabilization due to the electrostatic attraction between the photocatalyst surface and the dye cation radicals, which are the intermediates responsible for the degradation, should also play a role. The absorption spectra recorded during the photodegradation of OG catalyzed by TiO2 and in the presence of CTEABr (1.0 × 10⁻³ M) at various pH values, showed only a different rate as for the absorbance decrease compared to those recorded without surfactant (Fig. S9 (ESI†), pH 12 reported as an example), thus similar products can be hypothesized (see below). The kinetic data reported in Table 2, determined by correlation of C/C0 values as a function of time with pseudo-first order kinetic law (Fig. 2b), highlighted that the reaction was more favored at pH 12 than at lower pH (5.7 and 9), as already observed in the absence of surfactant. Moreover, only an alkaline pH causes the photodegradation of the dye to be favored by the intervention of the surfactant; indeed, in the presence of 1.0 × 10⁻³ M surfactant, kobs increased by a factor of ca. 3 (see Table 2). As previously reported,17–19 the cationic micelles adsorb directly (and then rearrange into different aggregation structures)23,43 to the negatively charged TiO2 surface in alkaline medium. This assists the approach of the dye to the surface of the semiconductor, which prevails over the competitive association with the micellar surface, despite the high negative charge density positioned on the naphthalene system (Fig. 3). In addition, the micellar aggregates on TiO2 should increase the OH− concentration near the surface, resulting in an enhancement of OH˙ radical concentration responsible for photodegradation. A cartoon of the dye distribution for system OG/TiO2/micelle is displayed in Scheme 4. At pH 5.7 and 9 the adsorption of the dye on the TiO2 surface is favored, likely due to specific chemical bonds between –SO3− and hydroxyl groups of the semiconductor surface (equilibrium a); the intervention of equilibrium b is the cause of the inhibiting effect of the surfactant. By increasing the pH, the dye can interact with TiO2 by micelles or their different rearranged aggregation structures22,43 adsorbed on the semiconductor (equilibrium c). The interaction of a preformed dye-micelle complex with the semiconductor surface cannot be excluded (equilibrium d).
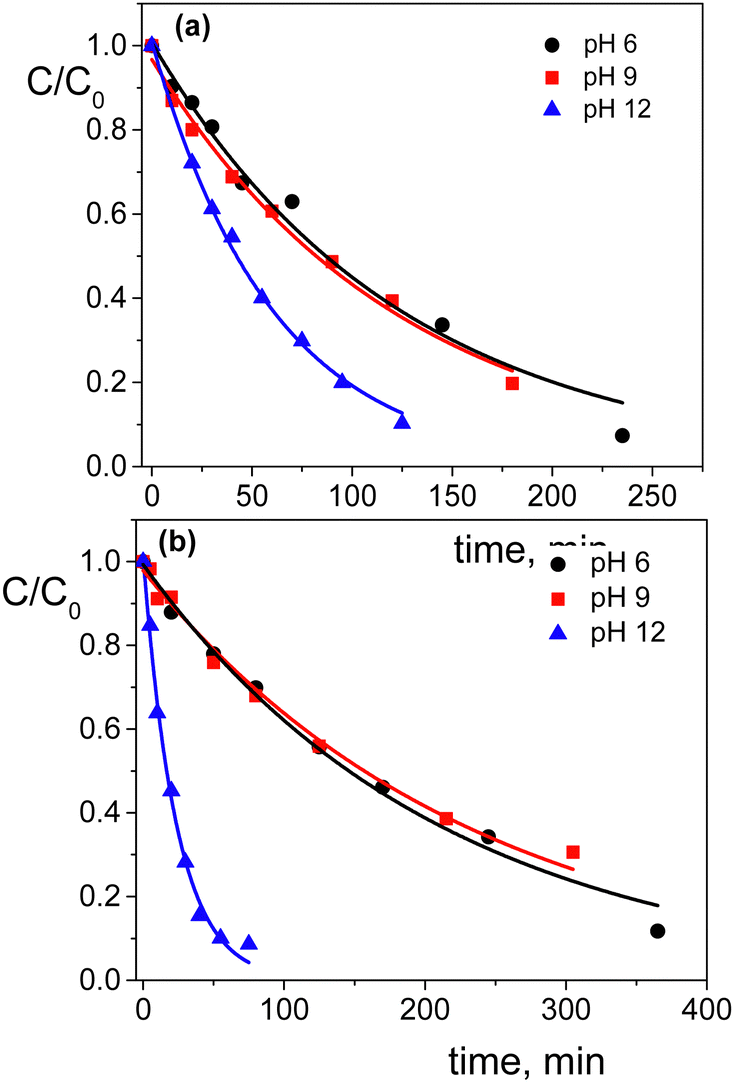 | ||
| Fig. 2 Photodegradation kinetics of OG (2.0 × 10⁻⁴ M) catalyzed by TiO2 (0.4 g L−1) in aqueous dispersion at pH 5.7 (●), pH 9 (■) and pH 12 (▲) without surfactant (a) and in the presence of 1.0 × 10⁻³ M CTEABr (b); λanal = 498 nm. The solid lines represent the corresponding first order kinetic fittings. | ||
| pH | k obs, (min−1) (R2) | |
|---|---|---|
| a [OG] = 2.0 × 10⁻⁴ M; [TiO2] = 0.4 g L−1; [CTEABr] = 1.0 × 10⁻³ M; 6 UV fluorescent lamps; 30 °C. kobs values were determined by pseudo first-order kinetic fitting. b In the presence of 1 M CH3OH. | ||
| No CTEABr | With CTEABr | |
| 5.7 | 8.1 × 10⁻³ (0.9830) | 4.7 × 10⁻³ (0.998) |
| 9.0 | 8.0 × 10⁻³ (0.9914) | 4.3 × 10⁻³ (0.991) |
| 12 | 1.5 × 10⁻² (0.9975) | 4.2 × 10⁻² (0.994) |
| 4.9 × 10⁻² (0.987)b | ||
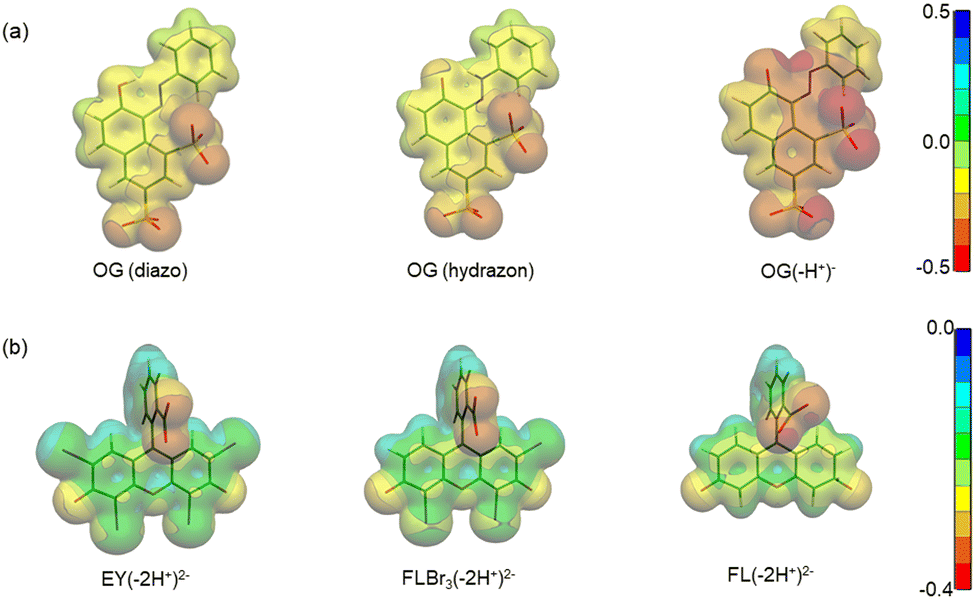 | ||
| Fig. 3 Electrostatic potential maps of (a) OG(diazo), OG(hydrazon) and OG(–H+)−, and (b) EY(–2H+)2−, FLBr3(–2H+)2− and FL(–2H+)2− calculated in the gas phase. | ||
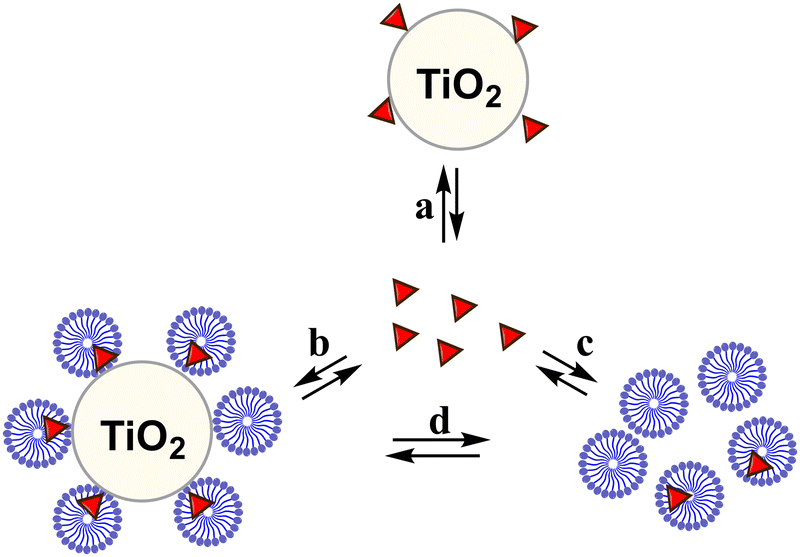 | ||
| Scheme 4 Partition equilibria of dye with TiO2 and micelles. The symbol Δ indicates the molecule of dye. | ||
Finally, the photodegradation was investigated at different CTEABr concentrations (up to 5.0 × 10⁻³ M) at pH 12. The degradation profile, shown in Fig. 4, reported as a ratio of residual OG concentration after 15 min irradiation (C15) on its initial concentration (C0) (both values determined by absorbance measurements, see the Experimental section) as a function of [CTEABr], highlighted that 6.0 × 10⁻⁴ M represents the surfactant concentration at which the amount of dye associated with the semiconductor surface is maximum.
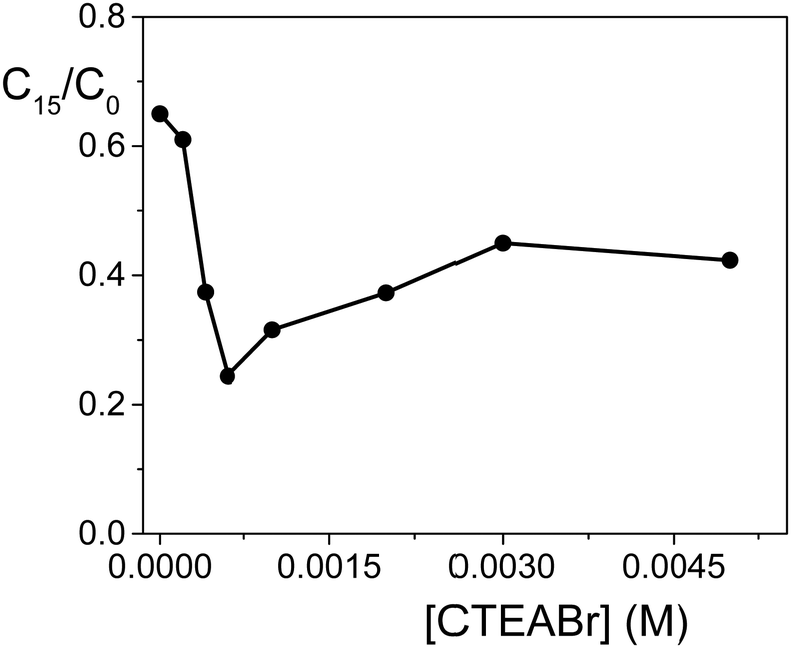 | ||
| Fig. 4 Photodegradation of OG (2.0 × 10⁻⁴ M) by TiO2 (0.4 g L−1) in an aqueous dispersion at pH 12 after 15 min of irradiation (12 UV lamps) as a function of CTEABr concentration; λanal = 498 nm. | ||
LC-MS analysis carried out on elaborated samples of OG/TiO2/CTEABr (1.0 × 10⁻³ M) dispersion picked up at an intermediate time of 20 min and after 90 min of irradiation, when the dye mixture was drastically decolorized (Fig. S10, ESI†). The intensity of the parent dye molecule decreased substantially, however the intermediate products during the degradation process were at very low concentrations due to their fast transformation. It is already known that the OG photodegradation products by TiO2 arise from the OH˙ radical attack at various positions on the OG structure, especially the electron rich π diazo-bond followed by sulfonate and groups and with less efficiency the less deactivated naphthalene moiety. The detailed mechanism processes of the OG photocatalyzed degradation was reported by Meetani and coworkers.48 In our case, only trace of 1,4-dihydroxybenzene (C6H6O2, m/z = 110.04) was detected.
TiO2-photocatalyzed degradation of EY assisted by surfactants at pH 12
The UV-Vis spectra of EY showed in aqueous solution both at pH 5.7 and 12 an intense band at 517 nm with a shoulder at 490 nm due to the xanthene ring, the chromophoric part of the molecule that is responsible for its red color. Less intense bands at 343, 301 and 255 nm were assigned to π → π* transitions of the aromatic electrons (Fig. S11, ESI†).49 Taking into account the pKa values (2.02 and 3.80 for equilibrium of –OH and –COOH deprotonation, respectively, Scheme 3b), EY was exclusively present in its di-ionized quinonoid form, EY(–2H+)2− at both pH values investigated.50 On addition of 1.0 × 10⁻³ M cationic surfactants (such as CTABr, CTEABr, CTBABr and p-DoTABr), a concentration higher than the cmc value for all of them,18,42 a bathocromic shift of ca. 10–13 nm was observed, as expected from the dye-surfactant interaction due to coulombic attraction.51All the photodegradation experiments with EY presented in this work were carried out at pH 12, which is the experimental condition in which the role of the surfactant was more intriguing. The absorption spectra of the degradation samples with a hypothetical intermediate (A) absorbing around 350 nm, which then evolved into uncolored forms up to 150 min of irradiation (Fig. S12, ESI†). Indeed, the pseudo-first order fitting of the decay at 512 nm produced a rate constant close to that of the rise at 350 nm (2.2 × 10⁻² and 2.1 × 10⁻² min−1, respectively), determined by a first order grow-decay fitting (inset of Fig. 5). The A286vs. time correlation clearly indicated that both EY and intermediate A absorbed in this wavelength region. Absorption spectra recorded for the EY photodegradation by TiO2 in the presence of CTABr were similar as regards the shape, but not from a kinetic point of view (Fig. S13, ESI†). Effectively, the EY decay at 482 nm fitted the pseudo-first order with a rate constant of 8.8 × 10⁻³ min−1 (Table 3), a value lower of ca. 2.5 times than that determined without surfactant, and closely matched the rise rate of the degradation product A that absorbs at 350 nm (kobs = 1.0 × 10⁻² min−1, inset of Fig. S13, ESI†). The pink color observed for the final dispersion indicates that residual EY was still present (Fig. S14, ESI†).
 | ||
| Fig. 5 Absorption spectra recorded during the photodegradation of 2.0 × 10⁻⁴ M EY (analysis at 1.0 × 10⁻⁴ M after dilution with ethanol in acid solution) by TiO2 (0.4 g L−1) in aqueous dispersion at pH 12 as a function of irradiation time (12 UV lamps). Inset: Change in absorbance at 286, 350 and 512 nm as a function of irradiation time. The solid lines represent the corresponding kinetic fittings. | ||
| Surfactant | k obs (min−1) (R2) |
|---|---|
| a [EY] = 2.0 × 10⁻⁴ M, [TiO2] = 0.4 g L−1, [surfactant] = 1.0 × 10⁻³ M, pH 12, 12 UV fluorescent lamps, 30 °C. kobs values were determined by mono-exponential or be-exponential fitting. b In the presence of CH3OH 1 M. | |
| No surfactant | 2.2 × 10⁻² (0.998) |
| 1.0 × 10⁻² (0.990)b | |
| CTABr | 8.8 × 10⁻³ (1.000) |
| CTEABr | 5.3 × 10⁻², 1.2 × 10⁻⁷ (0.998) |
| 4.8 × 10⁻² (0.994)b | |
| p-DoTABr | 9.6 × 10⁻² (0.990) |
The addition of CTEABr or p-DoTABr induced a significant modification in the absorption spectra, as observed in Fig. 6 and Fig. S15 (ESI†), respectively. The visible band at 525 nm observed with CTEABr, which shifted to 500 nm with p-DoTABr due to the use of CH3CN instead of ethanol (see the Experimental section), first decreased quickly and then exhibited a slower decay with both surfactants (insets in Fig. 6 and Fig. S15, ESI†), highlighting that besides EY other colored species absorb. Indeed, although EY already appeared fully degraded after ca. 50 min of irradiation with kobs of 5.3 × 10⁻² (obtained by be-exponential fitting) and 9.6 × 10⁻² min−1 (Table 3), for CTEABr and p-DoTABr respectively, both values were significantly higher than that obtained with the catalyst alone (2.2 × 10⁻² min−1).
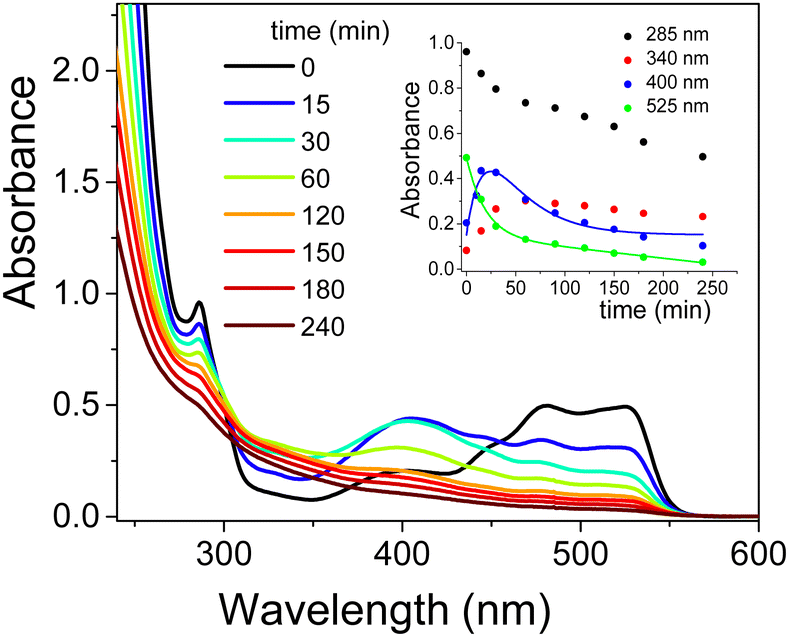 | ||
| Fig. 6 Absorption spectra recorded during the photodegradation of 2.0 × 10⁻⁴ M EY (analysis at 1.0 × 10⁻⁴ M after dilution with ethanol in acid solution) by TiO2 (0.4 g L−1) in aqueous dispersion at pH 12 in the presence of CTEABr (1.0 × 10⁻³ M) as a function of irradiation time (12 UV lamps). Inset: Change in absorbance at 285, 340, 400 and 525 nm as a function of irradiation time. The solid lines represent the corresponding kinetic fittings. | ||
The absorption spectra showed a residual UV-Vis absorbance even 250 min after irradiation, as visible to the naked eye (Fig. S16, ESI†). Plausibly, structures similar to that of EY, but with a lower bromide atom number, may have formed. As known from available literature, independently of the degree of (de)bromination (tribromo- and dibromofluorescein) the UV-Vis spectra of the debrominated species are qualitatively identical,49 with their main absorbance bands at wavelengths of about 10–15 nm lower than that of EY.52 Accumulation of debromination compounds is likely due to their more effective interaction with CTEABr and p-DoTABr micelles, which slows down the corresponding decay rates. This interaction could be promoted by an increase of electronic density on the xanthene moiety for this species compared to eosin, as attested by EPMs calculation made for structures EY(–2H+)2−, tribromofluorescein, FLBr3(–2H+)2− and di-ionized fluorescein, FL(–2H+)2− (Fig. 3). The increase of Gibbs free energy change of hydration as the number of bromine atoms decreases (−140.3, 143.5 and 183.4 kcal mol−1, respectively) is in line with the polarity increase of these structures. The band rising around 410 nm with a similar rate to that of EY decay (kobs = 5.7 × 10⁻² and 1.1 × 10⁻¹ min−1, with CTEABr and p-DoTABr respectively) highlighted the formation of a further degradation product, which then transformed into intermediate A (see above), which decayed very slowly (insets in Fig. 6 and Fig. S15, ESI†). The color observed for the final dispersion, although EY(–2H+)2− was not present anymore, indicated that other chromophores still able to absorb light remained (Fig. S16, ESI†). Based on the literature,49 the band at 410 nm was assigned to the final debromination product of EY, namely fluorescein (FL). Really, the absorption spectrum of pure FL, recorded under the same acidic conditions, showed the main absorbance band at 443 nm (Fig. S17, ESI†), but this different spectral position could be due to the overlap with the spectra of other components of the photodegraded mixture. FL(–2H+)2− xanthene group is more negatively charged than that of brominated anions, as observed by EPM data (Fig. 3). This favors its interaction by coulombic attraction with the positive headgroups of the micellar interface, which will facilitate the accumulation of this photoproduct. Finally, on the basis of the observations collected and the degradation scheme proposed by Sonawane et al.,53 it seems reasonable to assign to intermediate A (absorption around 350 nm, see above) a less conjugated structure such as decarboxylated fluorescein. The formation of this product could be due to the photo-Kolbe decarboxylation reaction.54
Monitoring of photodegradation catalyzed by the TiO2/CTEABr system under the identical experimental conditions seen above, but with the addition of methanol, showed the absorption spectra at various reaction times depicted in Fig. 7. As observed, the visible band of EY at 527 nm disappeared completely after ca. 60 min of irradiation with the same rate as the appearance of the band centered at 400 nm assigned to fluorescein (kobs = 4.8 × 10⁻² and 5.2 × 10⁻² min−1, for decay and rise respectively). The expected inhibiting effect of methanol, usually applied as hydroxyl radical scavengers,55 was quite slight (kobs value about 10% lower than that in the absence of alcohol, Table 3). The faster degradation of partially brominated intermediates, therefore no longer observable in the presence of methanol, clearly allows a greater accumulation of fluorescein, which should then undergo decarboxylation. One hypothesis for this behavior is that methanol acts as a co-solvent destroying partially the CTEABr micelles, thus increasing the aggregates in the form of hemi-micelles and bilayer on the surface of the catalyst.43 This effect should promote the adsorption of different photoproducts on the TiO2 surface and their consequent degradation. This peculiar action of the surfactant was endorsed by the observation that methanol significantly inhibited the dye degradation in the absence of CTEABr (Fig. S18, ESI†). In fact, the observed rate constant determined in this condition (1.0 × 10⁻² min−1, Table 3) is more than halved compared to that without scavenger (2.2 × 10⁻² min−1, Table 3).
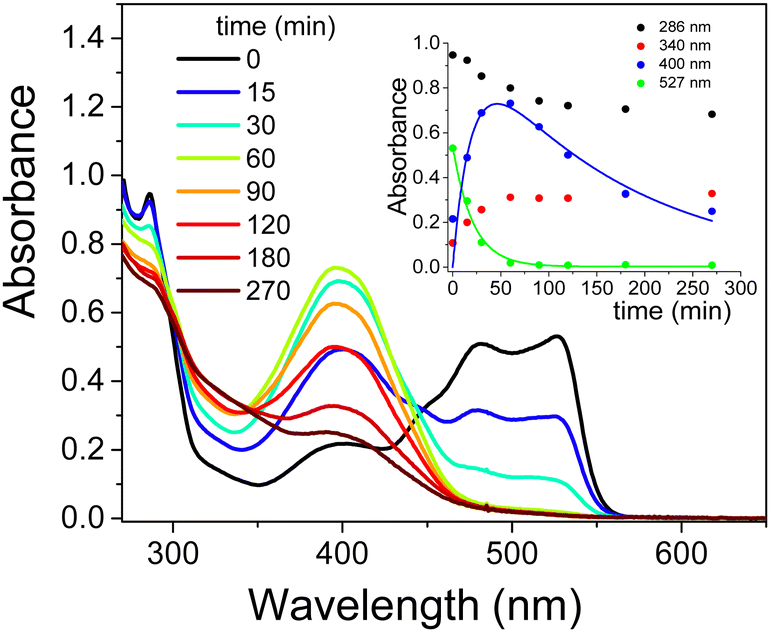 | ||
| Fig. 7 Absorption spectra recorded during the photodegradation of 2.0 × 10⁻⁴ M EY (analysis at 1.0 × 10⁻⁴ M after dilution with ethanol in acid solution) by TiO2 (0.4 g L−1) in aqueous dispersion at pH 12 in the presence of CTEABr (1.0 × 10⁻³ M) and CH3OH (1.0 M) as a function of irradiation time (12 UV lamps). Inset: Change in absorbance at 286, 340, 400 and 527 nm as a function of irradiation time. The solid lines represent the corresponding kinetics fittings. | ||
To identify the photoproducts detected by the spectrophotometric method, HPLC-HRMS analyses of photodegradated EY samples were carried out in the presence of CTEABr at pH 12. In all analyzed solutions, only one debrominted product with the formula C20H9O5Br3 (m/z = 566.79), identified by mass spectrum and UV-Vis absorption spectrum (λmax = 518 nm),56 was detected (Fig. S19, ESI†). The tribrominated intermediate was formed during the first 30 min of irradiation and then degraded over time. Unfortunately, both in negative and positive mode, the supposed intermediates, namely fluorescein and decarboxylated fluorescein, were not revealed. This could be explained by either low ionization efficiency or because the concentration of these intermediates was lower than the detection limit of the UV/Vis diode array detector. Based on the identification of the intermediates by spectrophotometric analysis too, a tentative degradation pathway of Eosin Y is depicted in Scheme 5.
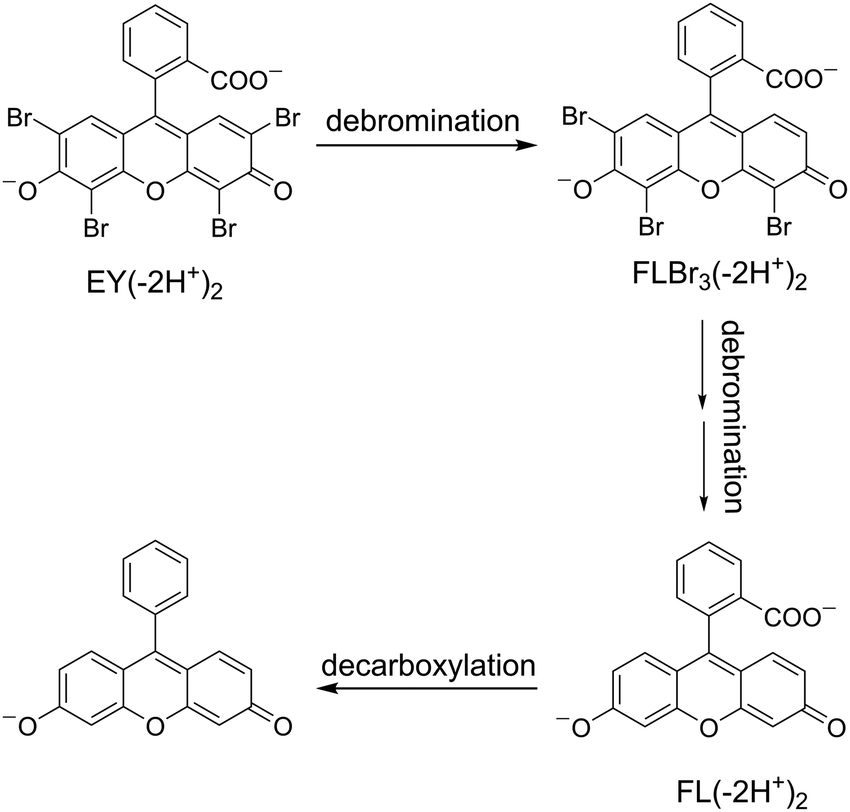 | ||
| Scheme 5 Schematic diagram of reaction intermediate formation during Eosin Y photocatalytic degradation. | ||
OG and EY photodegradation compared
It is remarkable that a significant difference in the kinetic evolution of the degradation process at pH 12 between OG and EY was observed. The main dissimilarity lies in the fact that, as evidenced by the spectroscopic analysis, with EY the intermediates are accumulated (this was significantly assisted by the intervention of CTEABr and p-DoTABr), while the degradation of OG evolved to mineralization products by means of fast successive transformations. The decay of de-ionized EY, made fast also by its very low oxidation potential (0.78 V vs. SCE in CH3CN:H2O 1![[thin space (1/6-em)]](https://www.rsc.org/images/entities/char_2009.gif) :1)57 leads to the formation of debromination products which transform one after the other until a probable complete debromination (Scheme 5). During these steps, the decay slows down more and more as less bromine atoms are bound to the aromatic system. In parallel, the tendency of the intermediates to interact with the cationic micellar surface increases as the aromatic system becomes more negatively charged (Fig. 3). As to OG, it is more oxidizable than EY (0.57 V vs. SCE in CH3CN:H2O 1:1),58 but the intermediates formed before the breakdown of the aromatic structure, which will then lead to discoloration of the dispersion, contain at least one of the two –SO3− groups of the initial OG structure. This substituent preserves the specific interaction with the TiO2 surface, whose negative charge due to the basic pH is partially neutralized by surfactant aggregates formed on the semiconductor surface. This interaction of dye and its derivative intermediates, assumed to be a real chemical bonding,44 prevails over the competitive association with the micellar surface, which otherwise would have removed them from the semiconductor and then reduced the degradation rate.
:1)57 leads to the formation of debromination products which transform one after the other until a probable complete debromination (Scheme 5). During these steps, the decay slows down more and more as less bromine atoms are bound to the aromatic system. In parallel, the tendency of the intermediates to interact with the cationic micellar surface increases as the aromatic system becomes more negatively charged (Fig. 3). As to OG, it is more oxidizable than EY (0.57 V vs. SCE in CH3CN:H2O 1:1),58 but the intermediates formed before the breakdown of the aromatic structure, which will then lead to discoloration of the dispersion, contain at least one of the two –SO3− groups of the initial OG structure. This substituent preserves the specific interaction with the TiO2 surface, whose negative charge due to the basic pH is partially neutralized by surfactant aggregates formed on the semiconductor surface. This interaction of dye and its derivative intermediates, assumed to be a real chemical bonding,44 prevails over the competitive association with the micellar surface, which otherwise would have removed them from the semiconductor and then reduced the degradation rate.
Conclusions
Photocatalytic degradation of dyes OG and EY was carried out under UV light over the TiO2 Degussa P25 surface. Use of cationic surfactants, pH change and additive addition have helped to elucidate the photodegradation mechanism by means of UV-Vis spectroscopic analysis. Generally, the degradation reaction was faster in a basic environment and by comparing the reactivity with and without surfactant at the same pH, only at alkaline pH the catalytic synergistic effect of the surfactant was remarkable. The peculiarity of OG was that the intermediate products evolved rapidly until the complete degradation of the dye. As for EY, the role of the surfactant was that to slow down the degradation of the intermediate products, thus allowing their accumulation.An interesting aspect of this study is that the involvement of surfactants, even when it does not favor the complete degradation of the dye, which would be a desirable result from an applicative point of view, is still useful to investigate more mechanistic aspects. The electronic distribution and the hydrophilic properties of the dyes, deduced by EPM data and ΔGsolv values, related to the amphiphilic nature of the surfactant and the charge of the semiconductor surface, supported the rationalization of the data obtained.
Author contributions
All the authors have contributed, according to their skills, to the realization of this work. A final draft of the manuscript has been approved by all authors.Conflicts of interest
There are no conflicts to declare.Acknowledgements
Thanks are given to the University of Perugia (Fondo Ricerca di Base 2019) for the financial support.Notes and references
- P. Pattnaik, G. S. Dangayach and A. K. Bhardwaj, Rev. Environ. Health, 2018, 33, 163–203 CAS.
- B. Lellis, C. Z. Fávaro-Polonio, J. A. Pamphile and J. C. Polonio, Biotechnol. Res. Innovation, 2019, 3, 275–290 CrossRef.
- S. Mani and R. N. Bharagava, Textile Industry Wastewater-Environmental and Health Hazards and Treatment Approaches, in Recent Advances in Environmental Management, ed. R. N. Bharagava, CRC Press, Boca Raton, 2018, ch. 3, pp. 47–69 Search PubMed.
- V. K. Gupta, S. Khamparia, I. Tyagi, D. Jaspal and A. Malviya, Global J. Environ. Sci. Manage., 2015, 1, 71–94 CAS.
- T. Adane, A. T. Adugna and E. Alemayehu, J. Chem., 2021, 1–14 CrossRef.
- P. K. Pandis, C. Kalogirou, E. Kanellou, C. Vaitsis, M. G. Savvidou, G. Sourkouni, A. A. Zorpas and C. Argirusis, Chem. Eng., 2022, 6, 8 CAS.
- P. V. Nidheesh, G. Divyapriya, F. E. Titchou and M. Hamdani, Sep. Purif. Technol., 2022, 293, 121115 CrossRef CAS.
- R. López and R. Gómezleading, J. Sol-Gel Sci. Technol., 2012, 61, 1–7 CrossRef.
- A. Ajmal, I. Majeed, R. N. Malik, H. Idriss and M. A. Nadeem, RSC Adv., 2014, 4, 37003 RSC.
- S. Ahmed, M. G. Rasul, W. N. Martens, R. Brown and M. A. Hashib, Water, Air, Soil Pollut., 2011, 215, 3–29 CrossRef CAS.
- D. Chen, Y. Cheng, N. Zhou, P. Chen, Y. Wang, K. Li, S. Huo, P. Cheng, P. Peng, R. Zhang, L. Wang, H. Liu, Y. Liu and R. Ruan, J. Cleaner Prod., 2020, 268, 121725 CrossRef CAS.
- E. G. L. Oliveira, J. J. Rodrigues Jr. and H. P. De Oliveira, Chem. Eng. J., 2011, 172, 96–101 CrossRef CAS.
- E. R. Macedo, L. De Boni, L. Misoguti, C. R. Mendon and H. P. De Oliveira, Colloids Surf., A, 2011, 392, 76–82 CrossRef CAS.
- M. S. Ikhwan, N. S. Nazeri, N. S. Natar, N. Imanin, A. Ghani, S. R. Hamzah, M. A. Rosli, M. A. M. Ishak, S. N. L. Mamauod, M. S. M. Azami and W. I. N. Wan Ismail, Sci. Lett., 2022, 16, 40–50 Search PubMed.
- E. Pino, C. Calderón and P. Castro, Photochem. Photobiol., 2021, 97, 40–46 CrossRef CAS PubMed.
- M. Bettoni, L. Brinchi, T. Del Giacco, R. Germani, S. Meniconi, C. Rol and G. V. Sebastiani, J. Photochem. Photobiol., A, 2012, 229, 53–59 CrossRef CAS.
- T. Del Giacco, R. Germani, F. Saracino and M. Stradiotto, J. Photochem. Photobiol., A, 2017, 332, 546–553 CrossRef CAS.
- P. Anastasio, T. Del Giacco, R. Germani, N. Spreti and M. Tiecco, RSC Adv., 2017, 7, 361–368 RSC.
- R. Germani, M. Bini, S. Fantacci, F. Simonetti, M. Tiecco, E. Vaioli and T. Del Giacco, J. Photochem. Photobiol., A, 2021, 418, 113342 CrossRef CAS.
- B. Walsh, B. Wu, S. C. Howard and V. S. J. Craig, Langmuir, 2014, 30, 2789–2798 CrossRef PubMed.
- R. Zhang and P. Somasundaran, Adv. Colloid. Interfac., 2006, 123–126, 213–229 CrossRef CAS.
- E. G. L. Oliveira, J. J. Rodrigues Jr and H. P. de Oliveira, Chem. Eng. J., 2011, 172, 96–101 CrossRef CAS.
- T. Ur Rashid, S. M. Fijul Kabir, M. Chandra Biswas and M. A. Rahman Bhuiyan, Ind. Eng. Chem. Res., 2020, 59, 9719–9745 CrossRef.
- E. R. Macedo, L. De Boni, L. Misoguti, C. R. Mendonc and H. P. de Oliveira, Colloids Surf., A, 2011, 392, 76–82 CrossRef CAS.
- H. Deng, Y. Cheng, J. Li, Q. Zhang, Y. Cao and X. Wang, Environ. Prog. Sustainable Energy, 2022, 41, e13843 CAS.
- R. Germani, P. P. Ponti, T. Romeo, G. Savelli, N. Spreti, G. Cerichelli, L. Luchetti, G. Mancini and C. A. Bunton, J. Phys. Org. Chem., 1989, 2, 553–558 CrossRef CAS.
- A. Di Crescenzo, R. Germani, E. Del Canto, S. Giordani, G. Savelli and A. Fontana, Eur. J. Org. Chem., 2011, 5641–5648 CrossRef CAS.
- T. Tachikawa, S. Tojo, M. Fujitsuka and T. Majima, Chem. – Eur. J., 2006, 12, 3124–3131 CrossRef CAS PubMed.
- R. G. Parr and W. Yang, Density-Functional Theory of Atoms and Molecules, Oxford University Press, Oxford, 1989 Search PubMed.
- M. J. Frisch, G. W. Trucks, H. B. Schlegel, G. E. Scuseria, M. A. Robb, J. R. Cheeseman, G. Scalmani, V. Barone, B. Mennucci, G. A. Petersson, H. Nakatsuji, M. Caricato, X. Li, H. P. Hratchian, A. F. Izmaylov, J. Bloino, G. Zheng, J. L. Sonnenberg, M. Hada, M. Ehara, K. Toyota, R. Fukuda, J. Hasegawa, M. Ishida, T. Nakajima, Y. Honda, O. Kitao, H. Nakai, T. Vreven, J. A. Montgomery Jr., J. E. Peralta, F. Ogliaro, M. Bearpark, J. J. Heyd, E. Brothers, K. N. Kudin, V. N. Staroverov, R. Kobayashi, J. Normand, K. Raghavachari, A. Rendell, J. C. Burant, S. S. Iyengar, J. Tomasi, M. Cossi, N. Rega, J. M. Millam, M. Klene, J. E. Knox, J. B. Cross, V. Bakken, C. Adamo, J. Jaramillo, R. Gomperts, R. E. Stratmann, O. Yazyev, A. J. Austin, R. Cammi, C. Pomelli, J. W. Ochterski, R. L. Martin, K. Morokuma, V. G. Zakrzewski, G. A. Voth, P. Salvador, J. J. Dannenberg, S. Dapprich, A. D. Daniels, Ö. Farkas, J. B. Foresman, J. V. Ortiz, J. Cioslowski and D. J. Fox, Gaussian 09, Revision D.01, Gaussian, Inc., Wallingford CT, 2009 Search PubMed.
- A. D. Becke, J. Chem. Phys., 1993, 98, 5648–5652 CrossRef CAS.
- C. Lee, W. Yang and R. G. Parr, Phys. Rev. B: Condens. Matter Mater. Phys., 1988, 37, 785–789 CrossRef CAS.
- B. Miehlich, A. Savin, H. Stoll and H. Preuss, Chem. Phys. Lett., 1989, 157, 200–206 CrossRef CAS.
- V. A. Rassolov, M. A. Ratner, J. A. Pople, P. C. Redfern and L. A. Curtiss, J. Comput. Chem., 2001, 22, 976–984 CrossRef CAS.
- V. A. Rassolov, J. A. Pople, M. A. Ratner and T. L. Windus, J. Chem. Phys., 1998, 109, 1223–1229 CrossRef CAS.
- J. Tomasi, B. Mennucci and R. Cammi, Chem. Rev., 2005, 105, 2999–3094 CrossRef CAS PubMed.
- R. Improta, G. Scalmani, M. J. Frisch and V. Barone, J. Chem. Phys., 2007, 127, 074504 CrossRef PubMed.
- R. Improta, V. Barone, G. Scalamani and M. J. Frisch, J. Chem. Phys., 2006, 125, 054103 CrossRef.
- S.-J. Zhang, H.-Q. Yu and Y. Zhao, Water Res., 2005, 39, 839–846 CrossRef CAS.
- W. R. Haag and T. Mill, Environ. Toxicol. Chem., 1987, 6, 359–369 CrossRef CAS.
- R. W. Sabnis, Handbook of Biological Dyes and Stains: Synthesis and Industrial Applications, 2010, vol. 352 Search PubMed.
- L. Brinchi, R. Germani, G. Savelli and L. Marte, J. Colloid Interface Sci., 2003, 262, 290–293 CrossRef CAS.
- H. Li and C. P. Tripp, Langmuir, 2002, 18, 9441–9446 CrossRef CAS.
- E. Kordouli, K. Bourikas, A. Lycourghiotis and C. Kordulis, Catal. Today, 2015, 252, 128–135 CrossRef CAS.
- K. Bourikas, J. Vakros, C. Kordulis and A. Lycourghiotis, J. Phys. Chem. B, 2003, 107, 9441–9451 CrossRef CAS.
- U. Akpan and B. Hameed, J. Hazard. Mater., 2009, 170, 520–529 CrossRef CAS.
- Y. Deng and R. Zhao, Curr. Pollut. Rep., 2015, 1, 167–176 CrossRef CAS.
- M. A. Meetani, M. A. Rauf, S. Hisaindee, A. Khaleel, A. AlZamly and A. Ahmad, RSC Adv., 2011, 1, 490–497 RSC.
- A. Alvarez-Martin, S. Trashin, M. Cuykx, A. Covaci, K. De Wael and K. Janssens, Dyes Pigm., 2017, 145, 376–384 CrossRef CAS.
- V. R. Batistela, D. S. Pellosi, F. D. Souza, W. F. Costa, S. M. Oliveira Santin, V. R. Souza, W. Caetano, H. P. M. Oliveira, I. S. Scarminio and N. Hioka, Spectrochim. Acta, Part A, 2011, 81, 458–465 CrossRef.
- M. Rashidi-Alavijeh, S. Javadian, H. Gharibi, M. Moradi, A. R. Tehrani-Bagha and A. Asadzadeh Shahira, Colloids Surf., A, 2011, 380, 119–127 CrossRef CAS.
- X.-F. Zhang, J. Zhang and L. Liu, J. Fluoresc., 2014, 24, 819–826 CrossRef CAS PubMed.
- S. G. Shelar, V. K. Mahajan, S. P. Patil and G. H. Sonawane, J. Mater. Environ. Sci., 2019, 10, 431–441 CAS.
- R. Vinu, S. U. Akki and G. Madras, J. Hazard. Mater., 2010, 176, 765–773 CrossRef CAS PubMed.
- J. T. Schneider, D. S. Firak, R. R. Ribeiro and P. Peralta-Zamora, Phys. Chem. Chem. Phys., 2020, 22, 15723–15733 RSC.
- B. W. J. Pirok, G. Moro, N. Meekel, S. V. J. Berbers, P. J. Schoenmakers and M. R. van Bommel, J. Cult. Herit., 2019, 38, 29–36 CrossRef.
- V. Srivastava and P. P. Singh, RSC Adv., 2017, 7, 31377–31392 RSC.
- Z. Liu, H. Zhai, Z. Chen, Q. Zhou, Z. Liang and Z. Su, Electrochim. Acta, 2014, 36, 370–376 Search PubMed.
Footnote |
| † Electronic supplementary information (ESI) available. See DOI: https://doi.org/10.1039/d2nj04715b |
| This journal is © The Royal Society of Chemistry and the Centre National de la Recherche Scientifique 2023 |