
Magneto-plasmonic nanostructures for SERS: magnetite decorated by silver and gold nanoparticles†
Gytaute
Sirgedaite
a,
Martynas
Talaikis
a,
Gediminas
Niaura
a and
Lina
Mikoliunaite
 *ab
*ab
aDepartment of Organic Chemistry, Center for Physical Sciences and Technology (FTMC), Sauletekio av. 3, LT-10257, Vilnius, Lithuania
bDepartment of Physical Chemistry, Faculty of Chemistry and Geosciences, Vilnius University, Naugarduko st. 24, LT-03225, Vilnius, Lithuania. E-mail: lina.mikoliunaite@chf.vu.lt
First published on 22nd November 2022
Abstract
Surface enhanced Raman spectroscopy (SERS) is a powerful tool for the investigation of low concentration analytes. To improve this method, magnetic nanoparticles were introduced to the system. Magnetic nanoparticles together with plasmonic silver or gold nanoparticles or shells not only enhance the SERS signal but also facilitate to focus the sample and direct it to the place of need. In this work, different chemicals were used for the modification of magnetite in order to improve the attachment of plasmonic nanoparticles on the surface of magnetic nanoparticles. In addition to this, the modification using PEI was chosen for a further decoration procedure with different ratios of AgNPs and AuNPs in various sequences. Composites having silver, gold, and magnetite nanoparticles were obtained and the best modification conditions for optimal SERS signal were evaluated by employing multiwavelength excitation. It was noticed that the order of the decoration makes a difference in the obtained signal enhancement. These composites can improve the adsorption and sensing of different analytes as both silver and gold surfaces are accessible to the solution.
1. Introduction
Magneto-plasmonic nanoparticles are quite new and prominent materials in different fields of science. They were applied for catalysis,1,2 antibacterial purposes,3–6 bioseparation,7 SERS imaging8,9etc.10–12 These composites are usually made from a magnetic core and plasmonic shell, however, the reversed structure is also available.13 The magnetic core is usually made from iron oxide, more specifically, magnetite (Fe3O4),1,10,14–18 but pure iron,19,20 cobalt5 or other materials3 could be used. The plasmonic part is typically made of gold or silver. It can be a solid shell, smooth4,11,19,21,22 or spiked,7 or composed of small particles1–3,20,23 that later could be grown into a shell.18,24 Ag/Au nanoalloys were also used to overlay magnetite nanoparticles.25,26 By changing the molar ratio of initial silver nitrate and HAuCl4 solutions, different plasmonic properties were obtained. These composites were used for thiophenol,25 melamine,27 or 1-naphthalenethiol28 detection.These structures have several advantages in comparison to usual gold or silver nanoparticles: using a magnetic field, the particles could be directed to any required place; if the solution of analyte is extremely low in concentration, the magneto-plasmonic structures could be used in the solution to catch the analyte molecules (using silver or gold part), and then, by applying an external magnetic field, the nanoparticles could be concentrated to one spot.
However, one of the main challenges in composing these structures is to obtain a core/shell structure instead of separate plasmonic and magnetite nanoparticles stuck together accidentally. To overcome this challenge, a complex organic synthesis process could be used,29 additional materials could be supplemented in the synthesis of magnetite9,30 or some modifications of the already synthesized magnetic core can be made. These changes are usually made using polymers,3,22 the most popular of which is polyethyleneimine (PEI).6,31 Thus, hybrid antibacterial magneto-plasmonic nanoparticles were obtained by covering the Fe3O4 core with a uniform 2 nm thick PEI shell through a self-assembly under sonication and subsequent deposition of Au@Ag nanoparticles of 3–5 nm diameter.6 In addition to this, silanes10,16,24,26,32 or SiO24,18 could be used.
In this work, magnetic nanoparticles were coated using various chemical materials during synthesis or immediately after the synthesis. During synthesis, some monomers: ethylene glycol, aniline, pyrrole, and polymer: polyethyleneimine were used while after synthesis, polymers: polyethyleneimine, polyvinyl alcohol, polyethylene glycol, and silanes: (3-aminopropyl) triethoxysilane, N-(3-(trimethoxysilyl) propyl) ethylenediamine, 3-(mercapto propyl) trimethoxysilane, and tetramethoxysilane were used. All these samples were decorated using negatively charged silver or gold nanoparticles and their coverage was evaluated using XRD, UV-Vis, and Raman spectroscopy methods. For further investigation, magnetite covered with PEI after synthesis was chosen. The particles were decorated with different concentrations of silver and gold colloids in different sequences as well as a mix of them. The obtained multiwavelength SERS results showed that the order of modification is important in the adsorption of analyte and the intensity of the SERS signal.
2. Experimental
2.1. Materials
FeSO4·7H2O, ethylene glycol (EG), and polyethylene glycol (PEG) (molar mass 20![[thin space (1/6-em)]](https://www.rsc.org/images/entities/char_2009.gif) 000 g mol−1) were obtained from Carl Roth, Germany. KNO3 and H2SO4 (96%) were from Reachem, Slovakia, while NaOH and Na3C6H5O7 (sodium citrate) were from Scharlau, Spain. AgNO3 and reducing agent NaBH4 were purchased from Merck, Germany. HAuCl4·3H2O and (3-mercaptopropyl) trimethoxysilane (MPTMS) were bought from Alfa Aesar, USA and aniline (AN) from Fluka, Germany. From Sigma Aldrich (USA), pyrrole, polyethylene imine (PEI) (branched, average MW by LS ∼ 25000), and N-[3-(trimethoxysilyl)propyl]-ethylenediamine (TMSPA) were obtained. Polyvinyl alcohol (PVA) (hydrolyzed, molar mass 50000–85000 g mol−1), 3-aminopropyltriethoxysilane (APTES), and tetramethoxysilane (TMOS) were bought from Acros Organics, Belgium, and 4-mercaptobenzoic acid (MBA) was from Thermo Scientific, UK. For all the experiments, ultrapure water (resistance > 18 MΩ) was used.
000 g mol−1) were obtained from Carl Roth, Germany. KNO3 and H2SO4 (96%) were from Reachem, Slovakia, while NaOH and Na3C6H5O7 (sodium citrate) were from Scharlau, Spain. AgNO3 and reducing agent NaBH4 were purchased from Merck, Germany. HAuCl4·3H2O and (3-mercaptopropyl) trimethoxysilane (MPTMS) were bought from Alfa Aesar, USA and aniline (AN) from Fluka, Germany. From Sigma Aldrich (USA), pyrrole, polyethylene imine (PEI) (branched, average MW by LS ∼ 25000), and N-[3-(trimethoxysilyl)propyl]-ethylenediamine (TMSPA) were obtained. Polyvinyl alcohol (PVA) (hydrolyzed, molar mass 50000–85000 g mol−1), 3-aminopropyltriethoxysilane (APTES), and tetramethoxysilane (TMOS) were bought from Acros Organics, Belgium, and 4-mercaptobenzoic acid (MBA) was from Thermo Scientific, UK. For all the experiments, ultrapure water (resistance > 18 MΩ) was used.
2.2. Magnetite synthesis
Magnetic Fe3O4 nanoparticle synthesis procedure was adopted from the precipitation method suggested by Verges et al.33 For 2 h, argon gas was bubbled through two separate solutions independently: (A) 180 mL of water containing 0.07 M NaOH and 0.1 M KNO3, and (B) 20 mL of 0.074 M FeSO4 × 7H2O dissolved in 0.035 M H2SO4. If modification of magnetite was applied during the synthesis, solutions A or B were supplemented with additional chemicals. After 2 h, solution B was added dropwise to the basic solution A in 20 min (1 mL min−1 rate) under mechanical stirring. When all the B solution was dripped into the A solution, argon was allowed to pass for another 5 min. Then, the flask was placed in an oil bath, heated to 90 °C, and left for 20 h under mechanical stirring. Subsequently, the solution was cooled to room temperature in an ice bath. Magnetic particles were collected using a strong magnet and washed 3 times with ultra-pure water.2.3. Synthesis of gold and silver nanoparticles
2.4. Modification of magnetite
To improve adsorption of plasmonic nanoparticles on the surface of magnetic nanoparticles, the magnetite surface was modified using monomers, polymers, or silanes. Modifications were obtained in two ways: during the synthesis or after the synthesis.During the synthesis. While preparing solution A (see Section 2.2), 33 mL of 8 mg mL−1 of PEI solution was introduced (the final volume of the mixture was left the same, and thus 147 mL of ultrapure water was used). Synthesis continued as usual.
After the synthesis. A modification procedure was applied from Wang et al. work.6 20 mg of synthesized magnetic nanoparticles were dispersed in 10 mL of water and ultrasonicated for 30 min. Later, to the nanoparticle suspension, 2 mL of 8 mg mL−1 concentration of PEG, PVA, or PEI aqueous solutions were introduced. The obtained suspension was ultrasonicated for 3 h; Later, the modified magnetic nanoparticles were collected using a magnet and washed 3 times with ultrapure water, maintaining the original volume of the suspension.
2.5. Decoration of magnetite with silver and gold nanoparticles
The decoration of modified and non-modified magnetite with silver and gold nanoparticles was achieved by mixing 2.5 mL of plasmonic nanoparticle solution, 2.5 mL of water, and 0.4 mL of the prepared magnetite solution. The mixture was sonicated for 20 min. The resulting structures were washed twice with ultrapure water, maintaining the original concentration.Then, different concentrations of silver or gold were used, and the ratio between water and colloid was changed. For example, the table (Table 1) with silver nanoparticles is presented; however, the same is valid for gold. In all the text, subscript means the percentage of colloid used in the modification procedure.
| Abbreviation | Volume of silver colloid, mL | Volume of water, mL |
|---|---|---|
| AgNPs100 | 5 | 0 |
| AgNPs75 | 3.75 | 1.25 |
| AgNPs50 | 2.5 | 2.5 |
| AgNPs25 | 1.75 | 3.25 |
2.6. Methods used for characterization of composite
Silver and gold nanoparticles were characterized using scanning electron microscopy (SEM) (SU70, Hitachi, Tokyo, Japan). For visualization of decorated nanoparticles, a transmission electron microscope (TEM) (Tecnai F20 X-TWIN, FEI Company (USA) with an accelerating voltage of 200 kV was used. A benchtop X-ray diffraction spectrometer (MiniFlex, Rigaku, Tokyo, Japan), which is designed to determine the crystallographic structure of powders, was used for X-ray analysis. The diffractometer is based on BraggBrentano (θ/2θ) geometry. The X-ray source is Cu-Kα, λ = 1.5419 Å anode, the Kβ filter is Ni and the detector – a semiconductor. The X-ray diffractometer measurements were carried out in the diffraction angle range 10°–80°. UV-Vis spectrophotometer (Cary 5000, Agilent, Santa Clara, CA, USA) was used for absorption measurements. Microwave-assisted synthesis of gold nanoparticles was carried out with a Milestone FlexiWAVE (Italy) microwave system, which allows setting the required power, temperature, and time. Zeta potentials of modified magnetite, gold, and silver nanoparticles were measured by dynamic light scattering spectroscopy (DLS) with a Malvern Zetasizer Nano ZS (UK). DLS is suitable for nanoparticle characterization and analysis of colloidal dispersions. Magnetic measurements were performed using a pulsed magnetic field with a duration of about 4 ms and a field strength up to 0.5 T (the measurement setup is presented in our previous work35).SERS spectra of magnetite modified using different molecules and decorated with silver nanoparticles, were obtained using SNOM (Alpha300R, WiTec, ULM, Germany), equipped with a 532 nm laser source, 600 lines per mm grating, 45 μW power, and a 50×/0.8 NA objective. The signal acquisition time was 100 s.
The multiwavelength Raman microscopy characterization of the nanoparticles was accomplished by using an inVia Raman spectrometer (Renishaw, Wotton-under Edge, UK) equipped with a thermoelectrically cooled (−70 °C) CCD camera. Spectra were excited using 442 nm (with 2400 lines per mm grating and laser power of 0.53 mW), 532 nm (1800 lines per mm; 0.22 mW), 633 nm (1800 lines per mm; 0.05 mW), and 785 nm (1200 lines per mm; 0.09 mW), and 830 nm (830 lines per mm; 0.17 mW) laser radiation sources that were focused on the sample using a 50×/0.75 NA objective lens. The acquisition time was 30 s, which was obtained by averaging spectra from 30 different locations of the same sample of 1 s integrations. SERS intensity was quantified by dividing SERS intensity by Raman intensity (ISERS/IRaman) of the dominant 1582 cm−1 mode from the reporter molecule 4-MBA. Raman spectra were measured in 4-MBA (0.1 M) ethanol solution, and SERS spectra were measured for nanoparticles adsorbed with 4-MBA from the 2 mM aqueous solution. The intensities were additionally scaled to resolve the differences in acquisition times and laser powers and then normalized to 1. We assume the ratio of probed molecules, NRaman/NSERS, to be wavelength independent.
3. Results and discussion
Firstly, the non-modified magnetite nanoparticles were tested to see if any plasmonic nanoparticles could attach to the surface. However, neither XRD (Fig. 1A) nor UV-Vis spectrum (Fig. 1B) showed any sign of plasmonic structures. Raman measurements with 532 nm laser light (for Fe3O4@AgNPs50) and 633 nm laser light (for Fe3O4@AuNPs50) were also conducted (data not shown), choosing 4-MBA molecule as analyte; however, no SERS signal was registered as well.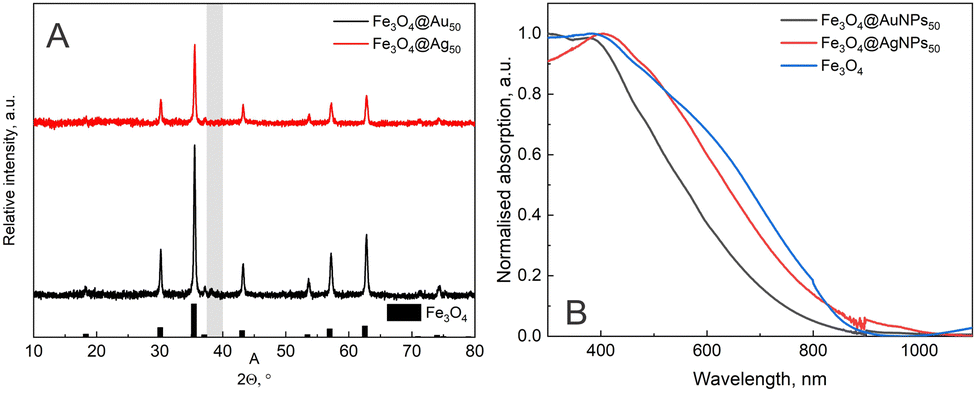 | ||
| Fig. 1 Nonmodified magnetite nanoparticles decorated with AgNPs or AuNPs; (A) XRD spectrum (grey column indicates the place where the main AgNPs or AuNPs X-ray peaks should be visible; the COD (Crystallography Open Database) file, No. 9007644 shows cubic Fe3O4 phase positions) and (B) UV-Vis absorption spectra (all three spectra were normalized to 1) are presented. | ||
The modification of magnetite nanoparticles was carried out during the synthesis or immediately after obtaining Fe3O4 crystals. For the modification during synthesis, three monomers, aniline (AN), pyrrole (PY), and ethylene glycol (EG), were chosen together with one polymer – polyethylene imine (PEI). After the synthesis, three polymers, polyethylene glycol (PEG), polyvinyl alcohol (PVA), and PEI, were used as well as four different silanes:
• (3-aminopropyl)triethoxysilane (APTES)
• N-(3-(trimethoxysilyl)propyl)ethylenediamine (TMSPA)
• 3-(mercapto propyl)trimethoxysilane (MPTMS)
• Tetramethoxysilane (TMOS).
These materials were based on the works of other scientists. Xuan et al.2 used aniline for magnetite modification. We took two monomers: aniline and pyrrole. In addition to this, ethylene glycol was chosen for comparison with its polymer – PEG. All the used polymers, PVA, PEG, and PEI, are hydrophilic. For modifications of magnetic nanoparticles, in the literature, PEI is usually used.9,30,31
Finally, another type of material used for modification was silanes.16,24,32 Four different chemicals were chosen, and the chemical formula of each is presented in ESI† Fig. S1. The main difference was functional groups. TMOS has all the same –CH3 groups, while MPTMS has –SH, APTES and TMSPA have –NH2; only TMSPA has an additional –NH– in the middle of the chain. –NH2 group is known to have an affinity to silver as well as for gold, while the thiol group should make mainly gold-sulphur bonds. TMOS was used to check if silanes have any influence on nanoparticle adsorption due to other reasons, such as electrostatic. All the tested modifications are listed in Table 2. To see how the modification procedure changes the charge of the particles, zeta potential was measured after each modification and presented in Table 2, last column. Additionally, zeta potentials of bare magnetite, silver, and gold nanoparticles are presented. As could be seen from the data, as-synthesized magnetite, silver, and gold nanoparticles have negative zeta potentials, −25.0, −31.0, −31.0 mV, respectively. This means that in solution, they repel each other and do not form a composite (as was noticed in Fig. 1). The addition of monomers (AN, PY, and EG) to the magnetite synthesis solution barely changes the potential, and it stays negative; thus, due to electrostatics, monomer-modified magnetite should also repel plasmonic nanoparticles. The same is with polymers PVA and PEG, used after the synthesis. Only PEI, as a positive charge holding polymer, changes the magnetite surface charge to positive. However, there is a difference if PEI is used during the synthesis or after. PEI added to the initial solution changes magnetite zeta potential by 34.5 mV (reaching +9.5 mV), while if added after the synthesis, the polymer makes a 58 mV change to the positive direction (reaching +33.0 mV). All silanes, except TMSPA, reduce zeta potential, but the final value is still negative, while after the addition of TMSPA on magnetite, zeta potential changes to positive +3 mV. To sum up all the obtained results, due to zeta potential change and electrostatic interaction, only PEI and TMSPA modified magnetite nanoparticles should attract negative plasmonic nanoparticles; however, the attraction could be induced by other reasons, thus UV-Vis and XRD measurements were conducted for all the modified nanoparticles decorated either with gold or silver.
| Abbreviation of the sample | Full name of modification material | Abbreviation of modification material | Moment of modification | Zeta potential of nanoparticles, mV |
|---|---|---|---|---|
| Fe3O4 | — | — | — | −25.0 ± 0.3 |
| AuNP | — | — | — | −31.0 ± 0.5 |
| AgNP | — | — | — | −31.0 ± 3.4 |
| Fe3O4@AN | Aniline | AN | During synthesis | −21.1 ± 0.3 |
| Fe3O4@PY | Pyrrole | PY | During synthesis | −22.5 ± 0.3 |
| Fe3O4@EG | Ethylene glycol | EG | During synthesis | −20.9 ± 0.2 |
| Fe3O4@PEID | Polyethylene imine | PEI | During synthesis | +9.5 ± 0.4 |
| Fe3O4@PEG | Polyethylene glycol | PEG | After synthesis | −20.2 ± 0.2 |
| Fe3O4@PEIA | Polyethylene imine | PEI | After synthesis | +33.0 ± 0.3 |
| Fe3O4@PVA | Polyvinyl alcohol | PVA | After synthesis | −18. 0 ± 0.3 |
| Fe3O4@APTES | (3-Aminopropyl)triethoxysilane | APTES | After synthesis | −15.0 ± 0.3 |
| Fe3O4@TMSPA | N-(3-Trimethoxysilyl)propyl)ethylenediamine | TMSPA | After synthesis | +3.0 ± 0.9 |
| Fe3O4@MPTMS | 3-(Mercapto propyl)trimethoxysilane | MPTMS | After synthesis | −14.4 ± 0.8 |
| Fe3O4@TMOS | Tetramethoxysilane | TMOS | After synthesis | −26.1 ± 0.2 |
The UV-Vis spectra of initial materials, magnetite, AgNPs, and AuNPs, measured separately are presented in Fig. 2A. As could be seen, for magnetite nanoparticles, a gradual increase in absorption to the shorter wavelengths is seen. Also, a high scattering effect is present as all spectra are shifted upwards. Silver and gold nanoparticles have intensive and symmetrical peaks at 390 nm and 527 nm, respectively. According to other scientists, this represents 13 and 40 nm size nanoparticles.36,37 The size of nanoparticles was also calculated from SEM images (Fig. 2B and C) using the ImageJ program. The determined size was 13 ± 1 nm and 41 ± 3 nm for AgNPs and AuNPs, respectively.
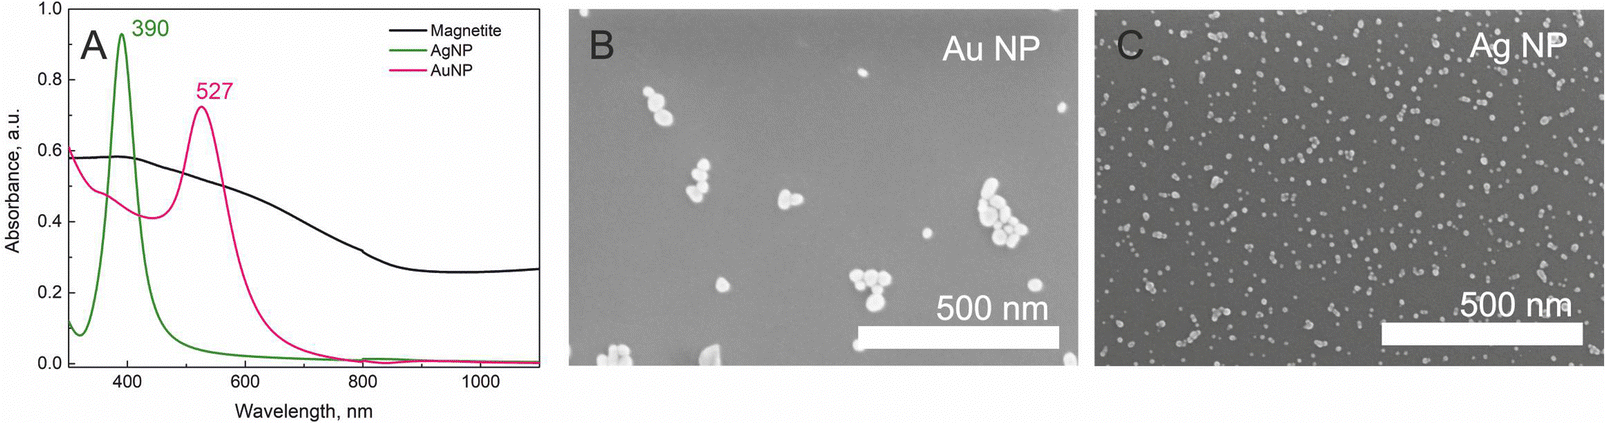 | ||
| Fig. 2 (A) UV-Vis absorption spectra of magnetite (black), silver (green) and gold (pink) nanoparticles. SEM images of (B) gold and (C) silver NPs. Scale bar of both images is the same – 500 nm. | ||
After the modification procedure with monomers, polymers, and silanes, all the samples were decorated using silver or gold nanoparticles. For all the samples, XRD, UV-Vis, and SERS spectra were recorded, and obtained results are presented in ESI† (Fig. S2 – XRD spectra, Fig. S3 (ESI†) – UV-Vis absorption spectra, Fig. S4 (ESI†) – SERS). The modification success was evaluated if XRD peaks of silver or gold and plasmonic absorption (UV-Vis measurements) are visible. The summarized results are presented in Table 3.
| XRD | UV-Vis | SERS | |
|---|---|---|---|
| Fe3O4@Ag | − | − | − |
| Fe3O4@Au | − | − | − |
| Fe3O4@AN@Ag | − | − | − |
| Fe3O4@AN@Au | − | − | + |
| Fe3O4@PY@Ag | − | − | + |
| Fe3O4@PY@Au | − | − | + |
| Fe3O4@EG@Ag | − | − | Very weak |
| Fe3O4@EG@Au | − | − | − |
| Fe3O4@PEID@Ag | + | + | + |
| Fe3O4@PEID@Au | + | + | + |
| Fe3O4@PEG@Ag | − | − | + |
| Fe3O4@PEG@Au | − | − | + |
| Fe3O4@PEIA@Ag | + | + | + |
| Fe3O4@PEIA@Au | + | + | + |
| Fe3O4@PVA@Ag | − | − | − |
| Fe3O4@PVA@Au | + | + | + |
| Fe3O4@APTES@Ag | + | + | + |
| Fe3O4@APTES@Au | + | + | + |
| Fe3O4@TMSPA@Ag | + | + | + |
| Fe3O4@TMSPA@Au | + | + | + |
| Fe3O4@MPTMS@Ag | − | − | + |
| Fe3O4@MPTMS@Au | + | + | + |
| Fe3O4@TMOS@Ag | − | − | Very weak |
| Fe3O4@TMOS@Au | − | − | − |
The information obtained from XRD agree the results measured with UV-Vis spectrometer. The plasmonic nanoparticles attached to the surface of magnetite when PEI was used for modification during or after the synthesis as well as silanes: APTES and TMSPA. However, MPTMS showed a signal only with AuNPs, as –SH has a higher affinity to gold, the signal was also registered using PVA and modification with gold NPs. Nonetheless, 4-MBA SERS spectrum was registered for more samples. In addition to PEI, APTES, and TMSPA modification, 4-MBA SERS spectrum was registered for magnetite samples modified with pyrrole and PEG decorated with both silver and gold NPs. Separately, gold decorated magnetite, modified with AN, provided a signal, while for AgNPs decoration, magnetite modified with EG (weak), TMOS (weak), and MPTMS showed the signal. Thus, although XRD and UV-Vis techniques are not able to register the signals, a small amount of nanoparticles possibly attaches to the surface of PY, PEG, TMOS (for AgNPs), AN (for AuNPs), EG (for AgNPs), and MPTMS (for AgNPs) modified magnetite and produces noticeable SERS signal.
For further investigations, only the sample modified with PEI after the synthesis was chosen, as it showed one of the highest SERS intensities. The unprocessed SERS data are presented in ESI† Fig. S5. The magneto-plasmonic nanoparticles, which have PEI added during the magnetite synthesis (Fe3O4@PEID), although showed satisfactory SERS intensity, were difficult to manage—they adhered plastic labware. It was difficult to control the number of NPs; thus, this particular nanoparticle type was eliminated from further investigation. As only the magnetite with PEI added after the synthesis will be analyzed further, we simplify the abbreviation to Fe3O4@PEI.
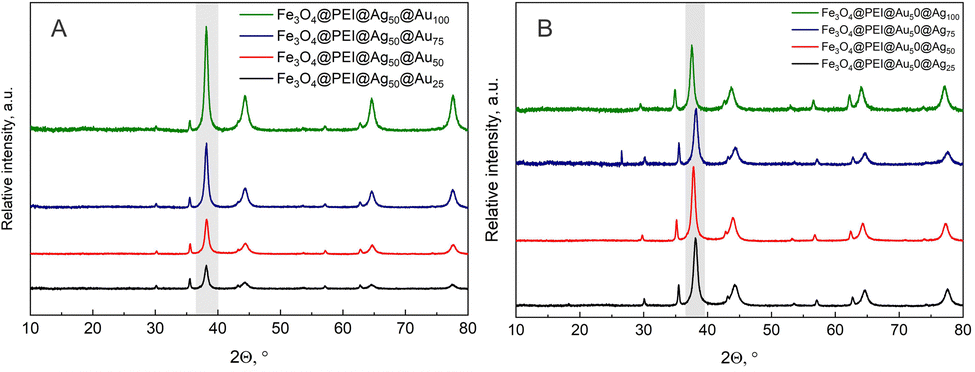
Firstly, different concentrations of plasmonic nanoparticles were evaluated. The modification procedure was conducted using pure colloid solution (100%) or diluted with ultrapure water to obtain 75%, 50%, or 25% solutions. The results with gold or silver nanoparticles are presented in Fig. 3. From the XRD data, the gradual increase of plasmonic nanoparticle peak for both samples matches the increasing nanoparticle concentration in the modification solution. This means that more nanoparticles adsorb to the surface of the magnetite each time. However, the intensity of the plasmonic nanoparticle peaks in comparison to magnetite differs. During the decoration procedure, the amount of magnetite maintained the same, thus all XRD spectra were normalized to the highest (35.4°) Fe3O4 peak. The intensity of AgNPs peaks was always lower in comparison to magnetite, while the AuNPs peak was always higher. This might be due to several reasons; firstly, the gold could adsorb more readily to the surface of magnetite in comparison to AgNPs; the initial concentration of gold colloid was higher, and finally, the size of gold nanoparticles was larger.
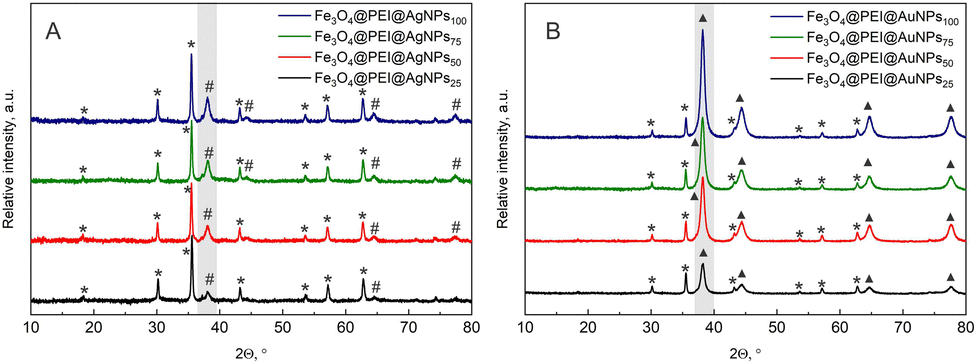 | ||
| Fig. 3 XRD spectra of PEI modified magnetite decorated using different concentrations of (A) silver or (B) gold nanoparticles. For better comparison, all spectra were normalized to the highest magnetite peak (35.4°), assuming that the amount of magnetite is stable. Grey column indicates the place where the main AgNPs or AuNPs X-ray peaks are visible. The characteristic peaks of Fe3O4 are marked with “*”, the peaks of Ag and Au “#” and “▲”, respectively. | ||
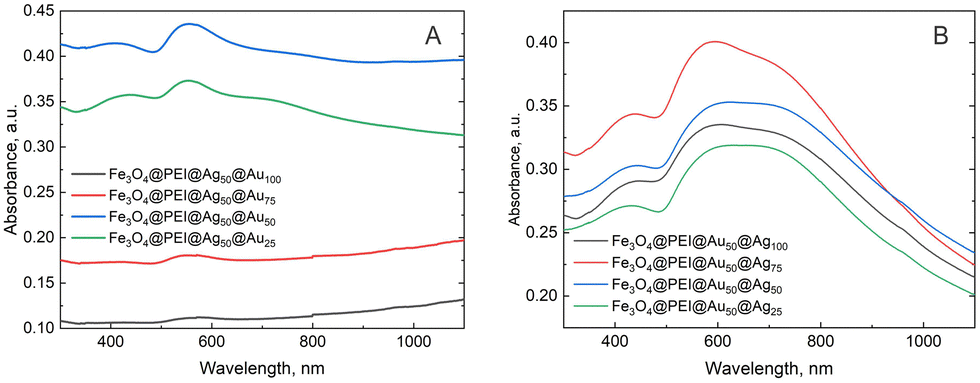
UV-Vis spectra do not show very obvious differences (Fig. 4). With silver NPs, the absorption curve form remains similar for all the samples, and only the intensity for Fe3O4@PEI@AgNPs25 is smaller. But this might be due to the lower concentration of the sample during UV-Vis measurements. The absorption band is composed of two peaks at 440 and 650 nm. The first one is related to the absorption of individual silver nanoparticles, while the second one is related to the plasmonic nanoparticles in close proximity to each other at the magnetite surface. This interaction was described in our previous and other research works.38,39 Meanwhile, the increase in the concentration of gold nanoparticles resulted in higher intensity of absorption for two visible plasmonic peaks at 550 nm and 720 nm. The explanation for the appearance of these two peaks is the same as for the AgNPs.
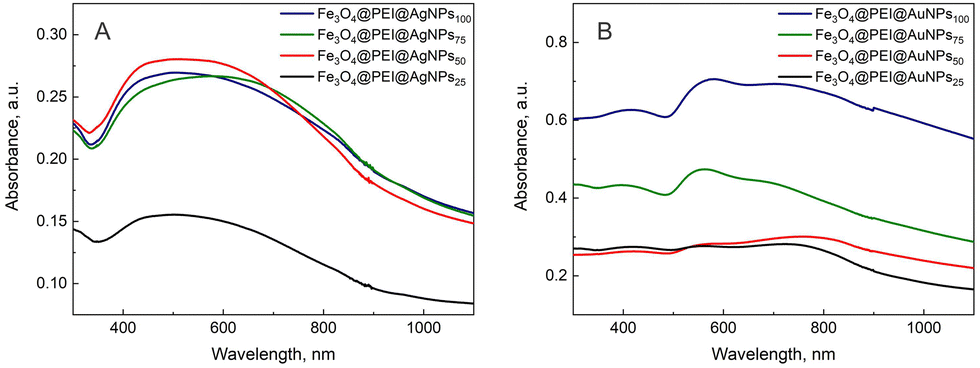 | ||
| Fig. 4 UV-Vis absorption spectra of PEI modified magnetite decorated using different concentration of (A) silver or (B) gold nanoparticles. | ||
The next part of this work was to decorate magnetite with two different sorts of nanoparticles. For further investigation, samples modified with 50% AgNPs or AuNPs solutions were chosen to leave an additional place for the other nanoparticles to adhere. Three different methodologies were tested for the decoration: (i) magnetite was capped with silver and then with gold NPs, (ii) magnetite was capped with gold and then with silver NPs and (iii) magnetite was capped with a mixture of both silver and gold NPs. We choose to vary the concentration of the second plasmonic NPs solution. All the prepared samples and numeration are presented in the ESI,† Table S1. For these samples, again XRD and UV-Vis measurements were conducted. In Fig. 5, the XRD spectra of twice decorated nanoparticles are presented. For both sorts of samples, the Au and/or Ag XRD peak dominates over the magnetite peak; however, it is impossible to qualitatively or quantitatively decide which type of plasmon nanoparticles dominate. Their XRD peak positions almost match each other; thus, this method is not suitable for the evaluation.
 | ||
| Fig. 5 X-ray spectra of PEI modified magnetite twice decorated with plasmonic nanoparticles: (A) firstly with silver and then different concentrations of gold, or (B) firstly with gold and then different concentrations of silver. Grey column indicates the place where the main AgNPs or AuNPs X-ray peaks are visible. | ||
UV-Vis spectra (Fig. 6) of both types of modification showed a similar shape of curves with a weak peak at 400 nm (AgNPs), an intensive peak at 550 nm (AuNPs), and a shoulder at 720 nm (plasmonic interactions). However, two samples modified with the highest concentrations of AuNPs (Fe3O4@PEI@AgNPs50@AuNPs75 and Fe3O4@PEI@AgNPs50@AuNPs100) precipitated very fast, and even with ultrasound, it was impossible to separate nanoparticles. Thus, these samples showed very low intensity in absorption spectra and were eliminated from the following SERS measurements.
 | ||
| Fig. 6 UV-Vis absorption spectra of PEI covered magnetite decorated with silver and gold nanoparticles: (A) firstly, constant AgNPs amount was used and then AuNPs concentration varied; (B) firstly, constant AuNPs amount was used and then AgNPs concentration changed. The subscript next to the plasmonic nanoparticles means the percentage of colloid solution used in the modification procedure. | ||
Fig. S6 (ESI†) compares Fe3O4@PEI@AgNPs50@AuNPs50, Fe3O4@PEI@AuNPs50@AgNPs50, and the nanoparticles where magnetite was capped with a mixture of Ag and Au NPs. These latter nanoparticles showed quite high XRD intensity of Au and/or Ag peak, and the UV-Vis spectra were similar to the other two samples.
3.1. Magnetic properties of composite nanoparticles
Magnetic properties of the decorated samples were retained after the modification, so it was possible to collect the nanoparticles using an external magnet, and the magnetization measurements were performed using a pulsed magnetic field. The obtained results in Fig. 7 showed that the shapes and coercive field for all the samples are similar and around 10 mT. Nonetheless, magnetization saturation decreases if the sample is decorated using plasmonic nanoparticles. It is caused mainly because Ag (or Au as well) is a diamagnetic material, and changing the concentration of silver only leads to a reduction in the relative mass of Fe3O4 to the total mass of the decorated particles. Similar characteristics were obtained in other studies, for example, CoNPs5 and FeNPs3 coated with AgNPs as well as FeNPs coated with AuNPs.9,31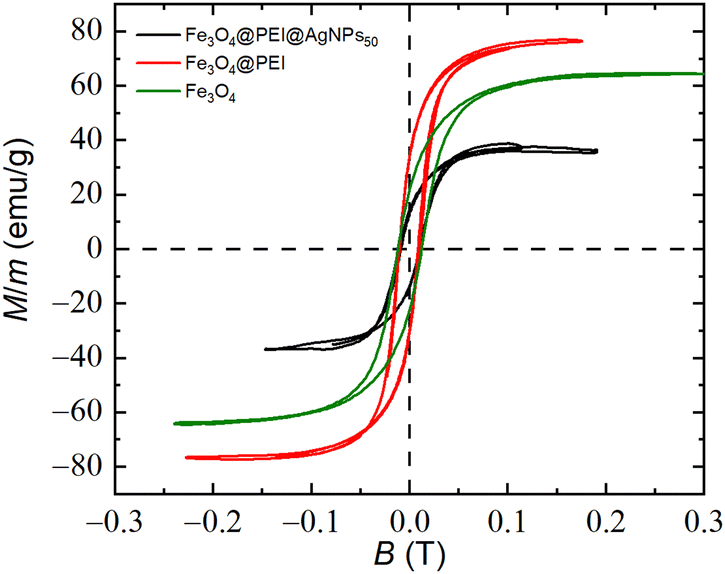 | ||
| Fig. 7 Hysteresis loop of the magnetite (green), magnetite modified with PEI (red) and magnetite decorated with silver nanoparticles: Fe3O4@PEI@AgNPs50 (black). | ||
Due to the maintained magnetic properties of the sample, over time, they tend to stick together and precipitate. However, this process is not irreversible. If the bottle is heavily shaken or added to the ultrasonic bath for a few seconds, the nanoparticles are separated and could be further used without any alteration.
3.2. Multiwavelength Raman characterization of composite nanoparticles
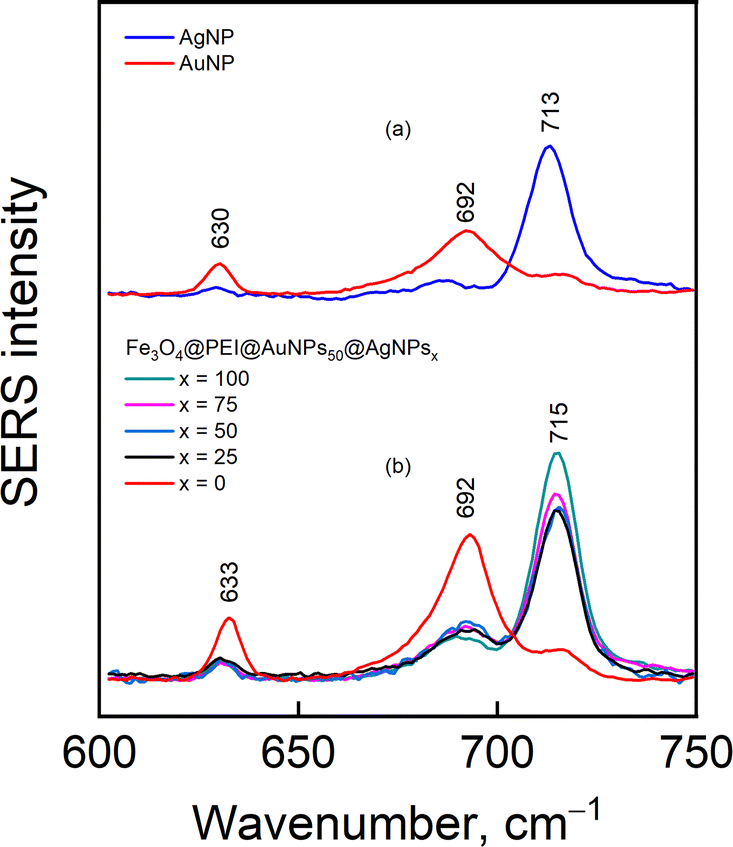
The nanoparticle solutions were dried under a strong magnetic field and adsorbed with 4-MBA reporter molecule from 2 mM aqueous solution. It was previously shown that the magnetic properties of nanoparticles contribute to a higher enhancement factor and narrower distribution of SERS intensities within a single sample and among the samples from different batches.39Fig. 8 demonstrates SERS spectra from 4-MBA modified nanoparticles of different compositions. Spectra contain clear-cut modes of 4-MBA at 1075 and 1586 cm−1 assigned to ν12 (breathing vibration of the aromatic ring coupled with C–S stretching) and ν8a ring vibration,40 respectively; out-of-plane ring deformation δ(CCC) at 714 cm−1, and deformation band of carboxylate group δ(COO−) at 839 cm−1.40–42 The broad feature in the 1350–1430 cm−1 range is related to the stretching vibration of carboxylate group νs(COO−) that is free from interactions (shoulder near 1423 cm−1) and directly bound to the metal surface (1360–1383 cm−1).40,43,44 It should be noted that in none of the samples any visible signal from the used polymer or silane was registered (although signal from the magnetite itself sometimes was registered near 670 cm−1 (Fig. S4, ESI†) in the samples without analyte). This might be due to the quite low concentration of the chemicals and intense signal from the analyte 4-MBA. The composition of nanoparticles has little effect on the 4-MBA spectrum other than the absolute intensity; however, the out-of-plane ring deformation δ(CCC) was found to be dependent on the nature of metal (either Ag or Au) the 4-MBA is adsorbed on. For example, a clear 21 cm−1 difference in peak position is detected when 4-MBA is adsorbed on bare Ag and Au nanoparticles (Fig. 9a). In Fig. 9b, a collection of normalized intensity spectra from composite nanoparticles Fe3O4@PEI@Au50@Agx, where Ag concentration changes from 100% to 0%, is shown. This might be related to contributions from C–S stretching and COO− deformation vibrations to ring out-of-plane mode δ(CCC)45 and/or different orientations of 4-MBA on Au and Ag surfaces, resulting in different intensities of out-of-plane modes in the vicinity of 600–800 cm−1.40 Presented data suggest that the reporter molecule may show some higher preference towards Ag (thus, the strong 715 cm−1 mode for x = 100–25) because when silver is not present (x = 0), the mode appears as a strong feature at 692 cm−1 and coincides with the one found in 4-MBA complex with Au.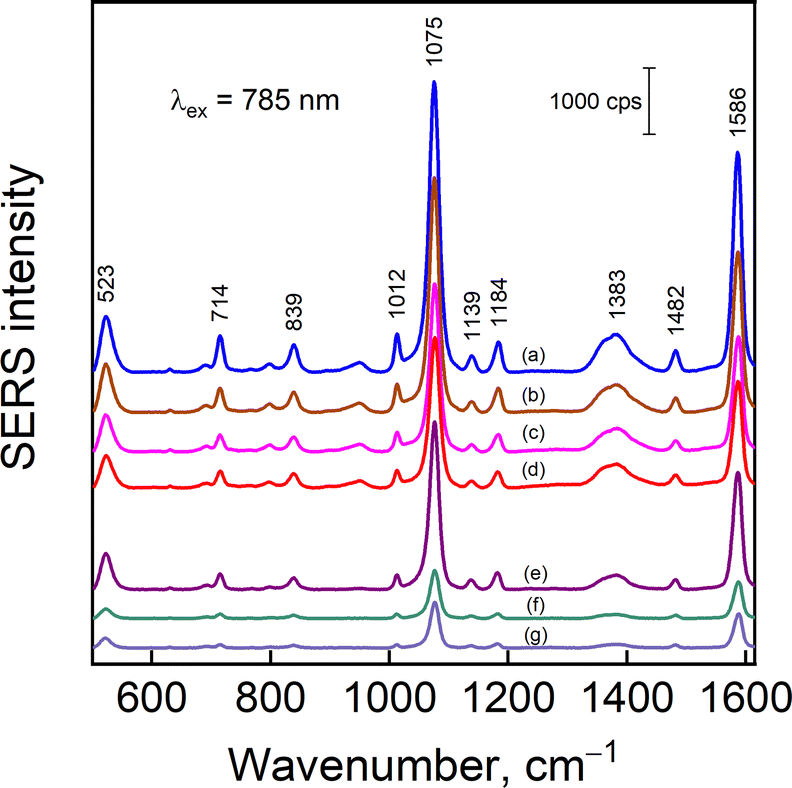 | ||
| Fig. 8 SERS spectra of 4-MBA adsorbed composite nanoparticles Fe3O4@PEI@AuNPs50@AgNPsx, where x = 100 (a), 75 (b), 50 (c), and 25 (d). Spectra of Fe3O4@PEI@AgNPs50@AuNPs25 (e), Fe3O4@PEI@AgNPs50@AuNPs50 (f), and Fe3O4@PEI@(AgNPs50/AuNPs50) (g) are also shown. Spectral intensities were not scaled. | ||
 | ||
| Fig. 9 SERS spectra of 4-MBA adsorbed on Au and Ag nanoparticles and composite nanoparticles with varied Ag concentration. The bottom spectra are 1075 cm−1 mode intensity-normalized. | ||
To get a deeper understanding of nanoparticle properties, multiwavelength SERS measurements were carried out. Composite iron oxide, silver, and gold nanoparticles, regardless of their exact composition, exhibited the greatest surface enhancement towards near-infrared portion of the spectrum, with 785 nm excitation being the highest for most of the nanoparticle types. Unsurprisingly, at fixed AuNPs concentration but increasing AgNPs, incrementally higher enhancement was found practically at each laser excitation wavelength (Fig. 10A). However, that was not the case for Fe3O4@PEI@AgNPs50@AuNPsy, where AgNPs were added first and then the AuNPs. A successive increase in AuNPs concentration from y = 25 to 50 had a diminishing effect on SERS enhancement (Fig. 10B). One might suspect that the addition of a second plasmonic nanoparticle type might affect the quantity of nanoparticles that were originally adsorbed on Fe3O4@PEI; in this case, the deposition of the second layer of AuNPs would minimize AgNPs already present on Fe3O4@PEI cores. Since silver has a higher enhancement factor than gold,46,47 its substitution with AuNPs is expected to decrease the normalized SERS intensity. Additionally, the 4-MBA preference towards Ag in our setup has been demonstrated in Fig. 9.
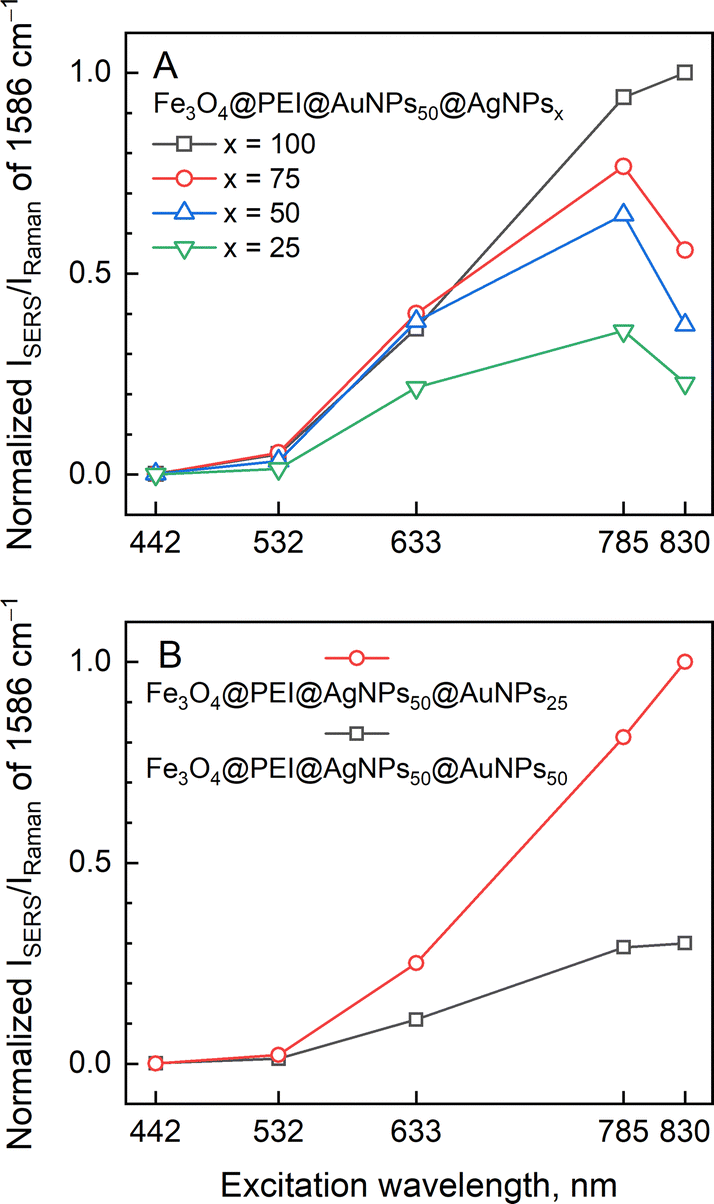 | ||
| Fig. 10 (A) Excitation wavelength dependence of the normalized SERS intensity of 1586 cm−1 band from 4-MBA adsorbed on a Fe3O4@PEI@AuNPs50@AgNPsx, where x = 100, 75, 50, and 25 and (B) the similar for Fe3O4@PEI@AgNPs50@AuNPsy, where y = 25 and 50. Each data point is obtained by averaging 30 independent SERS measurements; intensities are scaled to 1. | ||
To explain how the AuNPs and AgNPs capping order affects the SERS signal, we prepared and tested composite nanoparticles where (i) AuNPs were added to the Fe3O4@PEI first, and then the AgNPs, (ii) AgNPs were added first, then the AuNPs, and (iii) AuNPs and AgNPs were first mixed together and then added to the iron oxide nanoparticle solution (Fig. 11). Apparently, the composition that had first added AuNPs and then the AgNPs showed the highest SERS intensity, while the other two were similar. It should be noted that the direct connection of UV-Vis absorption maximum and enhancement of SERS signal at certain excitation wavelengths cannot be accomplished accurately because the spatial plasmon resonance distribution for these methods is different; surface-like for SERS and bulk-like for UV-Vis.48
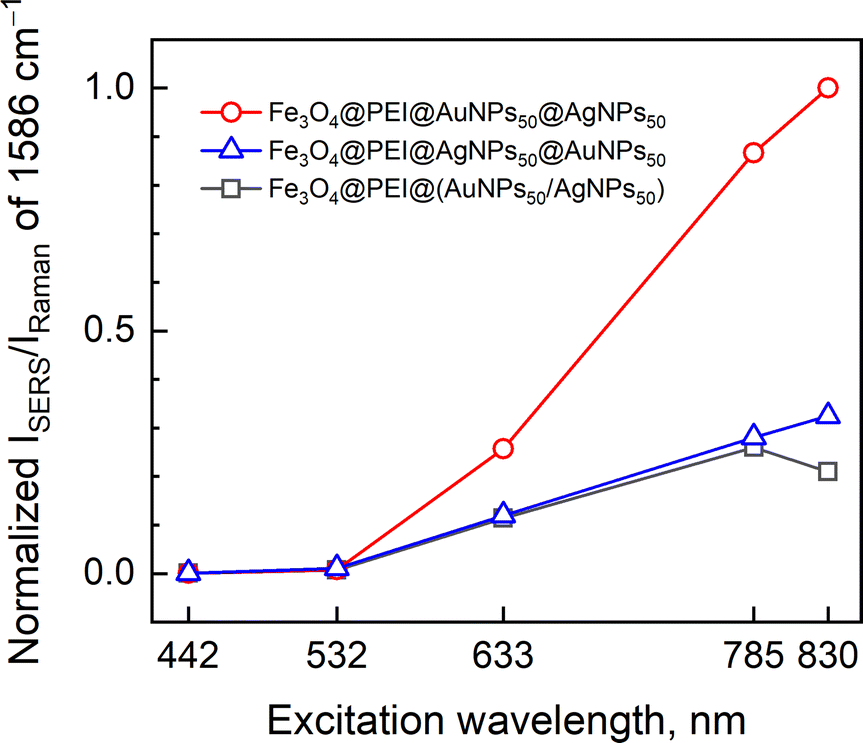 | ||
| Fig. 11 Excitation wavelength dependence of the normalized SERS intensity of 1586 cm−1 band from 4-MBA adsorbed on Fe3O4@PEI nanoparticles capped with AuNPs50 and AgNPs50 in a different order of sequence. Each data point is obtained by averaging 30 independent SERS measurements; intensities are scaled to 1. | ||
4. Conclusions
In this work, 50 nm size magnetic nanoparticles were modified using different monomers, polymers, and silanes. From the rich selection of modifiers, polyethyleneimine (PEI) showed the highest potential for magneto-plasmonic nanoparticle formation by means of XRD, UV-Vis, and SERS. Composite nanoparticles were formed by capping magnetite with Au and Ag colloids in succession or with a mixture of both Au and Ag NPs. Beyond PEI, other promising modifiers were (3-aminopropyl) triethoxysilane, N-(3-(trimethoxysilyl) propyl) ethylenediamine, and exclusively for gold, the 3-(mercapto propyl)trimethoxysilane.SERS characterization of nanoparticles indicated that reporter molecule 4-MBA has a preference towards the Ag part of the composite nanoparticles. Such an observation, together with the higher Ag enhancement factor, comes into play when the decoration sequence for Fe3O4@PEI is considered. Indeed, we show that sequence matters, as the nanoparticles prepared by capping iron oxide with AuNPs and then AgNPs exhibited noticeably higher SERS intensity compared to the ones prepared in reverse order or the ones where AuNPs and AgNPs were added simultaneously. We demonstrate that incrementally higher AgNPs concentration in composite nanoparticles has a positive effect on the SERS intensity, especially with laser excitation source in the near-infrared.
Author contributions
Gytaute Sirgedaite conducted the synthesis of magnetite, silver, and gold nanoparticles, performed modification and decoration procedures, executed XRD and UV-Vis measurements; Martynas Talaikis performed multiwavelength SERS measurements, interpreted the obtained results, and described this part; Gediminas Niaura suggested the idea of the manuscript and supervised the process; Lina Mikoliunaite wrote the draft of the manuscript, performed SERS measurements of AgNPs coated magnetite, coordinated the processes. All the authors reviewed and edited the manuscript.Conflicts of interest
There are no conflicts to declare.Acknowledgements
This research is funded by the European Social Fund under the No. 09.3.3-LMT-K-712-19-0142 “Development of Competences of Scientists, other Researchers and Students through Practical Research Activities” measure under a grant agreement with the Research Council of Lithuania (LMTLT). Authors would like to thank J. Dobilas and Dr. V. Stankevic from Center for Physical Sciences and Technology (Vilnius, Lithuania) for magnetivity measurements.References
- M. Abbas, S. R. Torati and C. G. Kim, Nanoscale, 2015, 7, 12192–12204 RSC.
- S. Xuan, Y. X. J. Wang, J. C. Yu and K. C. F. Leung, Langmuir, 2009, 25, 11835–11843 CrossRef CAS PubMed.
- S. A. H. Jalali, A. Allafchian, H. Bahramian and R. Amiri, J. Environ. Chem. Eng., 2017, 5, 5786–5792 CrossRef CAS.
- S. S. Chen, H. Xu, H. J. Xu, G. J. Yu, X. L. Gong, Q. L. Fang, K. C. F. Leung, S. H. Xuan and Q. R. Xiong, Dalton Trans., 2015, 44, 9140–9148 RSC.
- Z. Kanwal, M. A. Raza, S. Riaz, S. Manzoor, A. Tayyeb, I. Sajid and S. Naseem, R. Soc. Open Sci., 2019, 6, 182135 CrossRef CAS.
- C. Wang, S. Xu, K. Zhang, M. Li, Q. Li and R. Xiao, J. Mater. Sci., 2017, 52, 1357–1368 CrossRef CAS.
- P. Quaresma, I. Osório, G. Dória, P. A. Carvalho, A. Pereira, J. Langer, J. P. Araújo, I. Pastoriza-Santos, L. M. Liz-Marzán, R. Franco, P. V. Baptista and E. Pereira, RSC Adv., 2014, 4, 3659–3667 RSC.
- A. Michałowska and A. Kudelski, Molecules, 2022, 27, 3081 CrossRef.
- A. Michałowska, J. Krajczewski and A. Kudelski, Spectrochim. Acta, Part A, 2022, 277, 121266 CrossRef.
- Z. Y. Chen, A. Gupta and S. Chattopadhyay, Sens. Actuators, B, 2021, 337, 1–9 CrossRef.
- Z. A. Elhouderi, D. P. Beesley, T. T. Nguyen, P. Lai, K. Sheehan, S. Trudel, E. Prenner, D. T. Cramb and M. Anikovskiy, Mater. Res. Express, 2016, 3, 045013 CrossRef.
- H. Veisi, S. Razeghi, P. Mohammadi and S. Hemmati, Mater. Sci. Eng., C, 2019, 97, 624–631 CrossRef CAS.
- A. Michałowska, M. Żygieło and A. Kudelski, Appl. Surf. Sci., 2021, 562, 1–10 CrossRef.
- H. Lai, F. Xu and L. Wang, J. Mater. Sci., 2018, 53, 8677–8698 CrossRef CAS.
- R. T. Busch, F. Karim, Y. Sun, H. C. Fry, Y. Liu, C. Zhao and E. S. Vasquez, Frontal Nanotechnol. Res., 2021, 3, 1–11 Search PubMed.
- D. A. Wheeler, S. A. Adams, T. López-Luke, A. Torres-Castro and J. Z. Zhang, Ann. Phys., 2012, 524, 670–679 CrossRef CAS.
- F. Hu, H. Lin, Z. Zhang, F. Liao, M. Shao, Y. Lifshitz and S. T. Lee, Sci. Rep., 2014, 4, 1–10 Search PubMed.
- C. Wang, K. Zhang, Z. Zhou, Q. Li, L. Shao, R. Z. Hao, R. Xiao and S. Wang, Int. J. Nanomed., 2017, 12, 3077–3094 CrossRef CAS.
- W. J. Tseng and Y.-C. Chuang, J. Nanosci. Nanotechnol., 2017, 18, 2790–2796 CrossRef.
- S. Senapati, S. K. Srivastava, S. B. Singh and A. R. Kulkarni, Environ. Res., 2014, 135, 95–104 CrossRef CAS.
- J. L. Lyon, D. A. Fleming, M. B. Stone, P. Schiffer and M. E. Williams, Nano Lett., 2004, 4, 719–723 CrossRef CAS.
- C. Yuen and Q. Liu, Analyst, 2013, 138, 6494–6500 RSC.
- O. Ivashchenko, E. Coy, B. Peplinska, M. Jarek, M. Lewandowski, K. Zalȩski, A. Warowicka, A. Wozniak, T. Babutina, J. Jurga-Stopa, J. Dolinsek and S. Jurga, Nanotechnology, 2017, 28, 1–11 CrossRef.
- Y. Hu and Y. Sun, J. Phys. Chem. C, 2012, 116, 13329–13335 CrossRef CAS.
- S. Y. Han, Q. H. Guo, M. M. Xu, Y. X. Yuan, L. M. Shen, J. L. Yao, W. Liu and R. A. Gu, J. Colloid Interface Sci., 2012, 378, 51–57 CrossRef CAS PubMed.
- H. L. Sun, M. M. Xu, Q. H. Guo, Y. X. Yuan, L. M. Shen, R. A. Gu and J. L. Yao, Spectrochim. Acta, Part A, 2013, 114, 579–585 CrossRef CAS.
- E. Kammer, T. Dorfer, A. Csaki, W. Schumacher, P. A. Da Costa Filho, N. Tarcea, W. Fritzsche, P. Rosch, M. Schmitt and J. Popp, J. Phys. Chem. C, 2012, 116, 6083–6091 CrossRef PubMed.
- M. Fernanda Cardinal, B. Rodríguez-González, R. A. Alvarez-Puebla, J. Pérez-Juste and L. M. Liz-Marzán, J. Phys. Chem. C, 2010, 114, 10417–10423 CrossRef CAS.
- L. León Félix, J. A. H. Coaquira, M. A. R. Martínez, G. F. Goya, J. Mantilla, M. H. Sousa, L. D. L. S. Valladares, C. H. W. Barnes and P. C. Morais, Sci. Rep., 2017, 7, 1–8 CrossRef.
- E. A. Kwizera, E. Chaffin, X. Shen, J. Chen, Q. Zou, Z. Wu, Z. Gai, S. Bhana, R. Oconnor, L. Wang, H. Adhikari, S. R. Mishra, Y. Wang and X. Huang, J. Phys. Chem. C, 2016, 120, 10530–10546 CrossRef CAS.
- Y. Zhai, J. Zhai, Y. Wang, S. Guo, W. Ren and S. Dong, J. Phys. Chem. C, 2009, 113, 7009–7014 CrossRef CAS.
- B. Lee and S. Koo, J. Ind. Eng. Chem., 2012, 18, 1191–1195 CrossRef CAS.
- M. A. Vergés, R. Costo, A. G. Roca, J. F. Marco, G. F. Goya, C. J. Serna and M. P. Morales, J. Phys. D: Appl. Phys., 2008, 41, 1–10 Search PubMed.
- S. Wojtysiak and A. Kudelski, Colloids Surf., A, 2012, 410, 45–51 CrossRef CAS.
- G. Zambzickaite, M. Talaikis, J. Dobilas, V. Stankevic, A. Drabavicius, G. Niaura and L. Mikoliunaite, Materials, 2022, 15, 4008 CrossRef CAS.
- D. Paramelle, A. Sadovoy, S. Gorelik, P. Free, J. Hobley and D. G. Fernig, Analyst, 2014, 139, 4855–4861 RSC.
- W. Haiss, N. T. K. Thanh, J. Aveyard and D. G. Fernig, Anal. Chem., 2007, 79, 4215–4221 CrossRef CAS PubMed.
- Y. W. Ma, Z. W. Wu, L. H. Zhang, J. Zhang, G. S. Jian and S. Pan, Plasmonics, 2013, 8, 1351–1360 CrossRef CAS PubMed.
- L. Mikoliunaite, M. Talaikis, A. Michalowska, J. Dobilas, V. Stankevic, A. Kudelski and G. Niaura, Nanomaterials, 2022, 12, 2860 CrossRef CAS.
- A. Michota and J. Bukowska, J. Raman Spectrosc., 2003, 34, 21–25 CrossRef CAS.
- E. Daublytė, A. Zdaniauskienė, M. Talaikis, A. Drabavičius and T. Charkova, New J. Chem., 2021, 45, 10952–10958 RSC.
- A. Capocefalo, D. Mammucari, F. Brasili, C. Fasolato, F. Bordi, P. Postorino and F. Domenici, Front. Chem., 2019, 7, 1–11 CrossRef PubMed.
- H. I. Lee, W. Suh and M. S. Kim, J. Raman Spectrosc., 1988, 19, 491–495 CrossRef CAS.
- J. S. Suh and M. Moskovits, J. Am. Chem. Soc., 1986, 108, 4711–4718 CrossRef CAS.
- V. Mohaček-Grošev, H. Gebani, A. Bonifacio, V. Sergo, M. Dakovic and D. Bajuk-Bogdanovic, Spectrochim. Acta, Part A, 2018, 200, 102–109 CrossRef.
- E. J. Zeman and G. C. Schatz, J. Phys. Chem., 1987, 91, 634–643 CrossRef CAS.
- G. C. Schatz and R. P. van Duyne, Handbook of Vibrational Spectroscopy, ed. P. R. Griffiths, John Wiley & Sons, Ltd, Chichester, UK, 2006 Search PubMed.
- E. C. Le Ru, C. Galloway and P. G. Etchegoin, Phys. Chem. Chem. Phys., 2006, 8, 3083–3087 RSC.
Footnote |
| † Electronic supplementary information (ESI) available. See DOI: https://doi.org/10.1039/d2nj04368h |
| This journal is © The Royal Society of Chemistry and the Centre National de la Recherche Scientifique 2023 |