
 Open Access Article
 This Open Access Article is licensed under a Creative Commons Attribution-Non Commercial 3.0 Unported Licence
Pulsed electric field assisted extraction of soluble proteins from nettle leaves (Urtica dioica L.): kinetics and optimization using temperature and specific energy
Morgana
Kronbauer
ac,
Ivan
Shorstkii
 b,
Suse
Botelho da Silva
*c,
Stefan
Toepfl
a,
Alica
Lammerskitten
a and
Claudia
Siemer
a
b,
Suse
Botelho da Silva
*c,
Stefan
Toepfl
a,
Alica
Lammerskitten
a and
Claudia
Siemer
a
aElea Vertriebs- und Vermarktungsgesellschaft mbH, Prof.-von-Klitzing Str. 9, 49610 Quakenbrück, Germany
bAdvanced Technologies and New Materials Laboratory, Kuban State Technological University, Moskovskaya 2, 350072, Krasnodar, Russia
cPolytechnic School, Unisinos University, Av. Unisinos 950, 93022-970, São Leopoldo, RS, Brazil. E-mail: susebs@unisinos.br
First published on 19th September 2023
Abstract
Plant-based proteins are rapidly emerging, while novel technologies are explored to offer more efficient extraction processes. The current study aimed to evaluate the effects of pulsed electric fields (PEFs) and temperature on the extraction of soluble proteins from nettle leaves (Urtica dioica L.) and identify an optimal operational range for the highest yield of soluble proteins. Extractions and kinetic modeling were conducted with whole and ground dried leaves at different temperatures (30–70 °C) and specific energy of PEF (0–30 kJ kg−1) with extraction times of up to 60 min. The influence of temperature and specific energy on the soluble protein extraction yields was investigated and modeled using composite central design and response surface methodology. The experimental results were fitted to Peleg's kinetic model, which satisfactorily described the extraction process (R2 > 0.902), and PEF treated samples resulted in a higher soluble protein yield and shortened processing time. Response surface methodology showed that the linear effect of temperature and quadratic effect of PEF (p < 0.01) were highly significant for protein yield. In the optimized PEF-extraction region (specific energy between 10 and 24 kJ kg−1, and 70–78 °C), soluble protein yield was higher than 60% after 5 minutes of extraction. The achieved results are relevant for developing processes for PEF assisted extraction of soluble proteins from leaves. Understanding the effects of PEFs and process parameters is crucial to obtain high protein yields, while requiring low energy and short processing time.
Sustainability spotlightThe promotion of health and environmental sustainability is driving the trend towards plant-based diets. To attain this global trend, alternative proteins and novel processing methods are urgently needed, especially for the supply of soluble vegetable proteins for the plant-based beverage industry. Addressing this, pulsed electric field technology provides a solution by improving yield and efficiency, and reducing energy, time, and solvent usage in extraction processes. Our work, aligned with UN SDGs 3, 9 and 12, gives serious consideration to improved health, and promotes innovation and responsible consumption. This research analyzes the effects of pulsed electric fields and temperature on the extraction of soluble proteins from nettle leaves and identifies an optimal operational range for this process. |
1 Introduction
Urtica dioica L. is a wild herbaceous perennial plant that belongs to the Urticaceae family. This plant is known as stinging nettle, due to stinging trichomes that cover the stems and leaves, which cause blistering when it comes into contact with skin; however, this characteristic is lost by thermal processing or drying.1 Nettles usually grow in temperate and tropical regions of Europe, Africa, Asia and America,2,3 usually being commercialized as dried leaves for use as an herbal tea or addition to soups and broths. Beyond these conventional uses, stinging nettle has acquired scientific interest because it is a source of many value added natural products, such as proteins, polyphenols, minerals and vitamins.4,5 Indeed, protein content represents approximately 30% of the dry mass of nettle leaves and provides all essential amino acids needed for humans,6 demonstrating the potential of this plant as an alternative source of this nutrient.At the present time, plant-based diets represent a trend in the promotion of physical health and environmental sustainability. Indeed, the plant protein market is estimated to grow worldwide at 14.1% CAGR (compound annual growth rate) by 2025.7 According to recent market studies, Germany has the largest growth rate in the sector of vegan food and beverages in the world and together with the United Kingdom are the leading markets for meat substitutes in Europe.8 To attain this global trend, substitutes to currently used proteins and novel processing methods are urgently needed, especially for the supply of soluble vegetable proteins for the plant-based beverage industry. In this sense, nettle leaves are an outstanding alternative, as they provide a non-allergenic, high biological value protein with a unique nutrient profile.
In this scenario, the development of novel technologies for protein extraction from plants and studies for process optimization are rather required to maintain the functionality of valuable compounds and to ensure the sustainability of the food chain. Chemical or thermal conventional extraction methods typically require a large amount of energy and chemicals and, depending on intensity, can degrade constituents, causing loss of functionality and bioavailability. In contrast, enzymatic processes use mild operational conditions, causing less environmental impact; however, they often extract lower quantities of protein than conventional treatments. To solve this issue, the assisted use of novel technologies for extraction, such as a pulsed electric field (PEF), can significantly improve yield and efficiency, while reducing time, energy consumption and solvent usage.9–12
Pulsed electric field (PEF) is a nonthermal technology known in food science for increasing cell membrane permeability. This technology is based on the application of electrical pulses (0.5 to 40 kV cm−1) of short duration to a product placed between a set of electrodes in a chamber. The electric field generated induces polarization of the cell membrane, leading to electroporation.13 Due to the increase in cytoplasmic membrane porosity, a PEF promotes enhanced extraction of intracellular components, such as proteins, polyunsaturated fatty acids, amino acids, lipids, antioxidants, minerals, or pigments.14–16 Although it is still unclear if a PEF could affect intracellular components such as proteins,17 alteration in protein conformation and functionality,18 changes in secondary and tertiary structure of proteins and formation of protein aggregates, denaturation and insolubility were reported.19 These results highlight the need for optimization of PEF treatments for protein extraction and demonstrate that this is an area of research that is quickly growing.17
Most studies concerning PEF assisted extractions focus on extraction of fruit and vegetable juices,10,16,20 phenolic compounds and antioxidants,21,22 pigments and proteins from microalgae and cyanobacteria20,23–25 and extraction of lipids and proteins from insects26,27 and from microorganisms.28 Nevertheless, to the best of our knowledge, only a few research studies have been performed for protein extraction from leaves using pulsed electric field technology.29,30 Barba et al.(2015)30 studied the influence of emerging technologies on the intensification of the extraction of valuable compounds from Stevia leaves, showing that the treatments improved both kinetics and extraction yield of soluble matter. Furthermore, Yu et al. (2015)29 demonstrated the effectiveness of PEF-treatment as a new way of rapeseed stem and leave valorization, as the extraction yields of polyphenols and proteins were highly increased. While these studies enhanced the understanding of the impact of PEF on protein extraction from leaves, the optimization of conditions and the analysis of parameter interactions were not performed. Moreover, nettle leaves have not been explored as a protein source yet, although they have a high content of this nutrient. The current study hypothesizes that the increase in PEF intensity and temperature will cause higher protein yields, with the possibility of a synergistic interaction between these variables. Therefore, the aim of this study is to evaluate the effects of pulsed electric fields and temperature on the extraction of soluble proteins from nettle leaves and identify an optimal operational range for this process.
2 Materials and methods
2.1 Materials
Nettle leaves were provided dried, partially fragmented, with irregular dimensions (<3 mm), by Justaste GmbH (Germany). All analyses were conducted with the same batch. The samples were stored at room temperature (20 °C) prior to treatment. The current study was performed with dried leaves to standardize raw material.The samples were grated in two categories for extraction experiments: non-ground and ground leaves. The non-ground samples were not subjected to any type of processing, although the dimensions were classified between 1–3 mm. The ground samples were processed (Kenwood, CH58, UK) for 2 min and grated through wire mesh (<1 mm).
2.2 Proximate analysis
All analyses were conducted according to AOAC official methods.31 Moisture content was measured by drying at 105 °C for 4 hours in an oven (Heraeus T 5050 E, Germany) and ash remained after combustion at 550 °C for 4 hours in a muffle furnace (Nabertherm L40/11, Germany). Fat content was determined by Soxhlet extraction (SOXTHERM, Germany) using petroleum ether as the solvent. Determination of proteins was performed by the Kjeldahl method (VAPODEST 450, Germany) and nitrogen content was expressed as protein concentration (N × 6.25). The trials were performed at least in triplicate. Total carbohydrate was obtained from the difference as follows: 100 − (moisture + crude protein + crude fat + ash).2.3 PEF treatment
PEF treatment was performed using a PEF-Cell Crack II batch system (Elea Vertriebs- und Vermarktungsgesellschaft mbH, Germany). High-voltage exponential decay, monopolar pulses with an interval of 0.5 s (2 Hz) and pulse duration of 40 μs were supplied by the PEF system. Treatment settings were defined as a fixed value for electric field strength (3 kV cm−1), and the number of applied exponential decay pulses was 7, 15, and 22. The number of pulses was chosen based on the desired specific energy input (varying from 10 kJ kg−1 to 30 kJ kg−1) and orientation from Siemer et al. (2012).32 Their study shows that disintegration of cellular material requires low values for electric field strength (range of 0.7 to 3 kV cm−1) and a specific energy (range of 1 to 20 kJ kg−1). Electric field strength refers to the field strength present in the treatment chamber during the treatment. It depends on the voltage applied between two electrodes, and the distance between them, according to eqn (1).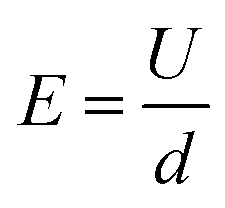 | (1) |
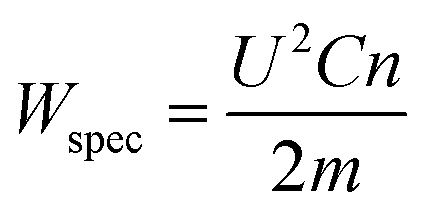
The specific energy applied to the product was adjusted by changing the number of pulses, while taking into consideration the total mass in the chamber. The specific energy intake Wspec (kJ kg−1) is calculated according to eqn (2),
 | (2) |
The treatment occurred inside a batch treatment chamber, where the pulses were applied to the product placed between two sets of stainless-steel electrodes 10 cm apart. In each experiment, 20 g of nettle leaves were placed in the chamber and 300 g of tap water (σ = 218.5 μS cm−1, T = 22 ± 1 °C, conductometer WTW-Cond 3310, Germany) was added as a conductive medium. PEF treatment was conducted with preheated water at 30 °C, 50 °C and 70 °C prior to extraction. The temperature rise during PEF-treatment was less than 3.0 °C. The current study was performed with a focus on industrial application, and therefore, tap water was used.
2.4 Extraction experiments
The experiments consisted of aqueous extractions of soluble proteins with a solid to liquid ratio of 1![[thin space (1/6-em)]](https://www.rsc.org/images/entities/char_2009.gif) :15, which was established from previous tests. After PEF pre-treatment, the samples were transferred into a Thermomix (Profi Cook, PC-MKM 1074, Germany) for further diffusion for one hour, while the Thermomix provided heat to reach the desired temperature (30 °C, 50 °C or 70 °C) and agitation at 240 rpm. At each temperature, control samples were analyzed. To follow the kinetics of protein extraction, samples were collected 1, 5, 10, 20, 30, 40, 50 and 60 minutes after PEF treatment. The supernatant collected was subjected to centrifugation at 5000×g for 8 minutes to remove leaf particles and stored at 4 °C until further analysis. Extractions were conducted in duplicate.
:15, which was established from previous tests. After PEF pre-treatment, the samples were transferred into a Thermomix (Profi Cook, PC-MKM 1074, Germany) for further diffusion for one hour, while the Thermomix provided heat to reach the desired temperature (30 °C, 50 °C or 70 °C) and agitation at 240 rpm. At each temperature, control samples were analyzed. To follow the kinetics of protein extraction, samples were collected 1, 5, 10, 20, 30, 40, 50 and 60 minutes after PEF treatment. The supernatant collected was subjected to centrifugation at 5000×g for 8 minutes to remove leaf particles and stored at 4 °C until further analysis. Extractions were conducted in duplicate.
2.5 Soluble protein content
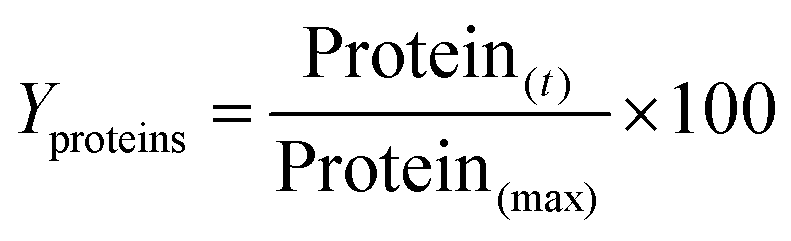
Soluble proteins of extracts were determined by the Thermo Scientific™ Pierce™ BCA Protein Assay for colorimetric detection and quantification. This method is based on the biuret reaction, which is the reduction of Cu2+ to Cu1+ by proteins in an alkaline medium with the highly sensitive and selective colorimetric detection of the cuprous cation (Cu1+) using bicinchoninic acid (BCA). The color formation is due to the chelation of two molecules of BCA with one cuprous ion.33The supernatant collected after centrifugation was mixed with the working reagent and incubated for 1 hour at room temperature, and absorbance was measured at the wavelength of 562 nm using a UV-vis spectrophotometer (Biochrom – GeneQuant 1300, Cambridge, UK). Bovine serum albumin – BSA (Thermo scientific, USA) was used as a standard.
The results of duplicate analysis are expressed as the percentage yield of soluble protein extracted (Yproteins), which were calculated using the following eqn (3):
 | (3) |
Solubility is a key factor that defines the protein functionality, with the yield of soluble protein extracted taken as a parameter or index to assess the effectiveness of the extraction process. This parameter is very relevant in our study considering its focus on maximizing the extraction of soluble protein for future utilization in protein beverages. Investigation of other functional characteristics of the extracted protein could also be important for further application.
2.6 Kinetic model of protein extraction
A kinetic study was performed to investigate the dynamics of PEF-assisted extraction and identify the time for the maximum protein extraction yield. The kinetic modeling was based on the suitability of Peleg's empirical model to represent the experimental data. In current experimental work, the extraction curves (protein yield) displayed a similar shape to the moisture sorption curves described by Peleg's model, suggesting that this model could be used to explain protein extraction kinetics,34 according to eqn (4):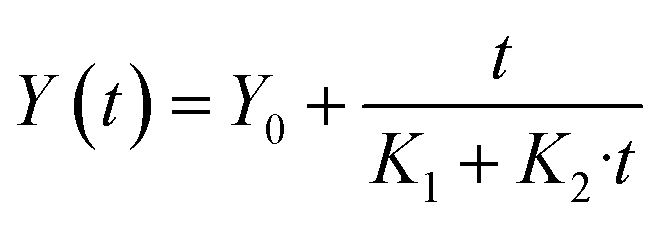 | (4) |
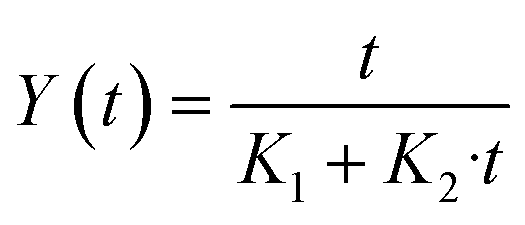 | (5) |
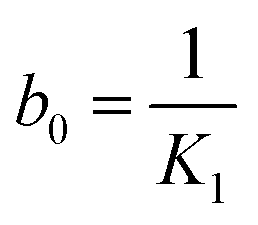
In eqn (5) the Peleg rate constant K1 is related to the extraction rate (b0) at the very beginning (t = t0)
 | (6) |
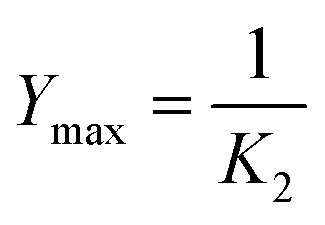
The Peleg capacity constant K2 is related to the maximum soluble protein extraction yield. When t → ∞ eqn (7) gives the relation between equilibrium concentration and constant K2.
 | (7) |
The parameters of the Peleg model (5) were determined from experimental data using non-linear regression (Quasi-Newton method). Model fitting was judged based on the regression coefficient (R2).35
2.7 Composite central design (CCD)
The influence of temperature and PEF specific energy on the protein yield was investigated using composite central design (CCD) and response surface methodology (RSM). This methodology was used to identify the optimal combination of factors that lead to the desired response in a specific time. The values assigned to the independent variables were based on the results of the kinetic study: minimum and maximum values (30 and 70 °C for temperature and 10 and 30 kJ kg−1 for specific energy), alongside the axial values computed by CCD design are presented in Table 1. Response surface methodology (RSM) was used to seek a relationship between the input variables and the response affected by them. The influence of factors on protein yield was analyzed during the ascending phase of the extraction kinetic curves for ground leaves (<1 mm), aiming to identify the conditions that maximize the efficiency of protein extraction.| Factors | Levels | ||||
|---|---|---|---|---|---|
| −1.414 | −1 | 0 | 1 | 1.414 | |
| Temperature (°C) | 21.7 | 30 | 50 | 70 | 78.3 |
| Specific energy (kJ kg−1) | 5.90 | 10 | 20 | 30 | 34.1 |
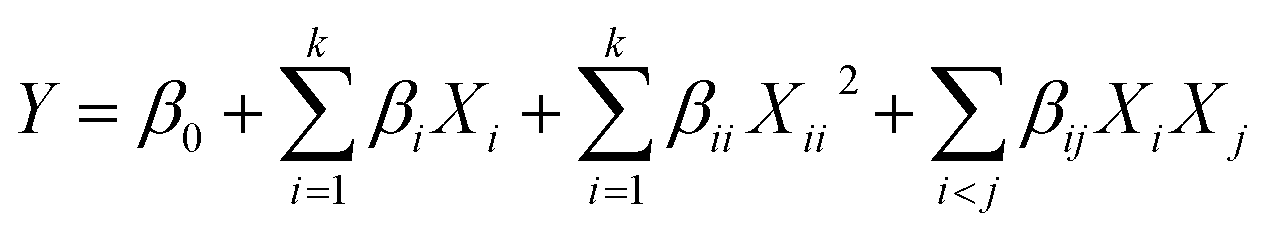
A CCD (k = 2, α = 1.414) consisting of 4 factorial, 4 axial, and 3 central points was designed. All points were duplicated, resulting in a total of 22 runs. A second-order polynomial regression model was obtained from experimental design according to the following equation:
 | (8) |
The adequacy of the regression model obtained from CCD was assessed by analyzing the lack of fit and the coefficient of determination (R2). The significance of each effect and regression coefficients was determined by the F test obtained from ANOVA. Response surface and contour plots were obtained from the validated regression model. Through examination of response surface and contour plots, the optimal temperature and specific energy parameters for attaining the highest yield of soluble protein were determined.
2.8 Statistical analysis
Experiments were repeated three times, unless otherwise specified, and the results are expressed as mean values and standard deviations (SD). The statistical analysis, including the CCD design, multivariate regression and response surface methodology (RSM) plots were performed with STATISTICA 13 (Statsoft, USA). To assess significant differences between protein yields, variance analysis was performed at α = 0.05.3 Results and discussion
3.1 Proximate analysis
The results for crude protein, crude fat, ash, and total carbohydrate of dried nettle leaves are presented in Table 2. The moisture of the dried leaves was determined to be 9.70% and further results are presented on a dry basis.| Component | (% db) |
|---|---|
| a Values represent the mean of three replicates ± standard deviation, and the total carbohydrate was obtained from the difference. | |
| Ash | 18.5 ± 0.1 |
| Crude fat | 1.03 ± 0.00 |
| Crude protein | 32.3 ± 0.1 |
| Total carbohydrate | 48.2 ± 0.2 |
Protein content in nettle leaves usually ranges between 28.8% and 33.7%.36,37 In the present study, protein determination analysis also demonstrated that nettle leaves contain an appreciable amount of crude protein (32.3 ± 0.1%). According to the US FDA,38 nettle is a rich source of protein and presents a higher protein content than spinach (Spinacia oleracea), alfalfa (Medicago sativa) and ora pro nobis (Pereskia aculeate) (26.0%, 26.1%, and 28.4%, respectively).37,39,40
The mineral content in nettle was approximately 18% of the dry mass. This result is in close agreement with what has been previously reported.41 Crude fat content in the leaves was 1.03%, which is higher than the values (0.6%) presented in the study performed by Rutto et al.42 and lower than the values presented by Alemayehu et al.43 (4.4%). Different proportions of all these compounds are related to plant variety, climate, soil, vegetative stage, and harvest time.44
3.2 Protein extraction kinetics and Peleg's model
The extraction kinetics of proteins from nettle leaves pre-treated by using a PEF at different specific energies, temperatures, and particle sizes are presented in Fig. 1.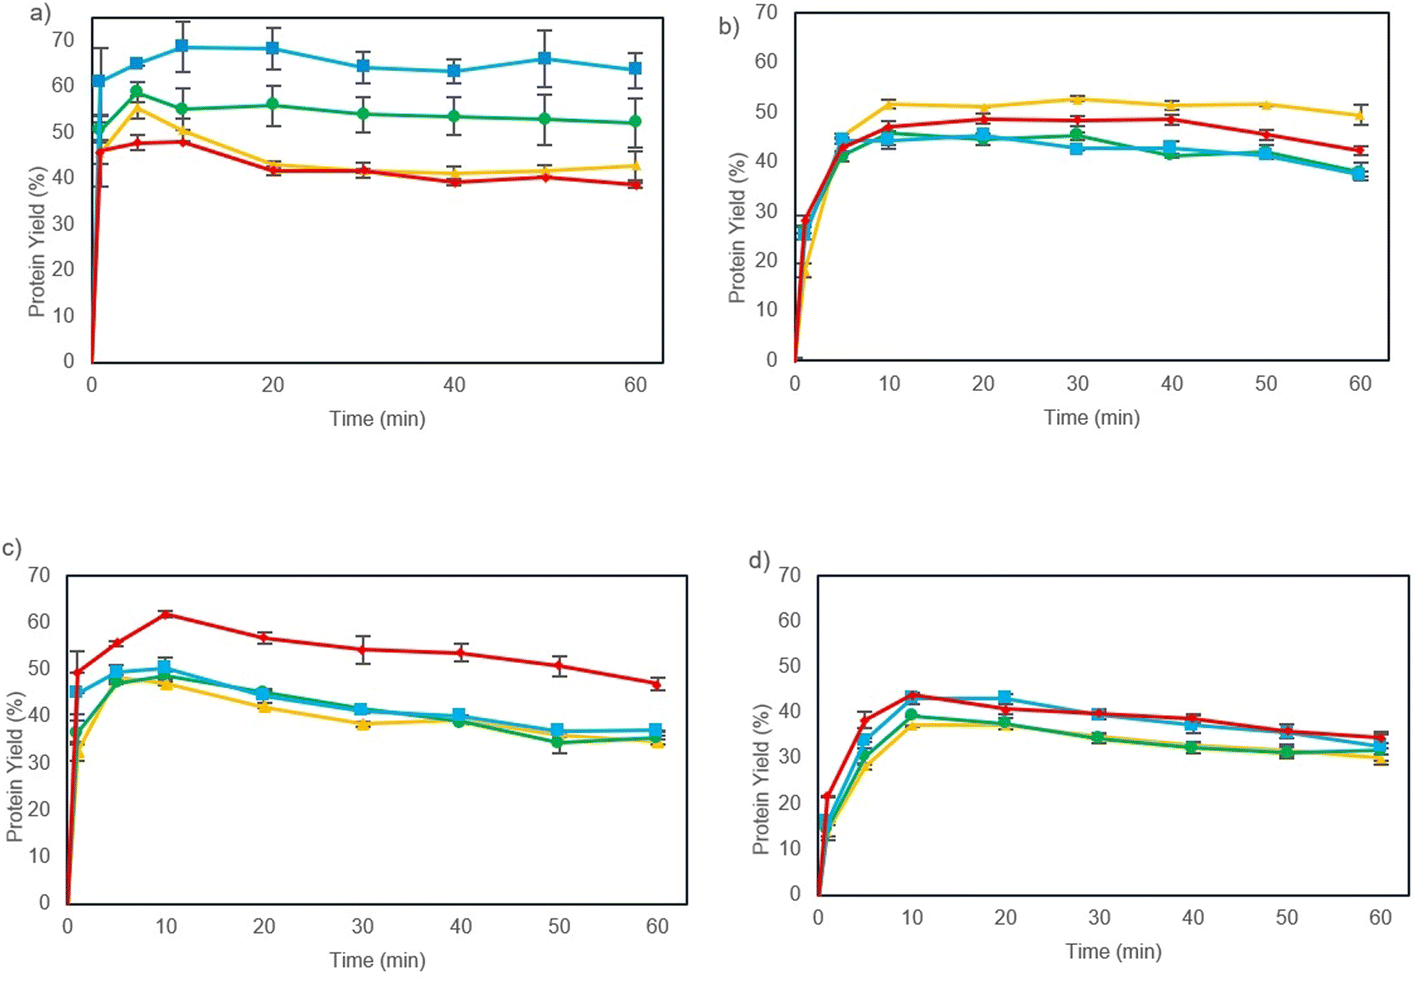 | ||
| Fig. 1 Extraction kinetics of soluble proteins from nettle leaves: (a) 70 °C (<1 mm), (b) 70 °C (<3 mm), (c) 50 °C (<1 mm), and (d) 50 °C (<3 mm), from 0 to 30 kJ kg−1 of specific energy (yellow triangle – control; green circle – 10 kJ kg−1; blue square – 20 kJ kg−1; red rhombus – 30 kJ kg−1). | ||
Extraction yield of ground leaves (<1 mm) was larger compared to that of non-ground leaves (1–3 mm). This phenomenon was expected according to the mass transfer theory, because of reduced interfacial area between the solid and liquid.45 At 50 °C, particle size reduction increased protein yields up to 17%, when 30 kJ kg−1 was applied. At 70 °C, an increase in yield (21%) was observed, when subjected to 20 kJ kg−1. This phenomenon could be due to the increase in available surface area for interaction with the solvent and a greater disruption of cell walls by grinding. Grinding leaves resulted in a significant increase in extraction yield and should be considered an essential part of this process.
As evident from Fig. 1, the extraction yield increased rapidly with an increase in treatment time until 10 min after which it became constant (p < 0.05). Applying a PEF decreased the required time to reach higher yields. For instance, at 70 °C and particle size <1 mm, the PEF (20 kJ kg−1) extracts 68% of protein in 10 minutes, which equals 22.0 g of soluble protein from a total of 32.3 g/100 g of crude protein present in this material. Under the same conditions, control samples (without PEF treatment) achieved almost 15% less extraction yield (17.8 g of soluble protein from a total of 32.3 g/100 g of crude protein). The PEF increased protein yield in all the extractions, as depicted in Fig. 1, and control samples did not reach a protein yield higher than 50%. Similar findings have been previously reported in the literature. Yu et al. (2015)29 also found comparable results where the increase in PEF treatment (0–160 kJ kg−1) in rapeseed leaves resulted in shorter extraction time and an increase in protein yield (approximately 60% at 160 kJ kg−1).
The modified Peleg's model (eqn (5)) was used for experimental data approximation. Elhag et al.46 applied Peleg's model to describe the kinetics of water-soluble proteins in root extracts of Eurycoma apiculate by microwave assisted extraction. The authors reported that all the experimental data fitted well with the model's calculated data with a regression coefficient (R2) value of 0.97 indicating the suitability of Peleg's model to optimize water-soluble proteins in root extracts. Kumari et al.47 used Peleg's equation for kinetic modeling of polyphenols from potato peels. Peleg's equation demonstrated a good correlation (R2 > 0.92) between the experimental and the predicted values.
The initial extraction rate b0 (eqn (6)) and maximum extraction yield under experimental conditions Ymax (eqn (7)) were calculated from constants K1 and K2. The regression coefficients were high in all experiments (R2 > 0.902) which implied good concordance between experimental and calculated data (Table 3), suggesting that the modified Peleg's equation can capture underlying patterns or relationships. In this way, the model and its parameters can be used as a tool to gain insights, identify trends, or assess the impact of different variables on the outcome.
| Particle size (mm) | Temperature (°C) | Specific energy (kJ kg−1) | K 1 (min. 100 g total protein/g soluble protein extracted) | K 2 (100 g total protein/g soluble protein extracted) | R 2 |
|---|---|---|---|---|---|
| <1 | 30 | 0 | 0.0248 ± 0.0165 | 0.0231 ± 0.0023 | 0.928 |
| 10 | 0.0061 ± 0.0052 | 0.0246 ± 0.0014 | 0.965 | ||
| 20 | 0.0033 ± 0.0050 | 0.0230 ± 0.0016 | 0.951 | ||
| 30 | 0.0045 ± 0.0055 | 0.0223 ± 0.0016 | 0.948 | ||
| 50 | 0 | 0.0038 ± 0.0063 | 0.0245 ± 0.0020 | 0.933 | |
| 10 | 0.0017 ± 0.0056 | 0.0241 ± 0.0020 | 0.931 | ||
| 20 | 0.0018 ± 0.0043 | 0.0223 ± 0.0017 | 0.902 | ||
| 30 | 0.0013 ± 0.0033 | 0.0184 ± 0.0011 | 0.959 | ||
| 70 | 0 | −0.0013 ± 0.0041 | 0.0223 ± 0.0017 | 0.938 | |
| 10 | 0.0012 ± 0.0038 | 0.0183 ± 0.0013 | 0.945 | ||
| 20 | 0.0011 ± 0.0030 | 0.0152 ± 0.0010 | 0.953 | ||
| 30 | −0.0025 ± 0.0039 | 0.0238 ± 0.0018 | 0.943 | ||
| <3 | 30 | 0 | 0.0887 ± 0.0315 | 0.0321 ± 0.0022 | 0.977 |
| 10 | 0.0578 ± 0.0290 | 0.0324 ± 0.0027 | 0.957 | ||
| 20 | 0.0620 ± 0.0218 | 0.0283 ± 0.0017 | 0.979 | ||
| 30 | 0.0461 ± 0.0160 | 0.0314 ± 0.0017 | 0.979 | ||
| 50 | 0 | 0.0213 ± 0.0130 | 0.0261 ± 0.0021 | 0.946 | |
| 10 | 0.0295 ± 0.0177 | 0.0281 ± 0.0024 | 0.944 | ||
| 20 | 0.0269 ± 0.0153 | 0.0250 ± 0.0021 | 0.949 | ||
| 30 | 0.0164 ± 0.0092 | 0.0250 ± 0.0016 | 0.960 | ||
| 70 | 0 | 0.0269 ± 0.0076 | 0.0184 ± 0.0008 | 0.987 | |
| 10 | 0.0123 ± 0.0063 | 0.0218 ± 0.0012 | 0.971 | ||
| 20 | 0.0127 ± 0.0063 | 0.0218 ± 0.0012 | 0.971 | ||
| 30 | 0.0129 ± 0.0045 | 0.0199 ± 0.0008 | 0.985 |
The Peleg rate constant (K1) and the Peleg capacity constant (K2) were lower for ground particles (<1 mm) than for non-ground particles (1–3 mm). These results implied that the initial extraction rate (b0) and maximum protein extraction yield (Ymax) were higher with ground particles. For instance, the extractions conducted at 70 °C and a specific energy of 20 kJ kg−1 showed that an increase in PEF specific energy input will affect the initial extraction rate and maximum extraction yield of ground particles (b0 = 909 ± 385; Ymax = 65.8 ± 4.3) more than that of bigger particles (b0 = 78.7 ± 56.4; Ymax = 45.9 ± 2.5). At 50 °C, particle size reduction increased maximum soluble protein extraction yield (1/K2) by 14% when 30 kJ kg−1 was applied, reaching 40.0 ± 2.5% for particle size 1–3 mm and 54.3 ± 3.1% for particle size <1 mm. Moreover, the increase in extraction temperature and increase in specific energy of PEF treatment generally lead to a higher extraction rate b0, and therefore, lower K1 values for ground samples, showing that they tend to be more specific energy and temperature sensitive.
The maximum protein extraction yield (1/K2) is analyzed as shown in Fig. 2, where the influence of the PEF specific energy input on the maximum protein extraction yield at different temperatures (30, 50 and 70 °C) is shown. Overall, the maximum soluble protein extraction yield (1/K2) showed a tendency to increase with the increase in PEF specific energy input and extraction temperature, showing that PEF treatment can also enhance extraction of soluble proteins from dried nettle leaves. This PEF-temperature synergistic effect is likely because of an increase in fluidity of biological cells and a loss in their mechanical resistance on increasing the processing temperature, making the cell membrane more suitable for electroporation.48 The level of membrane electroporation will influence the diffusion rates facilitating extraction, since the compounds can easily diffuse into the solvent.32 However, a notable decrease under the conditions of 70 °C and 30 kJ kg−1 suggests that Peleg's constant 1/K2 is not only a PEF or temperature linear dependent value, but possibly a property affected by both variables or in a nonlinear relationship.
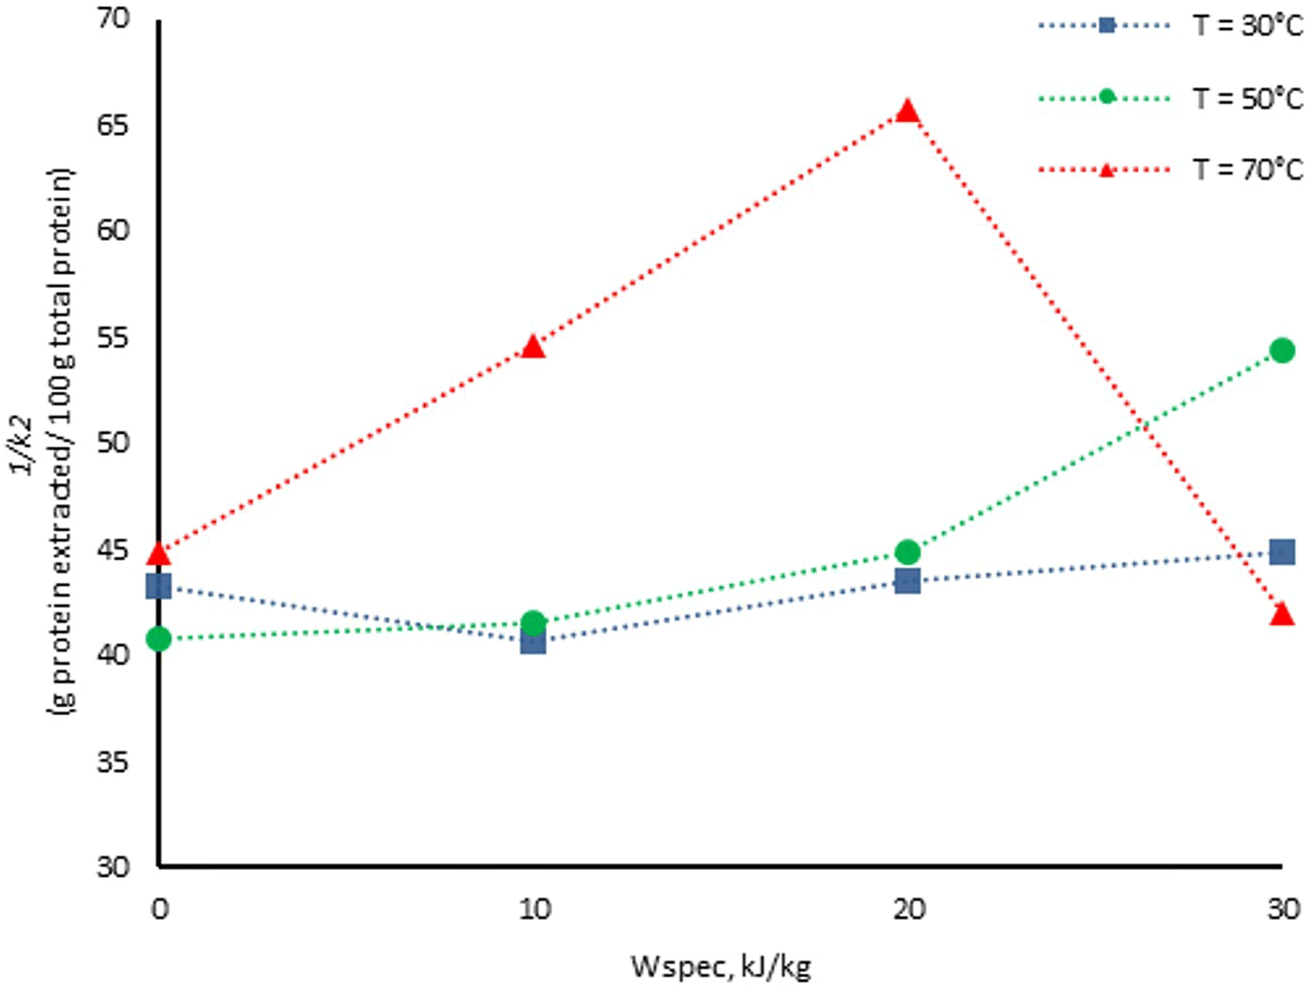 | ||
| Fig. 2 Effect of the PEF energy input and temperature on the maximum soluble protein extraction yield (1/K2) for ground particles (blue square – T = 30 °C; green circle – T = 50 °C; red triangle – T = 70 °C). | ||
As the effect of temperature and specific energy on extraction remained inconclusive, we opted for the response surface methodology to improve the understanding of the process mechanics. To perform our analysis, we used the data collected at the 5 minute mark during extraction. This timeframe was selected because it had the highest protein extraction yield or showed a consistent increase in yield across all trials. These data were considered, and more experiments were conducted to complete all the runs for a 22 composite central design. This procedure is designed to identify the conditions that yield the highest efficiency in protein extraction, and the results will be analyzed in detail in the next section.
3.3 Evaluation of parameters for extraction by response surface methodology (RSM)
A full quadratic model in coded factors was constructed using the general form of eqn (8), based on the data collected from the CCD to analyze the variables in the experimental design, and is shown in eqn (9). The terms of the regression model are X1 (linear temperature), X22 (quadratic specific energy) and X1X2 (interaction of linear temperature and linear specific energy), (X12, quadratic temperature) and X2 (linear specific energy) and Yproteins is the response variable (protein yield).| Yproteins = −56.28 + 8.74X1 − 1.98X12 + 0.687X2 − 7.99X22 − 3.95X2X1 | (9) |
ANOVA was employed to evaluate the significance of effects and to assess the adequacy of the quadratic model used in describing the relationship between the protein yield and the studied parameters. The linear effect of temperature and quadratic effect of specific energy on protein yield were highly significant (p < 0.01), indicating them to be crucial factors in this extraction process. The interaction effect between temperature and specific energy was also important; however, it did not reach statistical significance (p = 0.115). The determination coefficient R2 of the quadratic model was 0.81, which is a satisfactory fit to the experimental data, as models are considered successful when R2 is greater than 0.75.49 The p-value for the lack of fit was not significant (p = 0.52), confirming the accuracy of the quadratic model for predicting a relevant response.
The regression coefficient analysis of the model also revealed that only the linear temperature and the quadratic specific energy coefficient hold high significance, while the interaction coefficient can be considered marginally significant. Nonetheless, we chose to retain all coefficients in the fitted model. In some cases, it is important to maintain the interpretability of the model by including all coefficients. Using only significant coefficients could result in a simplified model that neglects potentially meaningful variables or interactions. By considering all coefficients, even those that are not statistically significant, the model can provide a more complete picture of the relationships and factors influencing the response. Besides this, the removal of the non-significant terms did not result in an appreciable increase in significance of the model in our case.
The regression model of the CCD data using actual factors is shown in eqn (10), where X1 is the temperature, X2 is specific energy, and Yproteins is the response variable (protein yield). This equation allows us to directly estimate the soluble protein yield from the actual values of temperature and specific energy.
| Yproteins = −28.31 + 1.32X1 − 0.0049X12 + 4.12X2 − 0.0801X22 − 0.0198X2X1 | (10) |
Table 4 shows the actual values of the factors, and observed and predicted yield for each run at 5 min for ground leaves (<1 mm). Higher yield (68.0 ± 0.6%) was observed at an energy input of 20 kJ kg−1 and temperature of 78.3 °C. Application of 70 °C and 30 kJ kg−1 showed a sharp decrease in yield (47.9 ± 3.5) when compared to samples at 70 °C and 10 kJ kg−1. Lower temperatures (30 °C) resulted in low yields (40–46%), depending on PEF treatment.
| Run | Uncoded variables | Soluble protein yield (%) | ||
|---|---|---|---|---|
| X 1 temperature (°C) | X 2 W spec (kJ kg−1) | Y e experimental yield | Y p predicted yield | |
| 1 | 30.0 | 10.0 | 41.7 | 34.3 |
| 2 | 30.0 | 30.0 | 46.3 | 40.8 |
| 3 | 70.0 | 10.0 | 55.7 | 59.7 |
| 4 | 70.0 | 30.0 | 50.3 | 50.4 |
| 5 | 21.7 | 20.0 | 31.7 | 40.0 |
| 6 | 78.3 | 20.0 | 68.6 | 64.7 |
| 7 | 50.0 | 5.90 | 35.8 | 41.3 |
| 8 | 50.0 | 34.1 | 39.4 | 39.4 |
| 9 | 30.0 | 10.0 | 40.5 | 34.3 |
| 10 | 30.0 | 30.0 | 45.5 | 40.8 |
| 11 | 70.0 | 10.0 | 62.0 | 59.7 |
| 12 | 70.0 | 30.0 | 45.4 | 50.4 |
| 13 | 21.7 | 20.0 | 33.2 | 40.0 |
| 14 | 78.3 | 20.0 | 67.3 | 64.7 |
| 15 | 50.0 | 5.90 | 40.1 | 41.3 |
| 16 | 50.0 | 34.1 | 37.5 | 39.4 |
| 17 | 50.0 | 20.0 | 59.7 | 56.3 |
| 18 | 50.0 | 20.0 | 55.5 | 56.3 |
| 19 | 50.0 | 20.0 | 60.4 | 56.3 |
| 20 | 50.0 | 20.0 | 51.8 | 56.3 |
| 21 | 50.0 | 20.0 | 61.2 | 56.3 |
| 22 | 50.0 | 20.0 | 49.1 | 56.3 |
The three-dimensional (3D) response surface plot is the graphical representation of the regression equation (eqn (10)), and the results of protein yield, as affected by the extraction temperature (X1) and specific energy (X2), are presented in Fig. 3. They provide a better visualization of the relationship between response and experimental levels of each variable and the type of interactions between them.
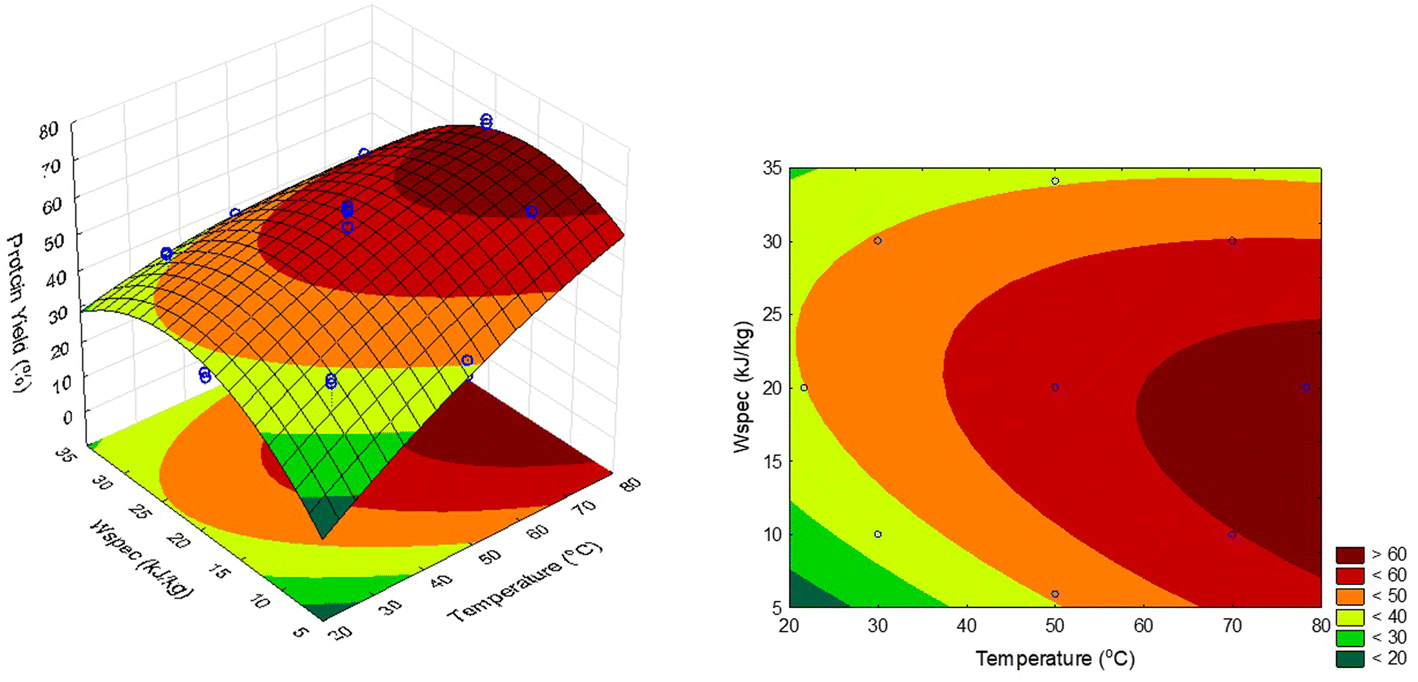 | ||
| Fig. 3 Effect of dependent variables (temperature and specific energy) on soluble protein yield: surface and contour plots. | ||
The highly significant quadratic effect of specific energy can be noted in Fig. 3. This quadratic effect on protein yield implies that there is an optimum condition for the energy applied. According to Toepfl et al.,13 in most cases, the higher the process intensity, the larger the number and size of the pores. However, the beneficial effect has certain limits, since high permeabilization does not always represent a positive impact on subsequent processes. An increase in specific energy (0 to 20 kJ kg−1) led to higher protein yield until a decrease is observed at specific energies higher than 25 kJ kg−1. This effect is intensified by temperature, and the degree of specific energy at which the curvature arises is also temperature-dependent, highlighting the necessity of examining both variables together to completely comprehend the investigated phenomenon. The negative impact on protein yield may be due to high exposure to electric fields and temperature, which causes irreversible changes in proteins, thus affecting soluble protein extraction yield. Reduction in solubility of soy protein isolates was also reported by Y. Li et al.50 after PEF treatment. The insolubilization could be due to protein denaturation and aggregation, during higher PEF treatment. This behavior is in close agreement with that observed by Zhou et al.,51 which evaluated the effect of PEF on protein extraction from mussels. The linear effect of temperature on protein yield is also observed as shown in Fig. 3, indicating that with an increase in temperature, protein yield also escalated. This effect is observed due to higher solubility and diffusivity of components being extracted at higher temperature levels, thus yielding higher extraction rates.45 As shown in Fig. 3, it is possible to observe a region with high extraction yields above 60 °C and between 10 and 24 kJ kg−1, evidencing the influence of both temperature and specific energy on protein yield. A point within the region with maximum yield was chosen for additional validation of the prediction power of the model. At 70 °C and 20 kJ kg−1, the prediction made by the model suggests a yield of 63.0%, which closely agrees with the observed protein yield of 65.1% ± 0.6, obtained previously in the kinetics study. At the same time, the model predicted a yield of 64.7% when extraction was conducted at 78 °C and 20 kJ kg−1. Thus, the best regions to perform the extractions and obtain >60% yield are found at 70–78 °C with specific energy ranging from 10 to 24 kJ kg−1, using an electric field intensity of 3 kV cm−1, liquid–solid ratio of 1:15, and extraction time of 5 minutes with ground leaves <1 mm.
Previous studies have mainly focused on utilizing RSM to optimize PEF-assisted extraction processes for antioxidants and phenolic compounds.21,22 In the current work, the same approach contributed to a better understanding of the combined effects of temperature and PEFs on extraction of soluble protein from leaves and allowed the identification of an optimal operational range. These findings are strongly relevant for scientists and engineers seeking alternative plants for protein extraction and developing innovative and sustainable applications for food processing.
4 Conclusions
This study demonstrated the significance of specific energy and temperature in extracted protein yield. PEF application can increase the extraction yield and reduce the extraction time, acting as a promising methodology for protein extraction from leaves. The PEF specific energy input, extraction temperature and particle size had a high influence on solid–liquid extraction kinetics. The CCD analysis showed that the linear effect of temperature and quadratic effect of specific energy are highly significant for protein yield. The best conditions to obtain the maximum extraction yield of protein from nettle leaves were found in the following regions: an electric field intensity of 3 kV cm−1, specific energy ranging from 10 to 24 kJ kg−1, temperature from 70–78 °C, liquid–solid ratio of 1:15, extraction time of 5 minutes, and ground leaves (<1 mm), where the protein yield is over 60%.
Author contributions
Morgana Kronbauer: investigation, writing – original draft. Ivan Shorstkii: conceptualization, data curation, formal analysis, writing – review & editing. Suse Botelho da Silva: conceptualization, data curation, formal analysis, writing – review & editing. Stefan Toepfl: funding acquisition, validation, supervision. Alica Lammerskitten: conceptualization, funding acquisition, project administration, writing – review & editing. Claudia Siemer: conceptualization, funding acquisition, project administration, writing – review & editing.Conflicts of interest
The authors M. Kronbauer, S. B. Silva, and I. Shorstkii declare they have no financial interests. S. Toepfl, C. Siemer, and A. Lammerskitten report a relationship with Elea Vertriebs- und Vermarktungsgesellschaft mbH that includes board membership and/or employment.Acknowledgements
The authors gratefully acknowledge the funding to the project (ZF4371003) provided by the Federal Ministry for Economic Affairs and Climate Action (BMWK) on the basis of a decision by the German Bundestag.References
- M. Ahmed Kk and S. Parsuraman, Syst. Rev. Pharm., 2014, 5, 6–8 CrossRef.
- L. Grauso, B. de Falco, V. Lanzotti and R. Motti, Phytochem. Rev., 2020, 19, 1341–1377 CrossRef CAS.
- G. Kutlu, F. Bozkurt and F. Tornuk, Int. J. Biol. Macromol., 2020, 162, 480–489 CrossRef CAS PubMed.
- B. C. Joshi, M. Mukhija and A. N. Kalia, Int. J. Green Pharm., 2014, 8(4), 201–209 CrossRef CAS.
- K. Movagharnejad, F. Vahdatkhoram and S. Nanvakenari, J. Therm. Anal. Calorim., 2019, 135, 1677–1685 CrossRef CAS.
- A. A. H. Said, I. S. El Otmani, S. Derfoufi and A. Benmoussa, Int. J. Pharm. Pharm. Sci., 2015, 7, 8–14 Search PubMed.
- Grandview Research, Protein ingredients market analysis by product, by application, and segment forecasts to 2020, https://www.grandviewresearch.com/industry-analysis/protein-ingredients-market Search PubMed.
- L. Rehder and K. Luxbacher, Plant-Based Food Goes Mainstream in Germany, 2023 Search PubMed.
- P. W. Baker and A. Charlton, Innovative Food Sci. Emerging Technol., 2020, 59, 102239 CrossRef CAS.
- Z. Li, Y. Fan and J. Xi, Food Chem., 2019, 277, 246–260 CrossRef CAS.
- F. A. Wani, R. Rashid, A. Jabeen, B. Brochier, S. Yadav, T. Aijaz, H. A. Makroo and B. N. Dar, Int. J. Food Sci. Technol., 2021, 56, 4823–4833 CrossRef CAS.
- M. Velusamy, A. Rajan and M. Radhakrishnan, Int. J. Food Sci. Technol., 2023, 58, 2021–2041 CrossRef CAS.
- S. Toepfl, C. Siemer and V. Heinz, in Emerging Technologies for Food Processing, Elsevier, 2nd edn, 2014, pp. 147–154 Search PubMed.
- S. Mahnič-Kalamiza, E. Vorobiev and D. Miklavčič, J. Membr. Biol., 2014, 247, 1279–1304 CrossRef.
- M. A. Maza, C. Pereira, J. M. Martínez, A. Camargo, I. Álvarez and J. Raso, Innovative Food Sci. Emerging Technol., 2020, 63, 102375 CrossRef CAS.
- O. Parniakov, E. Roselló-Soto, F. J. Barba, N. Grimi, N. Lebovka and E. Vorobiev, Food Res. Int., 2015, 77, 711–717 CrossRef CAS.
- S. Zhang, L. Sun, H. Ju, Z. Bao, X. an Zeng and S. Lin, Food Res. Int., 2021, 139, 109914 CrossRef CAS PubMed.
- D. E. Chafai, V. Sulimenko, D. Havelka, L. Kubínová, P. Dráber and M. Cifra, Adv. Mater., 2019, 31, 1903636 CrossRef PubMed.
- L. Zhang, L. J. Wang, W. Jiang and J. Y. Qian, LWT, 2017, 84, 73–81 CrossRef CAS.
- O. Parniakov, F. J. Barba, N. Grimi, N. Lebovka and E. Vorobiev, Food Chem., 2016, 192, 842–848 CrossRef CAS PubMed.
- M. Gagneten, G. Leiva, D. Salvatori, C. Schebor and N. Olaiz, Food Bioprocess Technol., 2019, 12, 1102–1109 CrossRef CAS.
- D. Frontuto, D. Carullo, S. M. Harrison, N. P. Brunton, G. Ferrari, J. G. Lyng and G. Pataro, Food Bioprocess Technol., 2019, 12, 1708–1720 CrossRef CAS.
- D. P. Jaeschke, G. D. Mercali, L. D. F. Marczak, G. Müller, W. Frey and C. Gusbeth, Bioresour. Technol., 2019, 283, 207–212 CrossRef CAS PubMed.
- O. Parniakov, F. J. Barba, N. Grimi, L. Marchal, S. Jubeau, N. Lebovka and E. Vorobiev, Innovative Food Sci. Emerging Technol., 2015, 27, 79–85 CrossRef CAS.
- A. Robin, M. Kazir, M. Sack, A. Israel, W. Frey, G. Mueller, Y. D. Livney and A. Golberg, ACS Sustain. Chem. Eng., 2018, 6, 13696–13705 CrossRef CAS.
- M. C. Alles, S. Smetana, O. Parniakov, I. Shorstkii, S. Toepfl, K. Aganovic and V. Heinz, Innovative Food Sci. Emerging Technol., 2020, 64, 102403 CrossRef CAS.
- S. Smetana, H. Mhemdi, S. Mezdour and V. Heinz, in Pulsed Electric Fields to Obtain Healthier and Sustainable Food for Tomorrow, Elsevier, 2020, pp. 247–266 Search PubMed.
- M. A. Maza, C. Delso, I. Álvarez, J. Raso and J. M. Martínez, LWT, 2020, 118, 108788 CrossRef CAS.
- X. Yu, O. Bals, N. Grimi and E. Vorobiev, Ind. Crops Prod., 2015, 74, 309–318 CrossRef CAS.
- F. J. Barba, N. Grimi and E. Vorobiev, J. Food Eng., 2015, 149, 222–228 CrossRef CAS.
- Association of Official Agricultural Chemists (AOAC), Official methods of analysis, 1975, vol. 222 Search PubMed.
- C. Siemer, S. Toepfl and V. Heinz, in Distillation: Advances from Modeling to Applications, InTech, 2012, pp. 211–232 Search PubMed.
- Thermo Fisher Scientific, User Guide: Pierce BCA Protein Assay Kit, 2020 Search PubMed.
- A. Bucić-Kojić, M. Planinić, S. Tomas, M. Bilić and D. Velić, J. Food Eng., 2007, 81, 236–242 CrossRef.
- I. Shorstkii, E. H. A. Mounassar, U. Bindrich, V. Heinz and K. Aganovic, Chem. Ing. Tech., 2022 DOI:10.1002/cite.202200034.
- D. Kregiel, E. Pawlikowska and H. Antolak, Molecules, 2018, 23, 1–21 CrossRef PubMed.
- T. T. Shonte, K. G. Duodu and H. L. de Kock, Heliyon, 2020, e03938 CrossRef PubMed.
- US FDA, A Food Labeling Guide, 2013, pp. 123–191 Search PubMed.
- M. P. Hojilla-Evangelista, G. W. Selling, R. Hatfield and M. Digman, J. Sci. Food Agric., 2017, 97, 882–888 CrossRef CAS PubMed.
- C. Y. Takeiti, G. C. Antonio, E. M. P. Motta, F. P. Collares-Queiroz and K. J. Park, Int. J. Food Sci. Nutr., 2009, 60, 148–160 CrossRef CAS PubMed.
- B. M. Adhikari, A. Bajracharya and A. K. Shrestha, Food Sci. Nutr., 2016, 4, 119–124 CrossRef CAS PubMed.
- L. K. Rutto, Y. Xu, E. Ramirez and M. Brandt, Int. J. Food Sci., 2013, 1–7 Search PubMed.
- D. Alemayehu, G. Desse, K. Abegaz, B. B. Desalegn and D. Getahun, Int. J. Food Sci. Nutr. Eng., 2016, 6, 55–61 Search PubMed.
- A. Paulauskienė, Ž. Tarasevičienė and V. Laukagalis, Plants, 2021, 10, 686 CrossRef.
- T. Varzakas and C. Tzia, Food Engineering Handbook: Food Engineering Fundamentals, 2014 Search PubMed.
- H. E. E. A. Elhag, A. Ajit and A. Z. Sulaiman, Mater. Today: Proc., 2020, 31, 1–8 CrossRef.
- B. Kumari, B. K. Tiwari, M. B. Hossain, D. K. Rai and N. P. Brunton, Int. J. Food Sci. Technol., 2017, 52, 1432–1439 CrossRef CAS.
- J. Raso, W. Frey, G. Ferrari, G. Pataro, D. Knorr, J. Teissie and D. Miklavčič, Innovative Food Sci. Emerging Technol., 2016, 37, 312–321 CrossRef.
- B. Chauhan and R. Gupta, Process Biochem., 2004, 39, 2115–2122 CrossRef CAS.
- Y. Li, Z. Chen and H. Mo, LWT--Food Sci. Technol., 2007, 40, 1167–1175 CrossRef CAS.
- Y. Zhou, Q. He and D. Zhou, J. Food Process. Preserv., 2017, 41(3), e12962 CrossRef.
| This journal is © The Royal Society of Chemistry 2023 |