
 Open Access Article
 This Open Access Article is licensed under a Creative Commons Attribution-Non Commercial 3.0 Unported Licence
Lamination of starch/polyesters by thermocompression for food packaging purposes
Carla I.
La Fuente Arias
 *ab,
Chelo
González-Martínez
a and
Amparo
Chiralt
a
*ab,
Chelo
González-Martínez
a and
Amparo
Chiralt
a
aUniverstitat Politècnica de València (UPV), Research Institute of Food Engineering for Development (IIAD), 46022, Valencia, Spain. E-mail: carla_lfa@hotmail.com
bUniversidade de São Paulo, Escola Politécnica, Department of Chemical Engineering, Main Campus, São Paulo, SP 05508-010, Brazil
First published on 15th February 2023
Abstract
Multilayer films were obtained by thermocompression to produce laminates that better-fit food packaging requirements. Films of glycerol-plasticised corn starch, both non-modified and modified by dry heating (DH) and PHBV films containing 0, 10 or 20% PEG 1000 were combined in bilayer associations with amorphous PLA sheets. Starch–PLA–PHBV tri-layers were also obtained and characterised as to their functional properties. The surface tension of the different polymer films was determined to estimate each polymer pair's adhesion work, which was not well correlated to the experimental seal strength. DH starch modification markedly reduced (95%) the water vapour permeability (WVP) of starch films while PEG weakened the strength of PHBV films and greatly increased their oxygen permeability (OP). Lamination with PLA reduced (85%) the WVP of non-modified starch while increased the tensile strength (183 and 196%) and decreased the elongation at break (25 and 22%) of the non-modified and DH starch films. Nevertheless, PLA–PHBV laminates and tri-layers did not exhibit significantly improved properties as compared to the non-plasticised PHBV monolayers. The interlayer migration of plasticisers, including the water present in starch films, altered the expected tensile and barrier properties of multilayers.
Introduction
The quantity of materials used for packaging is growing continuously, and if current consumption patterns and waste management practices do not improve by 2050, there will be around 12 billion tons of plastic litter.1 In the last few years, academia and the industry have been looking for suitable solutions to the environmental problems caused by the increasing use of conventional plastics. In this sense, developing bioplastic-based packaging is one alternative means of reducing the use of conventional non-biodegradable plastics made from petrochemicals.It is well known that plastics made from a single biopolymer rarely have a competitive edge over synthetic films, which limits their applications. Likewise, most of the current packaging materials are made up of several layers to better meet packaging requirements. This strategy has also been applied to biodegradable polymers to obtain laminates with better barrier and mechanical performance. In many studied laminates, different biodegradable polymer layers with complementary barrier properties were combined. This was done using both polar polymers, such as thermoplastic starch (TPS), which are water sensitive but possess great oxygen barrier capacity, and also non-polar polymers with low water vapour permeability, such as poly(lactic acid) (PLA),2 poly(3-hydroxybutyrate-co-3-hydroxyvalerate) (PHBV)3,4 or poly(ε)caprolactone (PCL).5 These studies pointed to the adhesion of the layers as one of the most important challenges to overcome when developing multilayer systems. To ensure good interlayer adhesion, the critical aspect that has to be controlled is polymer compatibility,6 and the surface energy of polymers is one of the main factors governing interfacial adhesion.6,7 Some studies have reported the surface tension values of PLA, PHBV and starch films,6,8,9 but a great variation in these values can be found, depending on the film production and the method used to obtain the surface properties. Likewise, few studies have analysed the correlation between the interfacial tension and adhesion ability of the polymers.10
Moreover, the influence of the multilayer assembly on the mechanical and barrier characteristics of the laminates has also scarcely been studied in the case of biodegradable polymers. In fact, the use of modified starch, with modulated properties, in advanced multilayer materials has not been evaluated. However, recent studies have analysed monolayers produced with modified starch by a simple green technique called dry heating (DH) at 130 °C for 2–4 h, producing starch-based materials with improved properties.11,12
Therefore, in the present study, the process of lamination using the thermocompression of polar (starch and DH modified starch) and non-polar (PLA and PHBV) biodegradable polymers was evaluated through the analysis of the surface energy of the films and the adhesion work in bilayers as well as the seal strength. The tensile and barrier properties of the mono, bi- and tri-layer films were also analysed to determine the best combination of polar and non-polar films in the multilayer assembly.
Materials & methods
Materials
Corn starch was supplied by Roquette (Roquette Laisa, Benifaió, Spain). Poly(3-hydroxybutyrate-co-3-hydroxyvalerate) (PHBV) was supplied by Helian Polymers B. V. (Belfeld, Holland) and amorphous poly-lactic acid (PLA) 4060D, the density of 1.24 g cm−3 was supplied by Natureworks (USA). Poly(ethylene glycol) with 1000 D molecular weight (PEG1000) was purchased from Sigma-Aldrich (Steinheim, Germany), and glycerol was obtained from Panreac Química S. L. U. (Castellar del Vallés, Spain). For sample conditioning purposes, phosphorus pentoxide (P2O5) and magnesium nitrate-6-hydrate (Mg (NO3)2) were supplied by Panreac Química, S. A. (Castellar del Vallès, Spain). The solvents for surface energy analyses were heptane (Sigma Aldrich, Spain), dimethyl sulfoxide (DMSO) and methanol (Panreac Química S. A., Spain).Starch modification
Samples of 50 g of corn starch were spread on aluminium foil (30 × 30 cm2) and dried in a hot-air convective oven (JP Selecta, Spain) at 130 °C for 4 h following the methodology proposed by La Fuente.12 The modified starch (DH) was then cooled, ground, sieved (250 μm), packaged, and stored at 25 °C, until further use.Film preparation
Three kinds of monolayer films were prepared: glycerol-plasticised starch films using non-modified or DH starch, PHBV films plasticised with different ratios of PEG 1000 and amorphous PLA films. Firstly, the blends were prepared by melt blending using an internal mixer (HAAKE™ PolyLab™ QC, Thermo Fisher Scientific, Germany). Starch (non-modified and DH) and glycerol (30 g/100 g of starch) were blended at 130 °C and 50 rpm for 10 min. PHBV and PEG1000 at 0, 10 and 20 g/100 g polymer (PBHV_0; PHBV_10 and PHBV_20 samples) were blended at 170 °C and 50 rpm for 12 min. The starch and PHBV blends were cold milled in the IKA mill (M20, IKA Werke, Germany). The starch powders were conditioned at 25 °C and 53% RH using an Mg (NO3)2 over-saturated solution for 7 days before compression moulding.All the films were obtained in a hot-plate hydraulic press (model LP20, Labtech Engineering, Thailand). For the starch films (non-modified or DH), 4 g per film were used, whereas 2.5 and 3 g, respectively, were used in PLA and PHBV films. The polymer sample was placed onto the PTFE sheet mould in the press and pre-heated, then thermo-compressed and finally cooled to 70 °C for 3 min by fitting the process conditions empirically based on previous studies.4 For both starch films (non-modified and DH), there was a preheating step for 5 min at 150 °C and two-step thermocompression at 150 °C: 30 bars for 2min + 130 bars for 6 min. The amorphous PLA pellets were pre-heated at 200 °C for 4 min and thermo-compressed at 200 °C and 100 bars for 4 min. The PHBV powders with the different quantities of PEG 1000 were pre-heated at 180 °C for 5 min and compressed at 180 °C and 100 bars for 4 min.
Bilayer film components were designed to combine polar and non-polar polymer sheets, taking advantage of their complementary barrier properties. However, no practical adhesion was obtained for starch or PHBV at any of the plasticiser concentrations, so starch (non-modified or DH) was only combined with PLA films. To analyse the potential benefits of PHBV and PLA laminates, PLA/PHBV bilayers were also obtained using different PEG concentrations in the PHBV film. Likewise, starch (non-modified or DH)/PLA/PHBV tri-layer films (with varying amounts of PEG1000) were also obtained and characterised. For the layer adhesion, the different film combinations were pre-heated at 110 °C for 3 min and compressed at 110 °C and 30 bars for 1 min, afterwards cooling for 3 min to 70 °C. These conditions were empirically fitted based on preliminary tests and polymer characteristics in order to obtain homogeneously thermo-adhered multilayer films.
All the films were conditioned at 25 °C and 53% RH (Mg (NO3)2) for 7 days before characterisation.
Analyses of the surface energy of the films
The sessile drop method was used to measure the contact angle (θ) between solvents (selected on the basis of their different polarity:6,14 distilled water, dimethyl sulfoxide (DMSO), methanol, and heptane) and the surface of the obtained films following the ASTM D7334-08 standard method.13 The measurements were taken with a dynamic contact angle measuring device (OCA 20 instruments, Dataphysics, Germany) in a contact time of under 10 s to prevent solvent diffusion in the film at 22 °C. At least ten replicates were taken for each film sample and solvent.From the values of contact angles and the dispersive and polar components of the surface tension of the solvents, the film's surface tension was calculated, considering the theoretical model. Young's equation correlated the contact angle and interfacial tensions, as described in eqn (1).
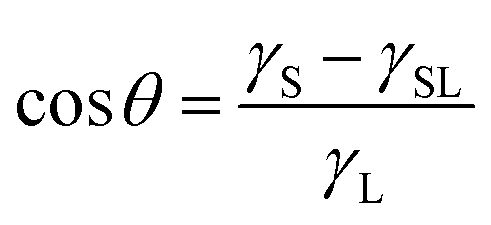 | (1) |
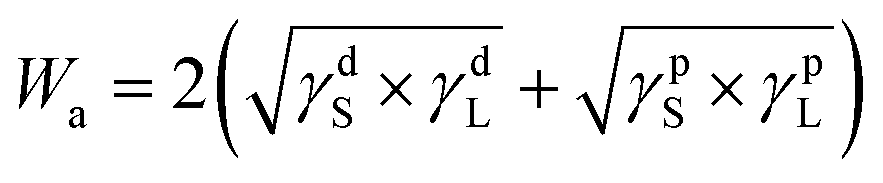
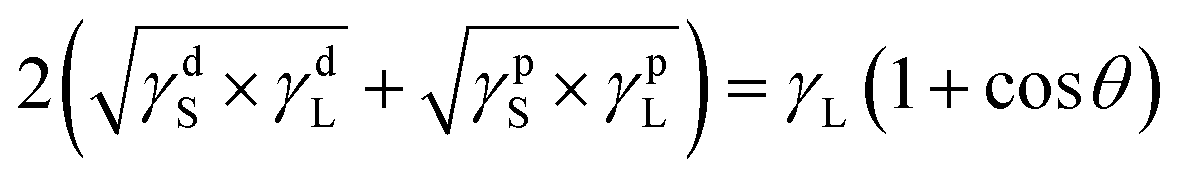
Moreover, the adhesion work (Wa) can be described by the Young–Dupré equation (eqn. (2)) in terms of the liquid contact angle and its surface tension. While the Owens and Wendt equation relates the adhesion work with the dispersive and polar components of the liquid and solid surface tension (eqn (3)).
Wa = γL(1 + cos![[thin space (1/6-em)]](https://www.rsc.org/images/entities/char_2009.gif) θ) θ) | (2) |
 | (3) |
| Sample | Water γL = 72.1 mN m (γDL = 19.9 and γpL = 52.2) | Methanol γL = 22.5 mN m (γDL = 18.2 and γpL = 4.3) | Heptane γL = 20.1 mN m (γDL = 20.1 and γpL = 0.0) | DMSO γL = 44.0 mN m (γDL = 36.0 and γpL = 8.0) |
|---|---|---|---|---|
| a Means with different superscript letters in the same column are significantly different (p < 0.05). | ||||
| Non-modified starch | 89 ± 5.0a | 8.0 ± 3.0b | 3.0 ± 2.0a | 55 ± 8.0a |
| DH starch | 78 ± 11b,c | 23 ± 5.0a | 0.0 ± 0.0a | 51 ± 13a,b |
| PHBV_0 | 78 ± 5.0b,c | 22 ± 5.0a | 2.0 ± 1.0a | 31 ± 5.0d |
| PHBV_10 | 74 ± 8.0b,c | 27 ± 4.0a | 2.0 ± 2.0a | 38 ± 6.0b,c,d |
| PHBV_20 | 69 ± 6.0c | 22 ± 8.0a | 3.0 ± 2.0a | 33 ± 5.0c,d |
| PLA | 82 ± 6.0a,b | 25 ± 5.0a | 3.0 ± 2.0a | 45 ± 14a,b,c |
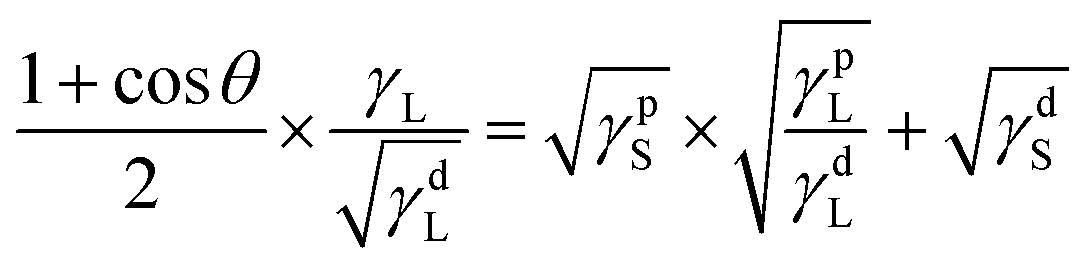
Combining eqn (2), (3) and (4) was obtained and then rearranged as eqn (5):
 | (4) |
 | (5) |
Thus, the polar (γpS) and dispersive (γdS) components of solid surface tension could be obtained by plotting the values of the dependent variable vs. the independent variable  , both calculated from the experimental values of cosθ of the different solvents with known values of γL,γDL, and γpL.
The estimation of the critical surface tension (γC) of the different monolayer films was determined by the extrapolation method of the Zisman plot,15 where the surface tension values of the solvents were plotted vs. the respective cosθ and the surface tension value for cosθ = 1.
Characterisation of the seal strength in layers
Different film strip binary combinations were thermo-sealed along one edge using the same thermo-compression conditions used in the bilayer preparation. The dimensions of the film strips were 7.62 × 2.54 cm2 and were sealed in an area of 2 × 2.54 cm2. All of the sealed strips were conditioned at 25 °C and 53% RH (Mg (NO3)2) for 48 h before the analyses.The seal strength was determined following ASTM F88/F88M-15 (ref. 16) in 10 strips per combination using a universal testing machine (Stable Micro Systems, TA. XT plus, England). The non-sealed edges of the sample were fixed to each clamp, with a distance between the clamps of 50 mm, and submitted to an extensive test at 200 mm min−1. The seal strength was determined according to eqn (6) using the mean force calculated in 80% of the total force vs. distance curve, as described in the standard method.
 | (6) |
The seal separation mode and the mean break distance were also determined in the cases of delamination failure.
Tensile properties of the mono and multilayer films
The film thickness was determined at five random positions using a digital micrometre (precision of 0.001 mm). A universal testing machine (Stable Micro Systems, TA XT plus, England) was used to determine tensile strength at break (TS), elongation at break (E), and elastic modulus (EM), following ASTM D882.17 At least eight samples with dimensions of 25 × 10 mm2 were evaluated for each formulation. The grip separation was initially 50 mm, and the crosshead speed was 50 mm min−1.Barrier properties
The water vapour permeability (WVP) was determined, in triplicate, using the gravimetric method following ASTM E96/E96M18 and the correction proposed by Mchugh.19 The film samples (Ø = 3.5 cm) were placed in Payne permeability cups filled with 5 mL of distilled water (100% RH). Then, the cups were placed into desiccators containing Mg (NO3)2 over-saturated solution (53% RH) and weighed every 1.5 h in an analytical balance (ME36S, Sartorius, ±0.00001 g).The oxygen permeability (OP) of the films was determined, in duplicate, at 25 °C and 53% RH using OxTran equipment (model 1/50, Mocon, Minneapolis, MN, USA) according to ASTM D3985-05.20
Statistical analyses
The experimental data was evaluated through a Multifactor Analysis of Variance (ANOVA), applying Tukey's test (p < 0.05) through Statgraphics Centurion XV software (StatPoint, Inc., USA).Results and discussion
The surface energy of the films
The surface properties of the different monolayer films were analysed to understand their adhesion behaviour better, Table 1 shows the contact angle values of the different films in contact with different solvents. The highest water contact angle value was obtained for non-modified starch films. This was an unexpected result given the hydrophilic nature of the polymer, which could promote a more significant extension of liquid water onto the film surface. Nevertheless, the contact angle is also greatly affected by the surface roughness, whose effect is very difficult to evaluate.21 Similar values for the water contact angle of non-modified starch were reported by Biresaw & Carriere.6 DH starch films exhibited slightly lower values, reflecting the effect of the modification process, which is attributed to the depolymerisation and oxidation of the starch molecules, producing carbonyl groups that modifies the chain interactions and their re-association tendency22 affecting the surface properties of the starch films. Lower values of the contact angles were also observed for DH cassava starch films obtained by extrusion compared to non-modified starch films. In contrast, the opposite effect was observed in solvent-cast films.12 Other authors also reported different contact angles for starch films, which heavily depended on the film processing method and how the molecules rearranged at the surface level.6,23 As concerns the water contact angle of polyesters, similar values for PHBV8 and PLA9,24 were previously reported. The incorporation of PEG 1000 into PHBV films reduced the water contact angle values; this effect is significant (p < 0.05) when using 20% plasticiser, as previously observed by other authors.25,26In the case of methanol, the lowest contact angle was observed for the non-modified starch films, while no significant differences were observed for the other materials. Likewise, no significant differences in heptane contact angles were observed for the different films. The highest value of the DMSO contact angles were those in the non-modified starch films and the lowest in the PHBV_0. Similar values were reported by other authors for the DMSO contact angles with PLA and PHBV films.6 Consequently, the contact angle values for different solvents with polymer films exhibited, in general, a relatively wide range since these are greatly affected both by the film processing method as well as by the method used for their measurement.6
Fig. 1 shows the Zisman plot for the different films, from which the critical surface tension (γC) was estimated by applying the fitted straight-line equations to cos θ = 1 (r2 > 0.9), γC corresponds to the minimal surface tension of the liquid to completely wetting the film surface27 and could be of interest for the purposes of coating the films with liquid phases. As shown in Table 2, slight differences were observed between the different materials; the highest value belonged to the PHBV_0, a small decrease was regarded as a result of the addition of PEG 1000, while the lowest value corresponded to the DH starch. Rhim & Hong28 reported similar values for PLA and PHBV films while comparing starch films, higher values (30–45 mN m−1) were reported for extruded potato starch films29 and wheat starch films (34 mN m−1) obtained by casting.30 Once again, and as commented above for the contact angles, the different film processing methods and the contact angle measurement method can explain the differences in the reported values for a determined polymer.
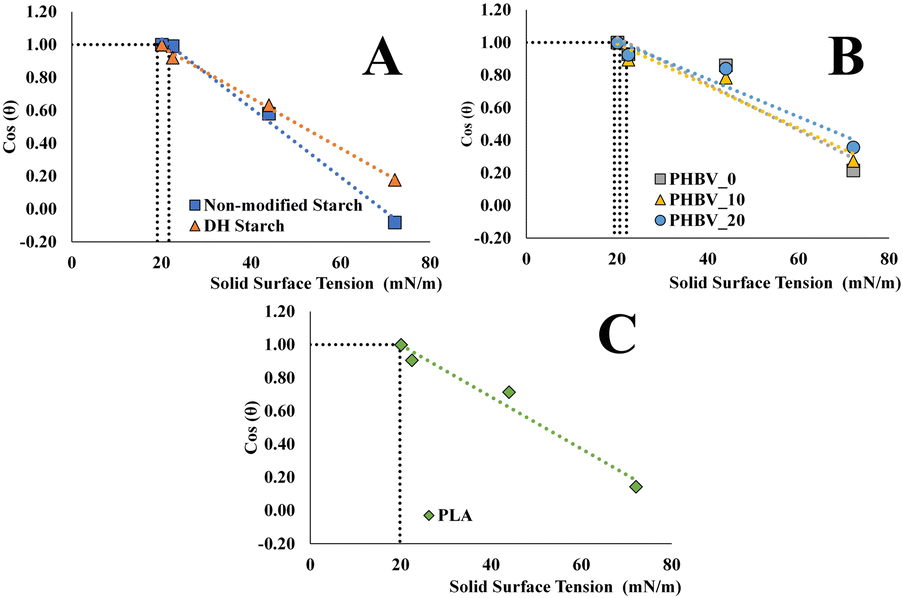 | ||
| Fig. 1 Zisman plot for non-modified and DH starches (A) PHBV plasticised with differing concentrations of PEG 1000 (B) and PLA (C) monolayer materials. | ||
| Sample | Dispersive component (γDS) mN m−1 | Polar component (γpS) mN m−1 | Solid surface tension (γS) mN m−1 | Critical surface tension (γC) mN m−1 |
|---|---|---|---|---|
| Non-modified starch | 20.0 | 5.5 | 25.5 | 21.3 |
| DH starch | 17.0 | 12.0 | 29.0 | 19.0 |
| PHBV_0 | 19.5 | 11.0 | 30.5 | 22.0 |
| PHBV_10 | 17.7 | 13.5 | 31.2 | 19.4 |
| PHBV_20 | 17.3 | 16.8 | 34.1 | 20.6 |
| PLA | 18.6 | 9.0 | 27.6 | 19.9 |
In Fig. 2, the fitted equations (calculated by eqn (5)) used to estimate the values of the polar and dispersive components of the solid surface tension are presented. The obtained values of solid surface tension and polar and dispersive components are also shown in Table 2. It could be observed relatively slight differences for the different materials. PHBV films exhibited the highest surface energy values, whereas an increase in the polar component was observed when the PEG 1000 concentration was increased. This effect was also observed by Cheng31 and can be explained by the more polar nature of this plasticiser, similar values were reported by Hedrick6,7 while Mofokeng & Luyt32 reported slightly higher values.
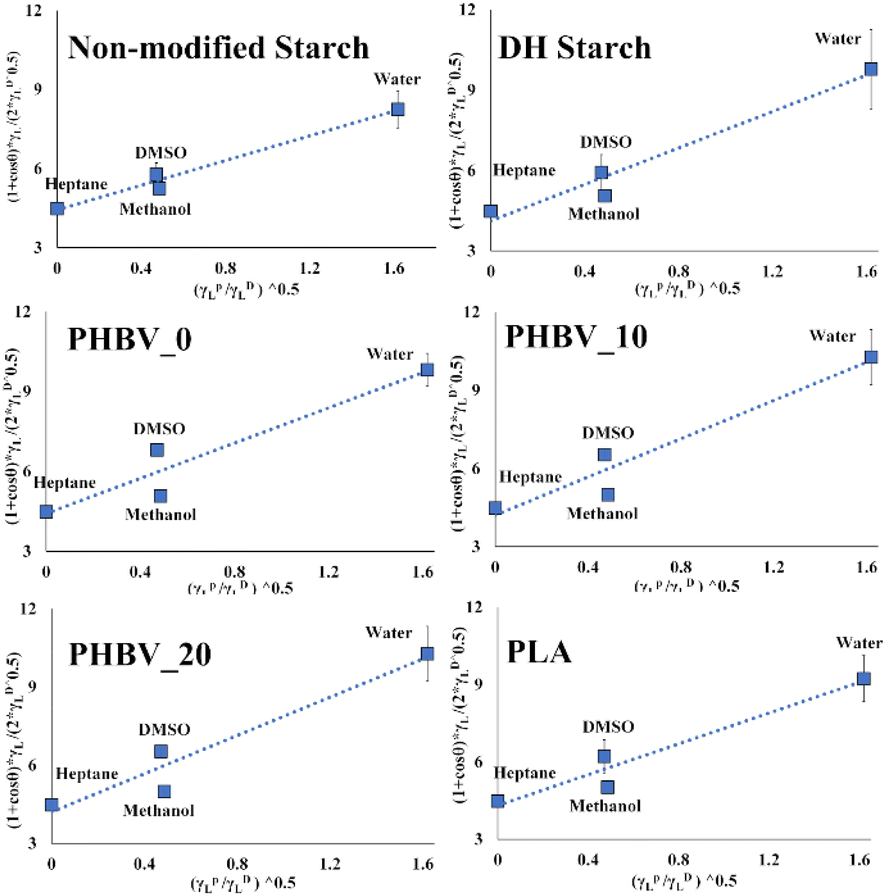 | ||
| Fig. 2 Plot and fitted straight lines to calculate polar and dispersive components of the surface tension in the different films. | ||
Moreover, the starch modification resulted in an increase in the solid surface tension as compared to the non-modified starch film. Specifically, an increase in the polar component was observed in comparison to the non-modified starch film. Literature reported values for starch films in the range of 30–60 mN m−1, depending on the processing method, with great variability in the polar component (0.3–25 mN m−1),6,30 while in this study, lower surface energy was obtained in the case of the starch film, with intermediate values of the polar component.
Based on the surface energy parameters obtained and the contact angle values of each polymer–solvent system, the polymer pair interfacial tension (γp1p2) and the interlayer adhesion work in the bilayer assemblies were determined by applying eqn (7) and (8), respectively, as described by Biresaw and Carriere.6
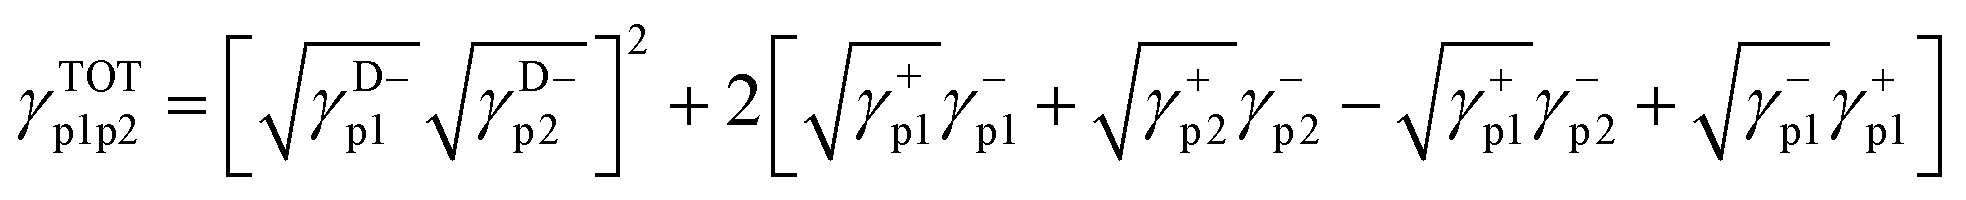 | (7) |
| Wa = γTOTp1 + γTOTp2 − γTOTp1p2 | (8) |
The γ+ and γ− components of each polymer (p1 and p2) were determined by the solution of the simultaneous equation obtained by the contact angle and the surface energy parameters (γL, γDL, γ+L and γ−L) of two probe liquids being imputed into eqn (9). To this end, water and DMSO solvents were considered, whose γ+and γ− values are known (γ+= 25.5 and γ− = 25.5 for water and γ+= 0.5 and γ− = 32 for DMSO).6
| [γ+pγ−L]0.5 + [γ−pγ+L]0.5 = 0.5[A − B] | (9) |
θ] and B = 2[γDpγDL]0.5.
The interfacial tension values obtained for the different polymer pairs were very low (γp1p2 < 0.5 mN m−1), and, therefore, the adhesion work (eqn (8)) for each polymer pair is practically the sum of the corresponding surface tensions. These values are shown in Table 3, with the seal strength values discussed in the next section. In this sense, it is important to point out again that no starch–PHBV adhesion could be achieved in practice (in reasonable thermocompression conditions) despite the high values obtained for the adhesion work in the different starch–PHBV combinations (55–62 mN m−1). However, the values reported for the other polymers pairs are in the same range as those of non-thermo-sealable starch–PHBV pairs (Table 3), which suggests that this parameter did not determine the effective adhesion of the different layers by thermocompression.
| Sample | Sealing strength (N m−1) | Mean distance of break (m) | Interfacial tension (γp1p2, mN m−1) | Adhesion work (mN m−1) |
|---|---|---|---|---|
| a Means with different lowercase letters in the same column are significantly different, and means with different capital letters in the same column are significantly different (p < 0.05) for the PHBV bilayer formulations. *Maximum force in the total curve was used to calculate the sealing strength. | ||||
| Non-modified starch–PLA | 39.0 ± 10a | 0.030 ± 0.010b | 0.017 | 53 |
| DH starch–PLA | 50.0 ± 9.0a | 0.040 ± 0.004a | −0.140 | 57 |
| PHBV_0–PLA | 9.0 ± 2.0b,A,B | — | 0.154 | 58 |
| PHBV_10–PLA | 4.3 ± 0.2b,A | — | −0.030 | 59 |
| PHBV_20–PLA* | 12.0 ± 5.0b,B | 0.009 ± 0.002c | 0.500 | 61 |
Thermo-adhesion properties between layers
Fig. 3 shows the typical force vs. distance curves for the separation profile of the different sealed monolayers (non-modified and DH starches, PHBV_0, PHBV_10 and PHBV_20) with the PLA films, and the layer separation behaviour, as described in standard ASTM F88/F88M-15.16 In Table 3, the values of the seal strength of different bilayer combinations are shown, indicating the mean break distance for the cases of delamination. The values obtained were near to what was reported for thermo-sealed glycerol-plasticised sago starch.33 Heidemann9 also reported similar values for cassava starch sealed with PLA, whereas other studies34,35 reported higher values for starch–PLA seals. The differences could be attributed to the different sealing conditions and polymer characteristics. Under the sealing conditions used, DH starch tends to show greater sealing strength with PLA than non-modified starch, as also observed for the estimated adhesion work. Likewise, both samples exhibited delamination, thus indicating that strong adhesion forces are established between both polymers leading to the fracture of the starch layer and no net layer separation. Leong36 established that delamination, rather than adhesive peeling, indicates a strong interfacial bonding of the films. DH starch breaks at a greater extension distance in the delamination process, which also points to different interfacial interactions of DH starch chains with PLA and greater resistance to the break of this film. Other studies also observed an excellent adhesion of starch–PLA10 concerning other polyesters, which was attributed to the weaker tendency of PLA to self-association and lower crystallinity. In the laminates under study, PLA is an amorphous polymer containing a fraction of low molecular oligomers,2 which may contribute to an increase in its polarity and a chemical affinity with starch molecules at the interface.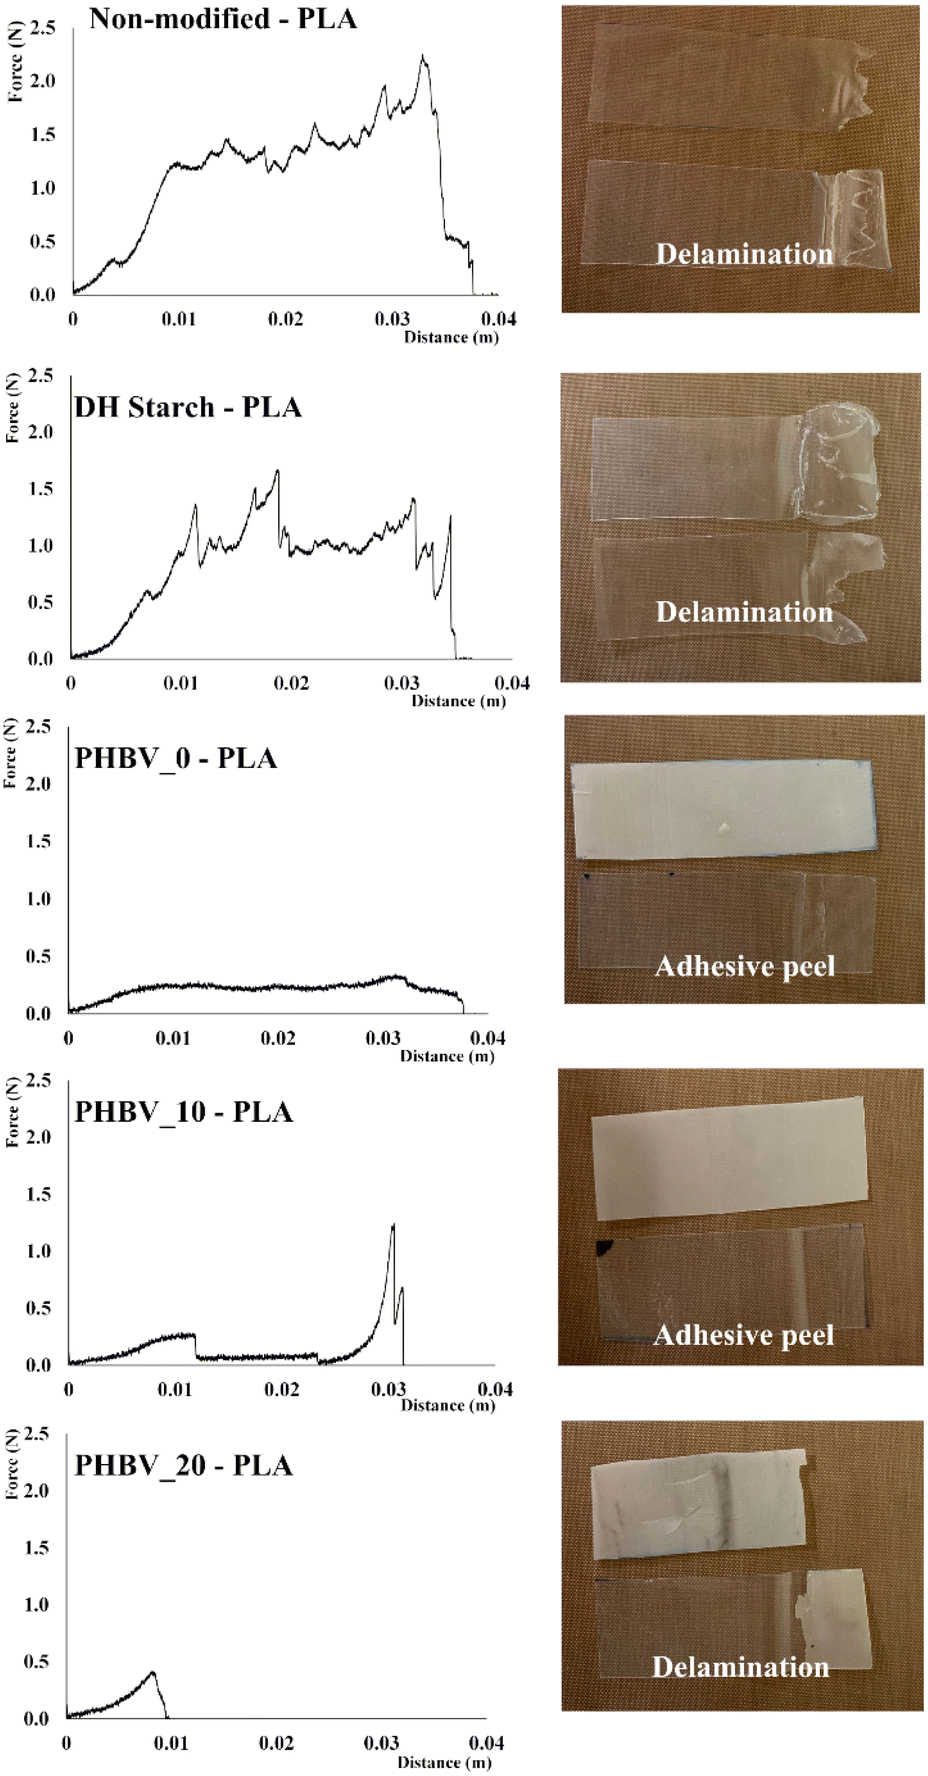 | ||
| Fig. 3 Typical behaviour of the seal profile and the image of the separation mode of the different bilayers (non-modified starch–PLA, DH starch–PLA, PHVB_0–PLA, PHVB_10–PLA and PHVB_20 PLA) during the sealing strength test. | ||
In the case of PHBV–PLA laminates, the sealing strength values were significantly lower than those of starch–PLA bilayers and differences in both sealing strength and layer separation behaviour were observed due to the PEG concentration. PHBV films with 0 and 10% PEG behaved as adhesive peels; in contrast, 20% PEG promoted the break of the PHBV layer before the complete separation of the seal; this suggests that the adhesion force between layers was greater than the PHBV_20 tensile resistance. The notable increase in polarity of PHBV_20, reflected in the surface properties, favoured the adhesion force with the PLA film. Other authors reported that PEG could act as a compatibilizer between PLA–PHBV, increasing the polymer's adhesion ability.37,38 The estimated adhesion work also increased when the PEG concentration rose in the PHBV film; however, these values were in the range of those obtained for starch–PHBV laminates, where no effective adhesion was obtained. Therefore, this indicates that other factors also contribute to the sealing force in the polymer multilayers, and an overall understanding of the observed phenomena has not yet been achieved.10 One important aspect is that the surface properties at the high thermo-sealing temperature could differ from the values obtained at a lower temperature. Likewise, at the high sealing temperature, the polymer viscoelasticity and the surface roughness would play important roles.
Mechanical and barrier properties of mono, bi and tri-layer films
Table 4 shows mono and bilayer films' mechanical and barrier properties, along with the respective thicknesses. The starch films were thicker than the polyester films, coherent with the lower mass of polyesters per surface area and their greater flowability.4 The film extension during thermocompression was affected by the viscosity of the polymer under the process conditions and the mass of pellets used in each case. Regarding the tensile parameters, no significant differences were observed for non-modified or DH starch, although the latter tended to be slightly stiffer (higher elastic modulus EM) and more resistant to break (higher TS). The polyesters had higher values of TS and EM and lower values of elongation at break (E) compared to the starch films, as previously reported. The obtained tensile parameters of the film monolayers are in the range of those previously reported for the same polymers.3,4,11,37,39 In the case of PHBV, a decrease in the TS and EM values was observed due to the plasticising effect of the PEG1000, although no increase in the film stretchability was observed, as reported by other authors.37,39| Sample | Thickness (μm) | TS (MPa) | E (%) | EM (MPa) | WVP (g mm kPa−1 h m2) | WVTR (g m−2 day−1) | OP × 1012 (cm3 m−1 s Pa) | OTR (cm3 m−2 day−1) |
|---|---|---|---|---|---|---|---|---|
| a Means with different lowercase letters in the same column are significantly different (p < 0.05). | ||||||||
| Monolayers | ||||||||
| Non-modified starch | 185 ± 20a | 6.0 ± 1.0e | 20.0 ± 3.0a | 147 ± 30c | 6.00 ± 1.00a | 1453 ± 166a | 0.092 ± 0.003c | 4 ± 1.0c |
| DH starch | 200 ± 20a | 6.4 ± 0.4e | 23.0 ± 4.0a | 193 ± 30c | 0.30 ± 0.01b | 48 ± 1.0b | 0.086 ± 0.007c | 4 ± 0.1c |
| PHBV_0 | 140 ± 1b | 32.0 ± 3.0b | 2.0 ± 0.2b | 2013 ± 130a | 0.04 ± 0.01b | 11 ± 2.0b | 0.160 ± 0.001c | 11 ± 0.5c |
| PHBV_10 | 133 ± 2b | 21.0 ± 1.0c | 2.0 ± 0.2b | 1412 ± 120b | 0.23 ± 0.01b | 71 ± 4.0b | 1.800 ± 0.500b | 115 ± 30b |
| PHBV_20 | 123 ± 7b | 16.0 ± 2.0d | 1.5 ± 0.2b | 1306 ± 120b | 0.21 ± 0.05b | 59 ± 16b | 4.400 ± 0.600a | 306 ± 54a |
| PLA | 133 ± 2b | 37.0 ± 1.0a | 3.0 ± 0.6b | 2133 ± 90a | 1.13 ± 0.03b | 39 ± 5.0b | 1.800 ± 0.100b | 121 ± 8.0b |
|
||||||||
| Bilayers with PLA | ||||||||
| Non-modified starch | 323 ± 10a | 17 ± 1d | 5.0 ± 1.0a | 1160 ± 70e | 0.88 ± 0.20b | 99 ± 27b,c | 0.229 ± 0.008c | 6.0 ± 0.2c |
| DH starch | 301 ± 11a | 19 ± 1d | 5.0 ± 1.0a | 1327 ± 70d | 0.44 ± 0.04c | 46 ± 4.0c | 0.230 ± 0.006c | 7.0 ± 0.1c |
| PHBV_0 | 253 ± 6.0b | 42 ± 2a | 3.0 ± 0.2b | 1852 ± 60a | 0.65 ± 0.20b,c | 96 ± 30b,c | 0.330 ± 0.050c | 13 ± 2.0b |
| PHBV_10 | 240 ± 4.0c | 36 ± 1b | 3.0 ± 0.2b | 1740 ± 20b | 0.82 ± 0.15b | 126 ± 23b | 0.460 ± 0.040b | 18 ± 2.0b |
| PHBV_20 | 243 ± 6.0c | 31 ± 1c | 2.2 ± 0.2c | 1622 ± 30c | 2.02 ± 0.01a | 347 ± 25a | 0.706 ± 0.002a | 30 ± 2.0a |
As expected, the starch films exhibited the highest values of water vapour permeability (WVP) and water vapour transmission rate (WVTR); however, a marked reduction in this property was promoted by the DH modification process, as also reported by other authors analysing corn and cassava starch films.11,12 The DH treatment affects the molecular interaction, favouring the tendency towards molecular re-association22 due to the hydrogen bonds between the formed carbonyl and hydroxyl groups,40 which modify the water interactions with the polymer. Lower values of WVP and WVTR were observed for all polyester materials, where the incorporation of PEG reduced the water vapour barrier capacity of the PHBV films; this was expected as the increase in the matrix polarity and molecular mobility promotes both the solubility and diffusion of water molecules in the matrix and, so, the permeation rate. The values obtained are in the range of those previously reported by other authors.4,41 The oxygen permeability (OP) and oxygen transmission rate (OTR) were lower in the case of starch films, as previously reported,3,4 and no significant differences were observed for either non-modified or DH starch. In contrast, the polyesters exhibited a lower oxygen barrier capacity, especially PLA and PEG-plasticised PHBV. Similar values for these polymers were previously found.3,4
The bilayer combination of starch and PLA improved tensile properties compared to those of the starch films but exhibited lower tensile parameters than PLA monolayers. In particular, the EM was reduced by 38% (with non-modified starch) or 45% (with DH starch) concerning net PLA, and the TS was decreased by about 50%, although the bilayers were slightly more extensible than the PLA films. These results suggested that the mechanical performance of PLA was poorer in the bilayer with starch, which may be attributed to the partial hydrolysis of PLA during thermocompression as a result of water migration from the starch sheet, as previously observed in other studies.4,42 However, bilayers exhibited much better mechanical performance than starch films despite this.
Concerning the polyester assemblies (PLA–PHBV bilayers), the increase in the PEG concentration reduced the TS of the bilayers, as occurred in the PHBV monolayers, and, when present at 20%, it reduced the TS to values below those of the most resistant PLA monolayer. This suggests that the PEG migrated into the PLA sheet, reducing its mechanical resistance in the bilayer.
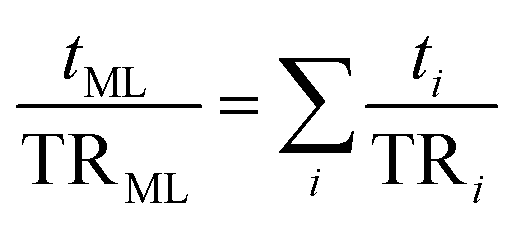
The theoretical estimation of WVTR and OTR, assuming the parallel resistances offered by the layers to the perpendicular mass transfer flow (eqn (10)), gave rise to predicted values of WVTR and OTR, as shown in Fig. 4.
 | (10) |
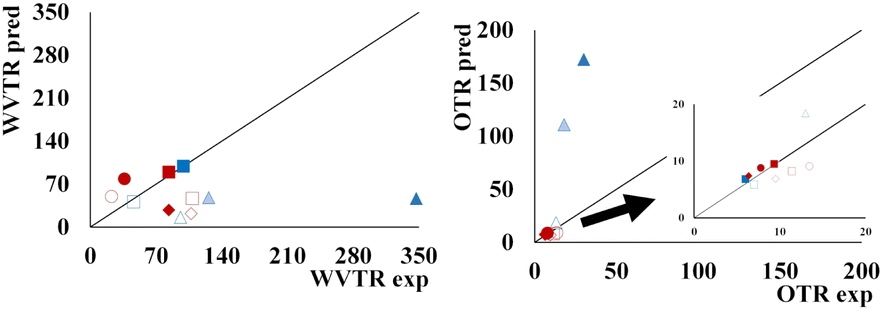 | ||
| Fig. 4 Predicted vs. experimental values of WVTR and OTR for different bilayers (blue symbols). Squares represent PLA–starch – full for DH starch and empty for non-modified. Triangles represent PLA–PHBV, with the blue becoming darker as the PEG increased. For tri-layers (red symbols), rhombus represents 0% PEG, squares 10% PEG and circles 20% PEG with non-modified starch full symbols and DH empty symbols. | ||
Regarding the WVTR and apparent WVP for starches-PLA bilayers, values were much lower compared to non-modified starch films. The OP and OTR were significantly reduced concerning the PLA films, thus improving the overall barrier capacity of the materials (Table 4). This indicates that both PLA and starch sheets exhibited their initial barrier capacity in the bilayer despite the above mentioned hydrolysis effect of the PLA deduced from the tensile behaviour. While for PLA–PHBV bilayers, the experimental values of WVTR were higher than predicted, whereas the OTR experimental values were, in general, closer to the predicted ones, except for samples with PEG, in which the predicted values were much higher. The migration of PEG from the PHBV into the PLA sheet could enhance the PHBV oxygen barrier capacity (made markedly worse by PEG) while promoting the water vapour mass transfer in the bilayer. Moreover, the migration of oligomers from the PLA into the PHBV layers could also contribute to the differences in the theoretical and experimental values of the bilayer barrier properties. Previous studies also reported the influence of the interlayer compound migration on the barrier capacity and mechanical performance of bilayer films.4,42
Therefore, the comparison between PLA–starch bilayers and PLA–PHBV bilayers indicates that the latter exhibited greater resistance to break. At the same time, the water vapour and oxygen barrier capacities were decreased when the PEG concentration rose in the PHBV sheet. Thus, the inter-layer adhesion was different, which could affect the assembly's stability. Therefore, the strength of both layer sealing and film properties throughout time must be studied to identify other possible differences.
Fig. 5 shows the properties of the tri-layer materials, including their thickness, which was very similar for all the laminates. Regarding the mechanical properties, the EM ranged between 1000–1200 MPa while tending to decrease when the PEG concentration rose in the PHBV layer, without any significant differences between samples containing different starch films. Similar behaviour can be observed for the TS that ranged between 17–24 MPa, while showed slightly higher values when there was a layer of DH starch in the tri-layer.
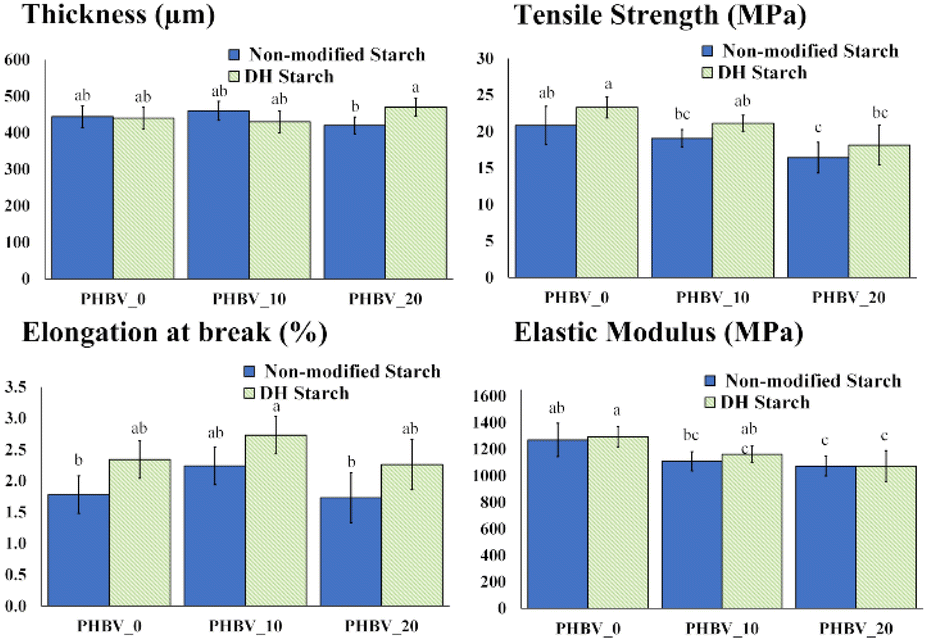 | ||
| Fig. 5 Thickness, tensile strength (TS), elongation at break (E) and elastic modulus (EM) for starch/PLA/PHBV tri-layer materials. Means with different letters are significantly other (p < 0.05). | ||
The stretchability values ranged between 2–3%, in the same order as the polyester monolayers, and were slightly higher in the tri-layers containing DH starch. The polyesters determined the tensile properties of the laminates, but PEG and water interlayer migration seem to affect the expected tensile parameters since no trilayer exhibited high values of EM and TS as PLA than pure PHBV monolayers. Even in the absence of PEG, the EM and TS values of the tri-layers were lower than those of the pure PLA or PHBV, which points to the partial hydrolysis effect promoted in both polymers by the water migrating from the starch sheets. Moreover, the weakening of the tri-layer is accentuated when PEG is present in the PHBV sheets.
Fig. 6 shows the barrier properties of the tri-layer materials. When comparing the experimental values of WVTR (Fig. 4), increases of 200 and 370% were observed concerning the theoretical values in the tri-layers with PEG-free PHBV and with non-modified or DH starch, respectively. However, these increases were reduced to 0 and 131%, respectively, when PHBV contained 10% PEG. Moreover, this tendency was inverted when PHBV had 20% PEG when WVTR decreased concerning the predicted value. These results suggest that the interlayer PEG migration provoked significant changes in the water vapour barrier capacity of the polyesters. In the absence of PEG, the lower predicted values of WVTR may be explained by the fact that polyesters can be partially hydrolysed by the water migration from the starch sheets, as observed in PLA-starch bilayers.
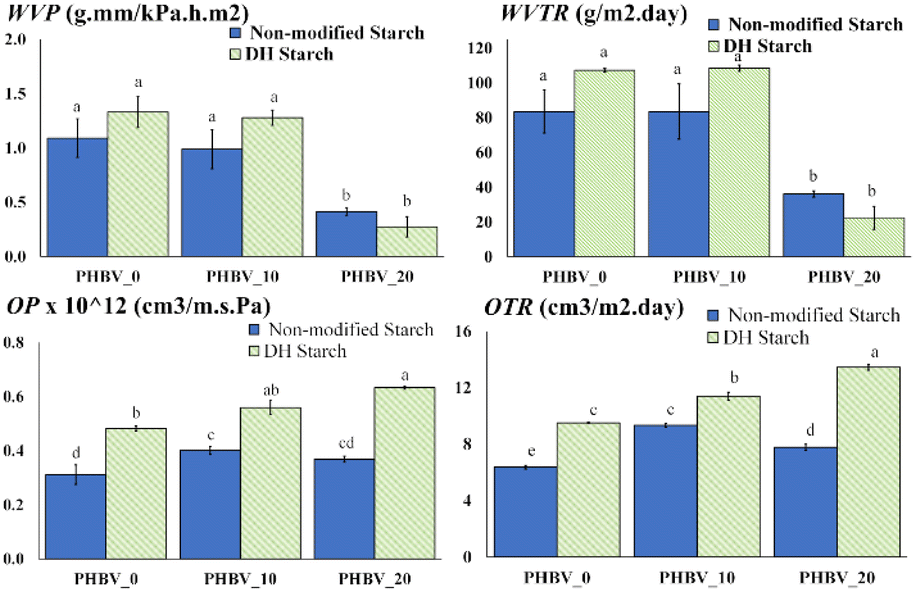 | ||
| Fig. 6 Water vapour permeability (WVP), water vapour transmission rate (WVTR), oxygen permeability (OP) and oxygen permeability transmission rate (OPTR) for tri-layer materials. Means with different letters are significantly different (p < 0.05). | ||
Regarding the oxygen barrier capacity, all of the tri-layers had OP values nearer to those of the starch films or PEG-free PHBV that had a good oxygen barrier capacity (Table 4). Nevertheless, a significant increase in the OP was observed when the PEG content in the PHBV sheet rose, while films with DH starch had higher values than their pairs with non-modified starch. This was coherent with the loss in oxygen barrier capacity of the PHBV sheet when PEG was incorporated and suggested that the changes in this capacity of the starch sheets differ depending on the DH modification since individual starch layers did not show significant differences in their OP values. The comparison between the experimental and predicted values of OTR for the tri-layers (Fig. 4) also reflected that the changes in the barrier capacity of the different layers could be attributed to the interlayer compound migration, especially of plasticisers, such as PEG in PHBV, glycerol in starch or oligomers in PLA. The predicted OTR values were very similar to the experimental ones (Fig. 4), but the latter was approximately 37–48% higher than the predicted values for the tri-layers containing DH starch and 0–20% PEG in the PHBV sheets. This suggests that DH starch was more sensitive to the compound migration (glycerol or PEG), which affected its oxygen barrier capacity to a greater extent.
Consequently, considering the barrier and tensile properties, the tri-layer combinations were not observed to offer any special benefits compared to PLA–starch or PLA–PHBV bilayers since the mechanical or barrier performance achieved was not noticeably better. In terms of mechanical performance, no significant differences were observed for the film stretchability, while resistance to break and elastic modulus are in the range of those obtained for the PLA–starch bilayers. Moreover, the PEG-free tri-layers had the lowest OP values, similar to those of the PLA–PHBV_0 or PLA–DH starch bilayer, and the tri-layer with PHBV_20 had the highest water vapour barrier capacity, slightly above that of any studied bilayers.
Conclusions
The surface tension values of the different polymer films were in the range of those previously reported (19–34 mN m−1), considering the great effect the film processing method has on the values. The estimated adhesion work of each polymer pair had no correlation with the experimental sealing strength and the PHBV–starch bilayers could not be obtained despite the relatively high value of the estimated adhesion work. As concerns the properties of the different films, there was a marked reduction (95%) in the water vapour permeability of the starch films caused by the DH modification, while PEG weakened the strength of the PHBV films and greatly promoted their oxygen permeability. Lamination with PLA reduced (85%) the WVP of non-modified starch while increased the tensile strength (183 and 196%) and decreased the elongation at break (25 and 22%) of the non-modified and DH starch films. However, the PLA–PHBV combinations and tri-layers did not offer great additional benefits when compared to the non-plasticized PHBV monolayers. The interlayer migration of plasticizers (glycerol and PEG), including the water present in the starch films, altered the expected tensile and barrier properties of the multilayers.Author contributions
Carla I. A. La Fuente: conceptualisation, methodology, validation, formal analysis, investigation, resources, data curation, writing – original draft, writing – review & editing, project administration, funding acquisition. Chelo González-Martínez: conceptualisation, methodology, formal analysis, resources, writing – review & editing, supervision, project administration, funding acquisition. Amparo Chiralt: conceptualisation, methodology, formal analysis, resources, writing – review & editing, supervision, project administration, funding acquisition.Conflicts of interest
There are no conflicts to declare.Acknowledgements
The authors acknowledge the São Paulo Research Foundation (FAPESP) for the Research Internships Abroad (BEPE) fellowship (2020/10498-0) of CIA La Fuente and the Agencia Estatal de Investigación (Spain), grant number PID2019-105207RB-I00.References
- United Nations Development Programme, Plastics and Circular Economy Community Solutions, 2020 Search PubMed.
- J. Muller, C. González-Martínez and A. Chiralt, Materials, 2017, 10, 1–22 Search PubMed.
- R. Requena, M. Vargas and A. Chiralt, Food Hydrocolloids, 2018, 83, 118–133 CrossRef CAS.
- E. Hernández-García, M. Vargas and A. Chiralt, Food Hydrocolloids, 2021, 113, 106509 CrossRef.
- R. Ortega-Toro, I. Morey, P. Talens and A. Chiralt, Carbohydr. Polym., 2015, 127, 282–290 CrossRef CAS PubMed.
- G. Biresaw and C. J. Carriere, J. Polym. Sci., Part B: Polym. Phys., 2001, 39, 920–930 CrossRef CAS.
- M. M. Hedrick, F. Wu, A. K. Mohanty and M. Misra, RSC Adv., 2020, 10, 44624–44632 RSC.
- Y. Wang, L. Lu, Y. Zheng and X. Chen, J. Biomed. Mater. Res., Part A, 2006, 76, 589–595 CrossRef PubMed.
- H. M. Heidemann, M. E. R. Dotto, J. B. Laurindo, B. A. M. Carciofi and C. Costa, Colloids Surf., A, 2019, 580, 123739 CrossRef.
- L. Wang, R. L. Shogren and C. Carriere, Polym. Eng. Sci., 2000, 40, 499–506 CrossRef CAS.
- P. A. V. Freitas, C. I. L. F. Arias, S. Torres-Giner, C. González-Martínez and A. Chiralt, Appl. Sci., 2021, 11, 8433 CrossRef CAS.
- C. I. A. La Fuente, L. do Val Siqueira, P. E. D. Augusto and C. C. Tadini, Innovative Food Sci. Emerging Technol., 2021, 102906 Search PubMed.
- ASTM, Am. Soc. Test. Mater., 2013, 08, 1–3 Search PubMed.
- M. Sapper, M. Bonet and A. Chiralt, LWT-Ed., 2019, 116, 108574 CrossRef CAS.
- W. A. Zisman, Adv. Chem., 1964, 1–51 CAS.
- ASTM, ASTM Stand., 2015, pp. 1–11 Search PubMed.
- ASTM, ASTM Stand., 2012, pp. 1–11 Search PubMed.
- ASTM, Annu. B. ASTM Stand., 2013, vol. i, pp. 1–10 Search PubMed.
- T. H. Mchugh, R. Avena-Bustillos and J. M. Krochta, J. Food Sci., 1993, 58, 899–903 CrossRef CAS.
- ASTM, Water, 2004, 98, 1–6 Search PubMed.
- A. C. C. Frabetti, J. O. de Moraes, V. Jury, L. Boillereaux and J. B. Laurindo, Food Eng. Rev., 2021, 13, 884–901 CrossRef CAS.
- B. C. Maniglia, D. C. Lima, M. D. Matta Junior, P. Le-Bail, A. Le-Bail and P. E. D. Augusto, Food Res. Int., 2020, 128, 108803 CrossRef CAS PubMed.
- E. Basiak, A. Lenart and F. Debeaufort, Int. J. Biol. Macromol., 2017, 98, 348–356 CrossRef CAS PubMed.
- L. Li, S. Ding and C. Zhou, J. Appl. Polym. Sci., 2004, 91, 274–277 CrossRef CAS.
- L. Vannozzi, P. Gouveia, P. Pingue, C. Canale and L. Ricotti, ACS Appl. Mater. Interfaces, 2020, 12, 21398–21410 CrossRef CAS PubMed.
- G. Cheng, Z. Cai and L. Wang, J. Mater. Sci.: Mater. Med., 2003, 14, 1073–1078 CrossRef CAS PubMed.
- J. H. Han, Y. Zhang and R. Buffo, in Innovations in Food Packaging, Elsevier, 2005, pp. 45–59 Search PubMed.
- J. Rhim and S. Hong, Food Sci. Biotechnol., 2007, 16, 234–237 CAS.
- Y. Zhang, M. Thompson and Q. Liu, Carbohydr. Polym., 2011, 86, 700–707 CrossRef CAS.
- E. Basiak, A. Lenart and F. Debeaufort, J. Sci. Food Agric., 2017, 97, 858–867 CrossRef CAS PubMed.
- W. T. Chong, U. Uthumporn, A. A. Karim and L. H. Cheng, LWT–Food Sci. Technol., 2013, 50, 439–443 CrossRef CAS.
- J. P. Mofokeng and A. S. Luyt, J. Appl. Polym. Sci., 2015, 132, 42138 CrossRef.
- M. N. Abdorreza, L. H. Cheng and A. A. Karim, Food Hydrocolloids, 2011, 25, 56–60 CrossRef CAS.
- J. B. Olivato, M. V. E. Grossmann, A. P. Bilck, F. Yamashita and L. M. Oliveira, Polímeros, 2013, 23, 32–36 CrossRef CAS.
- S. Thumsorn, S. P.-A. Hamada and K. e. Miyata, ANTEC, 2013, p. 1331 Search PubMed.
- Y. W. Leong, S. Yamaguchi, M. Mizoguchi, H. Hamada, U. S. Ishiaku and T. Tsujii, Polym. Eng. Sci., 2004, 44, 2327–2334 CrossRef CAS.
- A. Amor, N. Okhay, A. Guinault, G. Miquelard-Garnier, C. Sollogoub and M. Gervais, eXPRESS Polym. Lett., 2018, 12, 114–125 CrossRef CAS.
- M. P. Arrieta, A. D. García, D. López, S. Fiori and L. Peponi, Nanomaterials, 2019, 9, 1–14 CrossRef PubMed.
- R. Requena, A. Jiménez, M. Vargas and A. Chiralt, Polym. Int., 2016, 65, 883–891 CrossRef CAS.
- Y. R. Zhang, X. L. Wang, G. M. Zhao and Y. Z. Wang, Carbohydr. Polym., 2013, 96, 358–364 CrossRef CAS PubMed.
- S. Vijayarajan, S. E. M. Selke and L. M. Matuana, Macromol. Mater. Eng., 2014, 299, 622–630 CrossRef CAS.
- J. Andrade, C. González-Martínez and A. Chiralt, Food Chem., 2022, 375, 131861 CrossRef CAS PubMed.
| This journal is © The Royal Society of Chemistry 2023 |