 Open Access Article
Creative Commons Attribution 3.0 Unported Licence
An efficient blue-excitable broadband Y3ScAl4O12:Ce3+ garnet phosphor for WLEDs†
Hanwei
Zhao
ac,
Dashuai
Sun
*a,
Zeyu
Lyu
a,
Sida
Shen
a,
Lixuan
Wang
a,
Luhui
Zhou
a,
Zheng
Lu
a,
Jianhui
Wang
a,
Jinhua
He
 *b and
Hongpeng
You
 *ac
*ac
aKey Laboratory of Rare Earths, Chinese Academy of Sciences; Ganjiang Innovation Academy, Chinese Academy of Sciences, Ganzhou 341000, China. E-mail: hpyou@ciac.ac.cn; dssun@gia.cas.cn
bJiangsu Bree Optronics Company Limited, Nanjing 210000, China. E-mail: hejinhua_2001@aliyun.com
cSchool of Rare Earths, University of Science and Technology of China, Hefei 230026, P. R. China
First published on 21st August 2023
Abstract
Most commercial phosphor-converted white light-emitting diodes (pc-WLEDs) are manufactured with blue LED chips and yellow-emitting Y3Al5O12:Ce3+ (YAG:Ce3+) garnet phosphor, but the lack of blue-green light in the spectrum results in a low color rendering index (CRI). In this paper, we synthesized Y3ScAl4O12:Ce3+ (YSAG:Ce3+) by replacing Al3+ in YAG:Ce3+ with Sc3+. The introduction of Sc3+ with a larger ionic radius through a cation substitution strategy causes lattice expansion, elongation of the Y–O bond, and ultimately a decrease in Ce3+ 5d level crystal field splitting. As a consequence, the emission spectrum undergoes a blue-shift of 10 nm. Furthermore, the YSAG:Ce3+ phosphor exhibits good thermal stability, and its emission intensity at 423 K is about 58% of that at 303 K. Moreover, the analysis of Eu3+ emission spectra demonstrates that the introduction of Sc3+ resulted in a slight reduction of the dodecahedral lattice symmetry. YSAG:Ce3+ effectively compensates for the lack of the blue-green region, and WLEDs with high color rendering index (90.1), low color temperature (4566 K) and high luminous efficiency (133.59 lm W−1) were prepared using the combination of YSAG:0.08Ce3+, CaAlSiN3:Eu2+ and 450 nm blue chips. These findings indicate that YSAG:Ce3+ garnet phosphor has potential to be used in high quality WLEDs.
1 Introduction
Phosphor-converted white light-emitting diodes are widely used in solid-state lighting because of their high luminous efficiency, low energy consumption, long service life and environmental friendliness.1–3 Some commercialized pc-WLEDs are obtained by combining YAG:Ce3+ phosphors with blue light chips. This method has the advantages of simple operation and high luminous efficiency. However, the blue-green and red regions of the spectrum are insufficient in the WLED, leading to a low color rendering index (CRI < 80) and a high correlated color temperature (CCT > 5000 K).4–6 The addition of red phosphors such as (Ca,Sr)AlSiN3:Eu2+ and Sr2Si5N8:Eu2+ can improve CRI and reduce CCT.7 Nonetheless, there is still a lack of high-efficiency and thermally stable blue-green phosphors, which makes it a challenge to achieve an exceptionally high color rendering index (CRI > 90).Rare earth Ce3+ ions are known to be excellent activators for WLED phosphors due to their typical parity-allowed 4f ↔ 5d transitions.8 When Ce3+ is doped into a suitable matrix, the Ce3+ activated phosphor exhibits strong absorption in the near ultraviolet to blue region due to the 4f → 5d transition. In addition, these phosphors can produce wide emission bands as the parity-allowed 5d → 4f transition of Ce3+ ions.9 Since the 5d → 4f transition of Ce3+ ion is susceptible to the influence of crystal field environment, the luminescent properties of Ce3+ doped in different matrix materials exhibit noticeable differences. Consequently, selecting the appropriate matrix material is crucial to attain the desired emission characteristics of Ce3+ ions.10–12
Garnet-type phosphors belong to the cubic crystal system, the space group is Ia![[3 with combining macron]](https://www.rsc.org/images/entities/char_0033_0304.gif) d, and its chemical general formula can be written as A3B2C3O12, where A, B and C are cations in dodecahedron, octahedron and tetrahedron, respectively, which are interconnected by O atoms to form a stable garnet structure.13,14 The cations in the garnet structure can be flexibly replaced to achieve structural modulation and derivation of new materials, exhibiting remarkable modulation of the spectrum.15 Y3Al5O12 is one of the best-known garnet phosphor substrates, Y3+ corresponds to A3+ and occupies the dodecahedral site, two Al3+ occupy the octahedral site corresponding to B3+, and the remaining three Al3+ occupy the tetrahedral site corresponding to C3+.16,17 When Sc3+ is introduced into the matrix, the Sc3+ replaces an Al3+ located in the octahedron. Some studies have shown that the introduction of Sc3+ will lead to the increase of the disorder of the matrix structure, which is conducive to the broadening of the emission spectrum of rare earth ions doped in the matrix.18–22
d, and its chemical general formula can be written as A3B2C3O12, where A, B and C are cations in dodecahedron, octahedron and tetrahedron, respectively, which are interconnected by O atoms to form a stable garnet structure.13,14 The cations in the garnet structure can be flexibly replaced to achieve structural modulation and derivation of new materials, exhibiting remarkable modulation of the spectrum.15 Y3Al5O12 is one of the best-known garnet phosphor substrates, Y3+ corresponds to A3+ and occupies the dodecahedral site, two Al3+ occupy the octahedral site corresponding to B3+, and the remaining three Al3+ occupy the tetrahedral site corresponding to C3+.16,17 When Sc3+ is introduced into the matrix, the Sc3+ replaces an Al3+ located in the octahedron. Some studies have shown that the introduction of Sc3+ will lead to the increase of the disorder of the matrix structure, which is conducive to the broadening of the emission spectrum of rare earth ions doped in the matrix.18–22
In this paper, YSAG:Ce3+ and YAG:Ce3+ phosphors were successfully synthesised by high-temperature solid-phase method and their luminescent properties were investigated. Compare with the emission spectrum of YAG:Ce3+, the emission spectrum of YSAG:Ce3+ is blue-shifted by 10 nm. Moreover, Eu3+ was used as a fluorescence probe to calculate the red-orange ratio in different substrates, and the similar ratio indicates that the introduction of Sc3+ ions has little effect on the dodecahedral symmetry. Finally, the WLED device was prepared and its parameters were tested.
2 Experimental section
2.1 Materials and synthesis
A series of YSAG:xCe3+ (x = 0.02, 0.05, 0.08, 0.11, 0.14 and 0.17) and YAG:0.08Ce3+ samples were prepared by high-temperature solid-state method. The raw materials were Y2O3 (4N), Sc2O3 (4N), Al2O3 (4N) and CeO2 (4N), all of which were accurately weighed according to the stoichiometric ratio, and H3BO3 at 1% of the total mass of the raw material was added as a flux. The raw materials were carefully ground in an agate mortar for 20 min, mixed well and transferred to an alumina crucible, which was then placed in a tube furnace under a reductive atmosphere (90% N2 + 10% H2). The temperature of the tube furnace was slowly increased to 1530 °C and held at this temperature for 4 h. After cooling to room temperature, the crucible was removed and the agglomerated product was reground into powder to obtain bright yellow phosphor. YSAG:0.03Eu3+ and YAG:0.03Eu3+ samples were also prepared by high-temperature solid-state method. The raw materials were Y2O3 (4N), Sc2O3 (4N), Al2O3 (4N) and Eu2O3 (4N), all of which were accurately weighed according to the stoichiometric ratio, and H3BO3 at 1% of the total mass of the raw material was added as a flux. The raw materials were carefully ground in an agate mortar for 20 min, mixed well and transferred to an alumina crucible, which was then placed in a chamber furnace. The temperature was slowly increased to 1530 °C and held at this temperature for 4 h. After cooling to room temperature, the crucible was removed and the agglomerated product was reground into powder to obtain the target phosphor.2.2 Characterization
The phase purity and crystal structure of the samples were determined by Bruker D8 Advance X-ray diffractometer (XRD) with Cu as the radiation source, 40 mA current and 40 kV voltage, and XRD data were collected in the range of 10–80°. The XRD data were Rietveld refined using the General Structural Analysis System software (GSAS-II). Schottky field emission electron microscope (JSM-IT800) was used to obtain the micromorphology images and EDS mapping. The photoluminescence (PL) and photoluminescence excitation (PLE) spectra were recorded with an F-7100 spectrophotometer. The variable temperature spectra (303–483 K) were recorded on an Edinburgh FLS-1000 fluorescence spectrometer with an additional heating controller. Fluorescence lifetimes of Ce3+ were tested with a fluorescence spectrometer (Edinburgh FLS-1000) and an additional 450 nm laser was fitted as an excitation light source. The performance of the packaged LEDs was measured under a Starspec SSP6612 measuring system. Tests without special instructions were performed at room temperature.3 Results and discussion
3.1 Phase identification and crystal structure analysis
Fig. 1a shows the XRD pattern of YSAG:xCe3+. Compared with the standard card Y3Al5O12 (PDF#88-2048), the diffraction peak experiences a shift towards smaller angles, which is caused by the introduction of Sc3+ with a larger ionic radius to replace Al3+ in the matrix (0.745 Å for Sc3+ and 0.535 Å for Al3+ when the coordination number is 6). The degree of shift of the main peak to a small angle becomes more pronounced with increasing Ce3+ doping concentration, indicating the incorporation of a higher amount of Ce3+ into the lattice of the matrix. The diffraction peaks are all able to match with the standard card, indicating that the synthesized samples are all pure phases. Fig. S1† shows the XRD patterns of the YSAG:0.03Eu3+, YAG:0.03Eu3+ and YAG:0.08Ce3+ samples, all of which are in good agreement with the standard card and no impurity peaks appear. Fig. 1b shows the schematic crystal structure of YSAG, where Y3+ ions occupy the dodecahedral sites, the octahedral sites are shared by Sc3+ and Al3+ ions, and the tetrahedral sites are occupied entirely by Al3+ ions. The Ce3+ ions occupy the dodecahedral sites of Y3+ ions in the matrix lattice.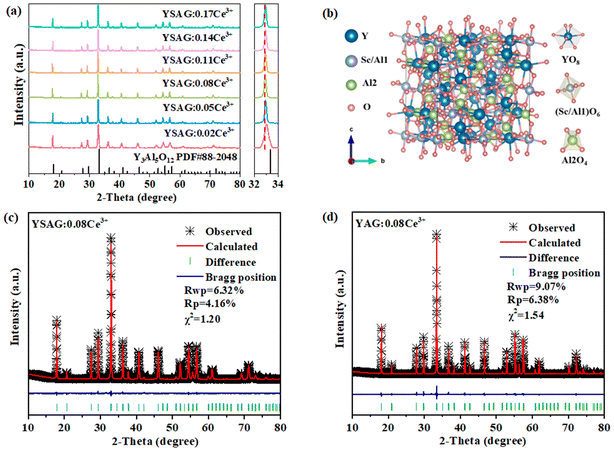 | ||
| Fig. 1 (a) XRD patterns and magnified XRD patterns around 32°–34° of the YSAG:xCe3+. (b) Crystal structure diagram of the YSAG. Rietveld refinement of (c) YSAG:0.08Ce3+ and (d) YAG:0.08Ce3+. | ||
In order to further confirm the crystal structure and phase purity of the samples, structural refinement of the YSAG:0.08Ce3+ and YAG:0.08Ce3+ samples were carried out by GSAS-II software, and the refinement results are shown in Fig. 1c and d. The values of Rwp, Rp and χ2 are relatively small, indicating that the obtained results are reliable. Both YSAG:0.08Ce3+ and YAG:0.08Ce3+ have the same garnet structure. And the obtained parameters are listed in Table 1. The introduction of Sc3+ with large ionic radius into the YAG matrix lattice results in an increase in the lattice constants (a, b, c), the lattice volume (V), and the Y–O bond length. Although Sc3+ is introduced solely at the octahedral site, the dodecahedron occupied by Ce3+ is co-prismatic with the octahedron, and the introduction of Sc3+ leads to the expansion of the dodecahedron.
| Samples | a = b = c (Å) | V (Å3) | α = β = γ (°) | Y–O (Å) |
|---|---|---|---|---|
| YAG:0.08Ce3+ | 12.00 | 1729.4 | 90 | 2.37 |
| YSAG:0.08Ce3+ | 12.14 | 1791.8 | 90 | 2.41 |
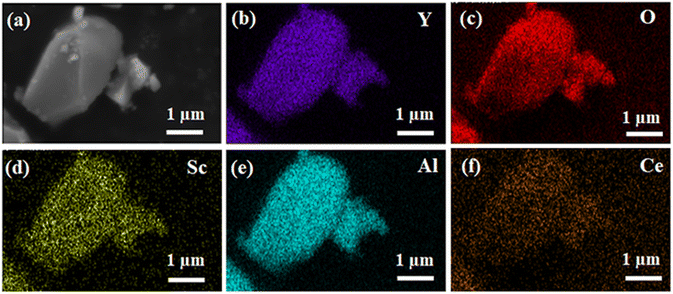
Fig. 2 shows the scanning electron microscope (SEM) image of the phosphor, revealing grain sizes of approximately 4 μm. In order to provide additional insights into the composition and elemental distribution of the sample, elemental analysis was conducted on the sample. In the EDS element mapping model, different colors represent different elements, and all elements (Y, Sc, Al, O, and Ce) are uniformly distributed on the particle, indicating that the phosphor YSAG:0.08Ce3+ is well synthesized.
3.2 Photoluminescence properties and thermal Stability
Fig. 3a shows the photoluminescence excitation (PLE) and photoluminescence (PL) spectra of YSAG:0.08Ce3+. The PLE spectrum contains three excitation bands at 254, 348 and 450 nm, respectively. The excitation band at 254 nm belongs to the absorption of the matrix, and the double bands at 348 and 450 nm are typical excitation bands of the Ce3+ ions, which correspond to the transition of the 4f electrons in the ground state to the 5d energy level of the Ce3+ ions. The PL spectrum of the Ce3+ ions is a broadband emission with a peak of 540 nm, due to the 5d to 2F5/2 and 2F7/2 transition of the Ce3+ ions. Fig. 3b shows the PL spectra of YSAG:xCe3+. With an increase in doping Ce3+-concentration, the emission intensity exhibits a continuous increase, reaching its maximum value at x = 0.08. However, beyond this optimal doping concentration, the emission intensity gradually decreases due to concentration quenching. Since the distance between Ce3+ ions decreases as the doping concentration increases, this reduction in distance enhances the probability of nonradiative energy transfer between Ce3+ ions, consequently increasing the probability of electrons entering the quenching center. Fig. 3c shows the normalized PL spectra of YSAO:0.08Ce3+. With an increase in Ce3+ doping concentration, the emission peak undergoes a red-shift from 524 to 549 nm. This shift is attributed to the increased probability of the energy transfer from the Ce3+ ions with the higher 5d energy levels to lower 5d energy levels of the Ce3+ ions. As a result, there is a decrease in emission intensity on the high-energy side of the spectrum.23,24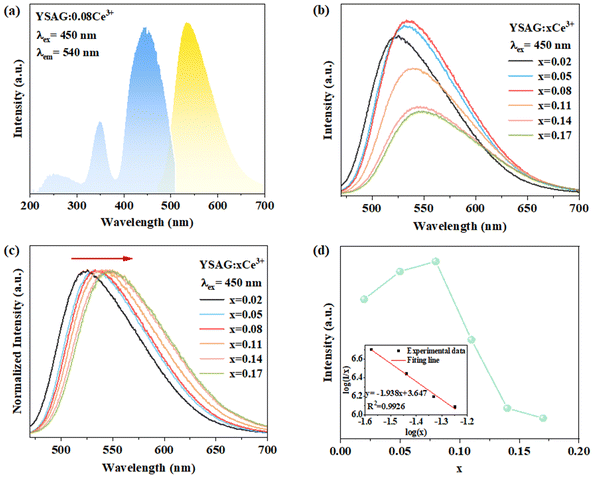 | ||
| Fig. 3 (a) PLE and PL spectra of YSAG:0.08Ce3+. (b) Variation of PL spectrum with Ce3+ doping concentration. (c) Normalized PL spectra. (d) The dependence of emission intensity on Ce3+ concentration. | ||
The critical energy transfer distance (Rc), proposed by Blasse, is defined as the distance where the probability of energy transfer equals that of radiation emission by the activator, and can be estimated geometrically from the following equation:25
According to the refinement results, the cell volume V is 1791.81 Å3, the critical concentration xc is 0.08, and the N is 8. The calculated Rc is 17.49 Å, which is significantly larger than 5.0 Å. This result reveals that the energy transfer mechanism among Ce3+ ions is governed by electric multipole interactions. The type of electric multipole interactions can be determined by the following equation:26
In order to better evaluate the luminescent properties of the prepared phosphor, YAG:0.08Ce3+ was also prepared. The comparison of the emission spectra is shown in Fig. 4a. The emission peak position of YSAG:0.08Ce3+ is blue-shifted by 10 nm, compared with YAG:0.08Ce3+. Additionally, there is a small difference in the full width half maximum with values of 91.7 nm and 91.4 nm for the YSAG:0.08Ce3+ and YAG:0.08Ce3+ phosphors, respectively. The blue-shift of the emission spectrum can be attributed to the reduction of crystal field splitting, which can be estimated using the following equation:22
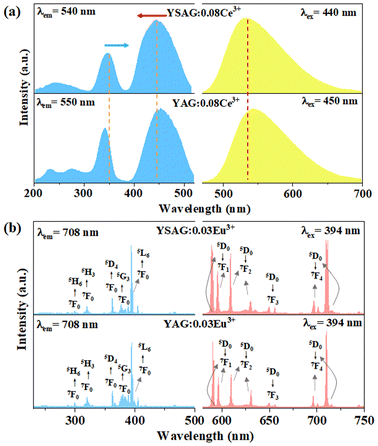 | ||
| Fig. 4 (a) PLE and PL spectra of YSAG:0.08Ce3+ and YAG:0.08Ce3+. (b) PLE and PL spectra of YSAG:0.03Eu3+ and YAG:0.03Eu3+. | ||
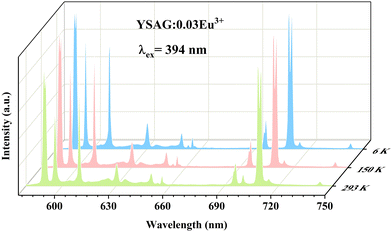
The Eu3+ ion is commonly employed as spectroscopic probe for monitoring the occupancy of lattice sites.28 In order to compare and study this phenomenon, YSAG:0.03Eu3+ and YAG:0.03Eu3+ samples were synthesized. Fig. 4b shows their PLE and PL spectra. As presented, the excitation spectra of YSAG:0.03Eu3+ and YAG:Eu3+ consist of a series of f–f transition peaks located at 299, 320, 361, 381 and 393 nm, which are assigned to the 7F0 → 5H6, 7F0 → 5H3, 7F0 → 5D4, 7F0 → 5G3 and 7F0 → 5L6 transitions, respectively. Under 394 nm excitation, the emission spectrum consists of a series of peaks located at around 590, 596, 609, 630, 650, 696, and 708 nm, assigned to the 5D0 → 7FJ (J = 1–4) transitions. It is worth noting that the 5D0 → 7F1 transition of Eu3+ is a magnetic-dipole transition, its intensity is largely independent of the surrounding chemical environment of the Eu3+ ion. On the other hand, the 5D0 → 7F2 transition belongs to the hypersensitive electric-dipole transition, its intensity is greatly influenced by the lattice environment, and the higher the lattice symmetry the weaker the emission, and it does not emit light in the lattice with central symmetry. Therefore, the lattice symmetry can be detected by the intensity ratio of red and orange emission (R/O = I(5D0 → 7F2)/I(5D0 → 7F1)).29,30 Red emission at 613 nm can be observed in the PL spectra of both YAG:Eu3+ and YSAG:Eu3+, indicating that Eu3+ occupies the lattice position without centrosymmetric. The red-orange ratios in YAG and YSAG were calculated to be 68.9% and 70.6%, respectively. This indicates that the dodecahedral lattice symmetry is slightly reduced by the introduction of Sc3+ at the octahedral position. Therefore, the changes in the excitation and emission spectra of Ce3+ ions caused by the decrease in the symmetry of the dodecahedron are also small. In addition, Fig. 5 demonstrates the variable temperature spectrum of YSAG:Eu3+, where the intensity of each emission peak of Eu3+ increases synchronously with decreasing temperature, suggesting that the emission of Eu3+ comes from the same dodecahedral lattice site and that there is no second dodecahedral lattice site. Therefore, the broadband emission of Ce3+ ions in this matrix is also from one dodecahedral lattice site.
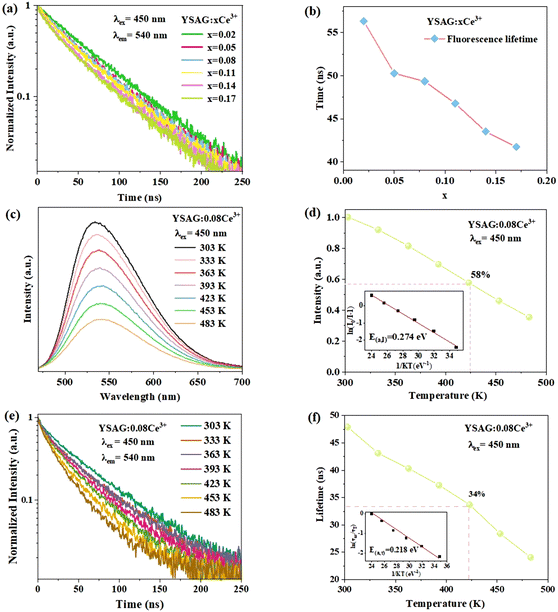
Fig. 6a shows the fluorescence decay curves of YSAG:xCe3+ samples measured by monitoring at 540 nm after 450 nm pulse excitation. The decay lifetime was able to be calculated according to the following equation:27
In the YSAG:xCe3+ samples, the fluorescence lifetime decay curves of Ce3+ can be well fitted with the single exponential function, and the corresponding decay lifetimes were 56.32, 50.27, 49.34, 46.78, 43.51, and 41.74 ns when x was 0.02, 0.05, 0.08, 0.11, 0.14 and 0.17, respectively. Generally, the fluorescence lifetime of Ce3+ becomes shorter with an increase in doping concentration. This reduction in lifetime can be attributed to an increase in the probability of non-radiation transition of Ce3+ to the quenching center.
Thermal stability is an important index for evaluating phosphors. In general, one can explain the thermal quenching behavior of Ce3+ by the conformational coordinate diagram in Fig. S2.† Under blue light excitation, the 4f electron of Ce3+ is excited to the 5d orbital, the electron in the excited state returns to the 4f ground state via process ① and simultaneously radiates yellow light. Additionally, excited state electrons can also cross the energy barrier (Ea) and return to the ground state via process ② without radiation. As the temperature increases, the probability of the excited electrons returning to the ground state via the process ② increases, leading to a decrease in the phosphor's emission intensity as well as a reduction in the radiation lifetime. The emission spectra of YSAG:0.08Ce3+ sample were tested in the range of 303–483 K. As shown in Fig. 6c, its emission intensities decreased continuously with increasing temperature, and the emission intensity of YSAG:0.08Ce3+ at 423 K retained 58% of its value at 303 K. Thermal activation energy (Ea) can be utilized to assess the thermal stability of the luminescent material. A larger Ea indicates that electrons face greater difficulty in reaching the energy level intersection, resulting in a smaller probability of returning to the ground state via non-radiative transitions. The value of E(a,I) can be estimated using the Arrhenius equation, which is expressed as follows:31
Alternatively, the activation energy can be calculated from the variable temperature lifetime, the fluorescence lifetime of YSAG:0.08Ce3+ was tested as a function of temperature, and it is seen in Fig. 6e that as the temperature increases from 303 to 483 K the fluorescence lifetime decreases continuously, and their values are 47.87, 43.08, 40.31, 37.25, 33.69, 28.42, and 24.10 ns, in that order. Plotting the decay of the fluorescence lifetime with temperature based on the Arrhenius equation below:32
3.3 Applications in pc-WLEDs
To demonstrate the application of the prepared phosphors, WLEDs were prepared using YSAG:0.08Ce3+ and YAG:0.08Ce3+ combined with commercial red CaAlSiN3:Eu2+ phosphor and 450 nm blue chips, respectively. Their electroluminescence (EL) spectra are presented in Fig. 7a and b, where the CRI, CCT and the luminous efficiency (η) were also given. It is evident that the WLED prepared with YSAG:0.08Ce3+ has a higher CRI (90.1) when the value of CCT is similar with the WLED prepared with YAG:0.08Ce3+. This improvement in CRI is attributed to the effective blue-shift of the emission peak of YSAG:0.08Ce3+, which helps to fill the previously missing blue-green region of the spectrum. Fig. 6c shows their CIE chromaticity diagrams, the color coordinates of the WLED devices are (0.352, 0.324) and (0.346, 0.301), respectively. | ||
| Fig. 7 (a) EL spectra of WLED devices with YSAG:0.08Ce3+. (b) EL spectra of WLED devices with YAG:0.08Ce3+. (c) CIE chromaticity diagram of YSAG:0.08Ce3+ and YAG:0.08Ce3+. | ||
4 Conclusions
In conclusion, YSAG:xCe3+ phosphors were synthesized by a high-temperature solid-state reaction. The introduction of Sc3+ reduces the field splitting of the 5d energy level of Ce3+, resulting in a 10 nm blue-shift of the YSAG:Ce3+ emission spectrum compared with that of YAG:Ce3+. The blue-shift of the spectrum efficiently fills the blue-green region, WLED was fabricated by combining YSAG:0.08Ce3+, CaAlSiN3:Eu2+ with 450 nm blue chips, exhibiting high color rendering index (90.1), low color temperature (4566 K) and high luminous efficiency (133.59 lm W−1). These results indicate that YSAG:0.08Ce3+ has potential application in higher color rendering index WLEDs.Author contributions
Data curation, Hanwei Zhao; Formal analysis, Dashuai Sun, and Zeyu Lyu; Investigation, Lixuan Wang, Zheng Lu, and Jianhui Wang; Methodology, Sida Shen, and Luhui Zhou; Writing – original draft, Hanwei Zhao; Writing – review & editing, Dashuai Sun, Jinhua He, and Hongpeng You. All authors have read and agree to the published version of the manuscript.Conflicts of interest
There are no conflicts to declare.Acknowledgements
This study is financially supported by the National Key Research and Development Program (Grant No. 2022YFC2905201), the National Natural Science Foundation of China (Grant No. 52072363), and the Research Projects of Ganjiang Innovation Academy, Chinese Academy of Sciences (E255C001).Notes and references
- Y. Xiao, W. Xiao, L. Zhang, Z. Hao, G.-H. Pan, Y. Yang, X. Zhang and J. Zhang, J. Mater. Chem. C, 2018, 6, 12159–12163 RSC.
- M. Iwaki, K. Uematsu, M. Sato and K. Toda, Inorg. Chem., 2023, 62, 1250–1256 CrossRef CAS PubMed.
- G. Li, Y. Tian, Y. Zhao and J. Lin, Chem. Soc. Rev., 2015, 44, 8688–8713 RSC.
- Y. Zhou, W. Zhuang, Y. Hu, R. Liu, H. Xu, M. Chen, Y. Liu, Y. Li, Y. Zheng and G. Chen, Inorg. Chem., 2019, 58, 1492–1500 CrossRef CAS PubMed.
- L. Cao, W. Li, B. Devakumar, N. Ma, X. Huang and A. F. Lee, ACS Appl. Mater. Interfaces, 2022, 14, 5643–5652 CrossRef CAS PubMed.
- Y. Xiao, W. Xiao, D. Wu, L. Guan, M. Luo and L.-D. Sun, Adv. Funct. Mater., 2022, 32, 2109618 CrossRef CAS.
- S. Jiao, R. Pang, J. Wang, T. Tan, C. Li and H. Zhang, Inorg. Chem. Front., 2023, 10, 1863–1875 RSC.
- S. Wang, Z. Song and Q. Liu, J. Mater. Chem. C, 2023, 11, 48–96 RSC.
- Z. Xia and A. Meijerink, Chem. Soc. Rev., 2017, 46, 275–299 RSC.
- Y. Tian, J. Chen, X. Yi, R. Jiang, H. Lin, L. Chen and S. Zhou, J. Alloys Compd., 2022, 907, 164412 CrossRef CAS.
- J.-Y. Yang, S. Dutta and T.-M. Chen, Dalton Trans., 2018, 47, 14870–14874 RSC.
- Q. Meng, G. Zhao, Q. Zhu, X. Sun and J.-G. Li, Dalton Trans., 2022, 51, 3159–3169 RSC.
- W. Li, N. Ma, B. Devakumar and X. Huang, Mater. Today Chem., 2022, 23, 100638 CrossRef CAS.
- K. Park, H. Kim, D. H. Kim and S. Y. Gwon, Ceram. Int., 2023, 49, 15176–15182 CrossRef CAS.
- Y. H. Kim, H. J. Kim, S. P. Ong, Z. Wang and W. B. Im, Chem. Mater., 2020, 32, 3097–3108 CrossRef CAS.
- H. Nakamura, K. Shinozaki, T. Okumura, K. Nomura and T. Akai, RSC Adv., 2020, 10, 12535–12546 RSC.
- E. N. Galashov, V. V. Atuchin, T. A. Gavrilova, I. V. Korolkov, Y. M. Mandrik, A. P. Yelisseyev and Z. Xia, J. Mater. Sci., 2017, 52, 13033–13039 CrossRef CAS.
- J. Xu, Q. Song, J. Liu, K. Bian, W. Lu, D. Li, P. Liu, X. Xu, Y. Ding, J. Xu and K. Lebbou, Opt. Mater., 2020, 109, 110388 CrossRef CAS.
- Y. Feng, G. Toci, B. Patrizi, A. Pirri, Z. Hu, X. Chen, J. Wei, H. Pan, X. Li, X. Zhang, S. Su, M. Vannini and J. Li, J. Am. Ceram. Soc., 2020, 103, 1819–1830 CrossRef CAS.
- J. Xu, Q. Song, J. Liu, S. Zhou, Y. Pan, D. Li, P. Liu, X. Xu, Y. Ding, J. Xu and K. Lebbou, J. Lumin., 2019, 215, 116675 CrossRef CAS.
- Y. Feng, G. Toci, A. Pirri, B. Patrizi, Z. Hu, J. Wei, H. Pan, X. Zhang, X. Li, S. Su, M. Vannini and J. Li, J. Am. Ceram. Soc., 2020, 103, 224–234 CrossRef CAS.
- J. Carreaud, R. Boulesteix, A. Maître, Y. Rabinovitch, A. Brenier, A. Labruyère and V. Couderc, Opt. Mater., 2013, 35, 704–711 CrossRef CAS.
- L. Sun, B. Devakumar, J. Liang, S. Wang, Q. Sun and X. Huang, J. Mater. Chem. C, 2020, 8, 1095–1103 RSC.
- L. Wang, D. Sun, Z. Lyu, S. Shen, Z. Lu, H. Zhao, J. Wang and H. You, Chem. – Asian J., 2022, 17, e202200639 CAS.
- S. Wei, Z. Li, Z. Lyu, D. Sun, S. Shen, J. Wang, C. Zhuo and H. You, J. Alloys Compd., 2022, 923, 166419 CrossRef CAS.
- B. Shao and C. Wang, Ceram. Int., 2023, 49, 19301–19308 CrossRef CAS.
- B. Shao, J. Huo and H. You, Adv. Opt. Mater., 2019, 7, 1900319 CrossRef.
- X. Zhang, T. Shen, D. Kan, D. Zhang, R. Dong, Z. An, Y. Song, K. Zheng, Y. Sheng, Z. Shi and H. Zou, Inorg. Chem., 2020, 59, 9927–9937 CrossRef CAS PubMed.
- K. Binnemans, Coord. Chem. Rev., 2015, 295, 1–45 CrossRef CAS.
- J. Zhang, G. Cai, W. Wang, L. Ma, X. Wang and Z. Jin, Inorg. Chem., 2020, 59, 2241–2247 CrossRef CAS PubMed.
- T. Zheng, L. Luo, P. Du, S. Lis, U. R. Rodríguez-Mendoza, V. Lavín, I. R. Martín and M. Runowski, Chem. Eng. J., 2022, 443, 136414 CrossRef CAS.
- S. Zhang, P. Zhang, S. Tao, X. Zheng and H. J. Seo, J. Alloys Compd., 2020, 844, 156195 CrossRef CAS.
Footnote |
| † Electronic supplementary information (ESI) available. See DOI: https://doi.org/10.1039/d3dt01898a |
| This journal is © The Royal Society of Chemistry 2023 |

