
 Open Access Article
 This Open Access Article is licensed under a Creative Commons Attribution-Non Commercial 3.0 Unported Licence
Heterogeneous electron transfer reorganization energy at the inner Helmholtz plane in a polybromide redox-active ionic liquid†
Moonjoo
Kim‡
a,
Sangmee
Park‡
b and
Taek Dong
Chung
 *ab
*ab
aDepartment of Chemistry, Seoul National University, Seoul 08826, Republic of Korea. E-mail: tdchung@snu.ac.kr
bProgram in Nano Science and Technology, Graduate School of Convergence Science and Technology, Seoul National University, Suwon-si, Gyeonggi-do 16229, Republic of Korea
First published on 13th July 2022
Abstract
In ionic liquids (ILs), the electric double layer (EDL) is where heterogeneous electron transfer (ET) occurs. Nevertheless, the relationship between the EDL structure and its kinetics has been rarely studied, especially for ET taking place in the inner Helmholtz plane (IHP). This is largely because of the lack of an appropriate model system for experiments. In this work, we determined the reorganization energy (λ) of Br2 reduction in a redox-active IL 1-ethyl-1-methylpyrrolidinium polybromide (MEPBr2n+1) based on the Marcus–Hush–Chidsey model. Exceptionally fast mass transport of Br2 in MEPBr2n+1 allows voltammograms to be obtained in which the current plateau is regulated by electron-transfer kinetics. This enables investigation of the microscopic environment in the IHP of the IL affecting electrocatalytic reactions through reorganization energy. As a demonstration, TiO2-modified Pt was employed to show pH-dependent reorganization energy, which suggests the switch of major ions at the IHP as a function of surface charges of electrodes.
Introduction
The electric double layer (EDL) structure is critical to understand and predict the activities of electrochemical reactions.1–3 For example, the enhanced HER/HOR activities using a Ni(OH)2-modified Pt(111) electrode were ascribed to the shift in the potential of zero charge (PZC) of Pt via structural changes in the EDL.1,2 Applying a strong electric field (108 to 1010 V m−1) gives rise to the rearrangement and reorientation of electrolytes in the vicinity of the electrode surface, creating a unique medium for heterogeneous electron transfer. The dielectric constant (ε) of solvents closer to the electrode is smaller than that of bulk,4–6 making reorganization energy decrease.7 This phenomenon highlights in the inner Helmholtz plane (IHP) where the electric field is the strongest across the EDLs.The impact of the interfacial electric field on electrochemical activities is more prominent in room-temperature ionic liquids (RT-ILs). RT-ILs have attracted considerable interest in the fields of electrocatalysis,8,9 batteries10 and supercapacitors11 because of their high ionic conductivity, wide electrochemical window, and high thermal stability.12 The extremely high ionic strength of RT-ILs leads to an unique EDL structure that is different from those of conventional electrolytes in solution. The EDL of a RT-IL is compact and consists of densely packed ions.13 An ion in the EDL of a RT-IL strongly interacts with the surrounding ions, and ionic composition at the surface is likely to respond to the electrode charge.14 This is where heterogeneous electron transfer takes place so that quantitative analysis should be essential to understand the origins of many phenomena in RT-ILs, including PZC-sensitive electrochemical reactions. Nevertheless, few studies have addressed the relationship between the EDL structure and electrochemical activities in RT-ILs.15,16 This is primarily because it is hard to probe the properties of the RT-IL near the electrode, especially in the IHP.
The Marcus–Hush–Chidsey (MHC) model for heterogeneous electron transfer kinetics has been successfully applied to associate electron transfer kinetics with the microscopic properties of electrode–electrolyte interfaces.3,7,17–20 According to the Marcus theory, the reorganization energy (λ) reflects the properties of a medium and can be utilized to evaluate the local ε value in an EDL.6λ can be calculated by fitting the electron transfer rate vs. electrode potential curve to the corresponding equation based on the MHC model. Yet experimental quantitation of λ for electrochemical systems is challenging. Because mass transport (MT) is slower than electron transfer (ET) in most electrochemical systems, one can hardly assume that a given voltammogram reflects the ET kinetics predominantly. Most of the previous studies to measure λ were performed for redox species immobilized on electrodes where the number of redox-active species was fixed.17,18 Once the molecules are anchored on the electrode, the EDL structure should get perturbed. Moreover, only λ of the outer Helmholtz plane (OHP) could be obtained for the redox species that reside at a large distance from the electrode beyond the IHP. Considering that majority of the important catalytic reactions take place in the IHP accompanying adsorptive processes, it is crucial to evaluate λ of the IHP and look into the microenvironment involved. This requires a proper model system that allows experimental measurements varying with reaction conditions. This is more significant in RT-ILs because the high viscosity slows down the diffusion of the redox-active species, resulting in obscure interpretation of the kinetics based on currents.21,22
In this study, we suggest a Br2 reduction in 1-ethyl-1-methylpyrrolidinium polybromide (MEPBr2n+1), which is a Br−/Br2n+1−-based RT-IL, as an appropriate system to investigate the effects of the ion environment and PZC involved in heterogeneous ET kinetics. The mass transport of Br−/Br2 in MEPBr2n+1 is even faster than proton hopping,23 and this substantially expands the ET kinetics-governed potential window. In the MEPBr2n+1 system, the voltammograms are well fitted to the MHC model for heterogeneous ET kinetics, including clear ET-limited steady-state current. As a demonstration, the λ values of Pt and TiO2-modified Pt electrodes were compared to determine the influence of electrode surface charges.
Results and discussion
Ultrafast mass transport system of MEPBr2n+1
A MEPBr2n+1 droplet was electrochemically synthesized in a 250 mM solution of MEPBr in 1 M aqueous potassium phosphate buffer at a Pt macroelectrode (1.2 V vs. Ag/AgBr (3 M KBr)).23 Under these conditions, Br2 is generated at the Pt electrode, following which it is captured by MEPBr in the solution to produce MEPBr2n+1, which is immiscible with water to form a droplet:24| 2Br−(aq) ⇌ Br2(aq) + 2e− | (1) |
| MEPBr(aq) + nBr2(aq) ⇌ MEPBr2n+1(IL) | (2) |
The MEPBr2n+1 droplet was immobilized on the Pt surface. The potential was held constant at the Pt electrode for several hours until the droplet became large enough to be observed by the naked eye.
MEPBr2n+1 is composed of polybromides, Br2n+1−, i.e. Br3−, Br5−, and Br7−, that can be confirmed by Raman spectroscopy.23 In MEPBr2n+1, the redox centers are highly concentrated, and MEP+ and Br2n+1− can act as both the electrolyte and solvent. MEPBr2n+1 stores a very high concentration (7.5 M) of Br−.25 The apparent diffusion coefficients of redox species in MEPBr2n+1 measured by electrochemical impedance spectroscopy (EIS) are surprisingly high, 6 × 10⁻⁴ to 3 × 10⁻³ cm2 s−1.23 This is two to three orders of magnitude higher than those of the species in aqueous solutions.
Br2n+1− has weak coordinate bonds between Br− and Br2, which is called halogen bonding (dashed line in Fig. 1a), and Br−, Br2, and Br2n+1− are at equilibrium in polybromide ILs:26
| Br−2n+1(IL) ⇌ nBr2(IL) + Br−(IL) | (3) |
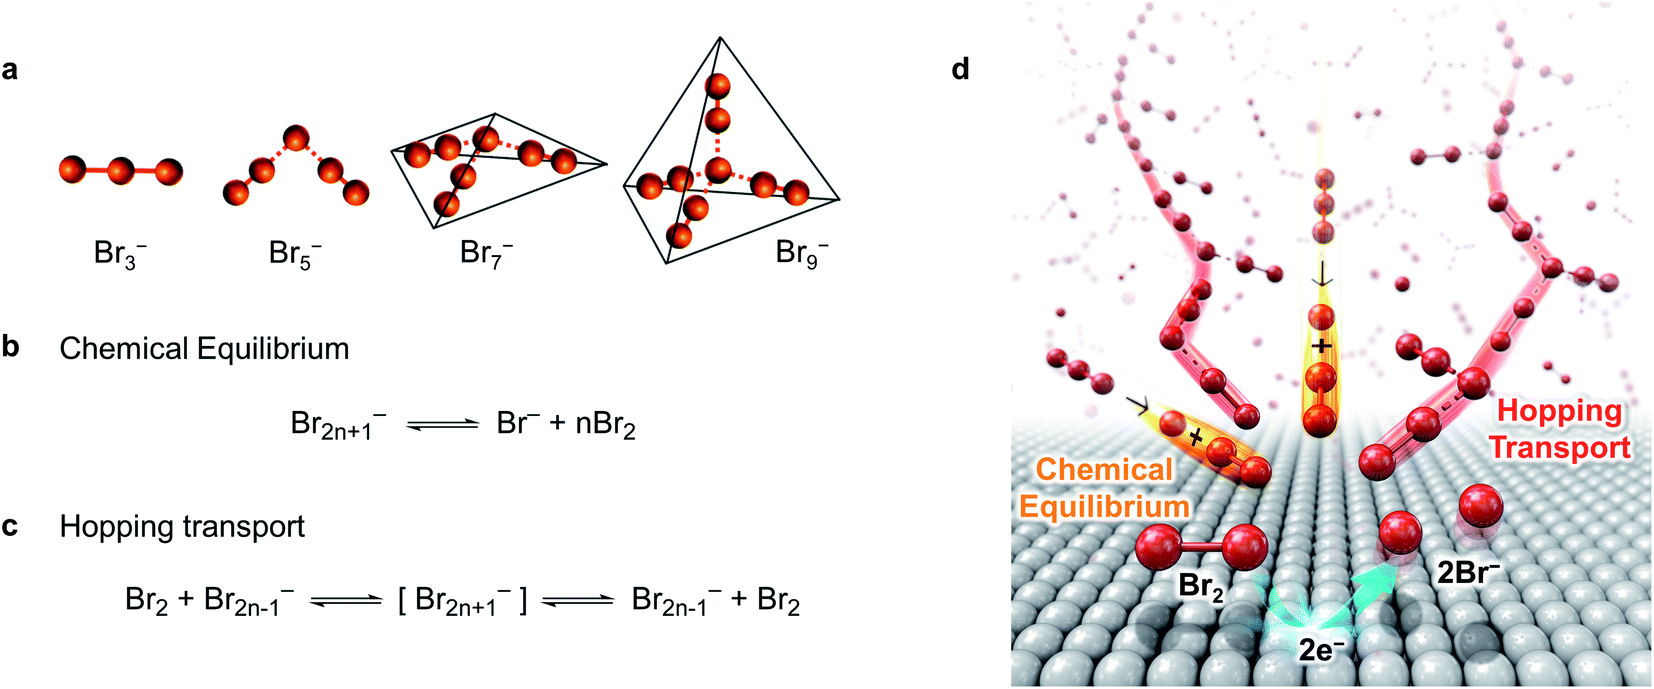 | ||
| Fig. 1 Ultrafast mass transport system of Br2 within MEPBr2n+1. (a) Molecular structure of Br2n+1−.71 Dashed lines represent halogen-bonding. (b) Chemical equilibrium between Br2n+1−, Br− and Br2. (c) Grotthuss-like mechanism of Br2 hopping transport. (d) Schematic representation for the ultrafast MT system of Br2 within MEPBr2n+1. | ||
The facile dissociation and reconstitution of halogen bonding facilitate MT of Br2, Br−, and Br2n+1−. Fig. 1b–d show the mechanism proposed for the fast MT of Br− and Br2 in MEPBr2n+1 when Br2 is electrochemically reduced. The equilibrium among Br−, Br2, and Br2n+1− buffers the Br2 concentration gradient near the electrode (Fig. 1b). Br2 elimination from Br2n+1−, with a higher n, needs lower energy.27 Since MEPBr2n+1 contains high concentrations of Br2n+1− and Br−, it can minimize the depletion of redox species at the electrode surface caused by the faradaic reaction. In addition, Br2 is deemed to transport through the Grotthuss-like hopping mechanism via the bromine network within the polybromide IL (Fig. 1c).28–31 Owing to the hopping transport, the species appears to move a long distance, although the actual displacement is small. The apparent diffusion coefficient of the redox species in MEPBr2n+1 is actually higher than that of proton hopping so that the bromine reduction in MEPBr2n+1 should be kinetically controlled even when a large overpotential, η, is applied to the electrode. Overall, the literature strongly implies that the MT in the polybromide IL is extraordinarily fast.
Verifications of electron transfer kinetic controlled current
A polycrystalline Pt ultramicroelectrode (UME) or carbon UME was dipped in the electrochemically synthesized MEPBr2n+1 droplet (Fig. S1a†). Fig. 2a shows the CVs of Br2 reduction at the Pt UME and carbon UME. The reduction in MEPBr2n+1 involves an inner-sphere electrochemical reaction of Br2 to generate Br−:| Br2(IL) + 2e− ⇌ 2Br−(IL) | (4) |
 | ||
| Fig. 2 Voltammograms of MEPBr2n+1. (a) CVs at the Pt UME and carbon UME of diameters 10 μm and 11 μm, respectively, in MEPBr2n+1 (pH 3, phosphate buffer). The scan rate is 10 mV s−1. (b) Comparison of the CV of the carbon UME in MEPBr2n+1 (pH 3, phosphate buffer) and the voltammogram predicted from eqn (5). (c and d) CVs at Pt UMEs of diameters 10, 25 and 50 μm in MEPBr2n+1 (pH 3, phosphate buffer). The scan rate is 10 mV s−1. Current is divided by the (c) ECSA of Pt electrodes calculated from the Hupd voltammogram, and the (d) geometric radius of UME. | ||
Since Br2 reduction proceeds at the UME in a polybromide droplet having excess Br2 for only a short time, the electrochemical measurements do not cause significant perturbation to the composition of the polybromide IL. There was no side reaction such as the hydrogen evolution reaction in this potential range (Fig. S2†). Once the droplet was sufficiently large, the CVs were independent of its size. The CVs were also identical regardless of whether the reference electrode was located in the droplet or in the aqueous solution outside the droplet (Fig. S1b†). This shows that the impedance of the interface at MEPBr2n+1 droplet/aqueous solution as well as that of aqueous solution was negligible.
The CV of Br2 reduction shows a steady-state current (iss) at a high η regardless of the electrode material (Fig. 2a). In common electrochemical systems, iss usually originates from the restricted supply of reactants: (i) spherical diffusion-limited steady-state current at the UME, (ii) slow adsorption of reactants on the electrode for adsorption-coupled electron transfer, or (iii) a slow homogeneous chemical reaction that produces reactants of an electrochemical reaction.
First, the current coming from Br2 reduction is not governed by MT. The MT-limited voltammogram of the UME is sigmoidal, indicating the current–voltage relationship for a cathodic η:
| i/i0 = (1 − i/il,c)e−αfη | (5) |
Br2 reduction is composed of elementary steps: the Heyrovsky step, Volmer step, and Tafel step. Its mechanism differs depending on the reaction conditions, such as the reactants, solvents, and electrodes.33–35 If the rate-determining step (rds) is the Tafel step (ex. Br2 → 2Brad), the adsorption rate of redox species at the electrode surface should govern the overall Br2 reduction rate, resulting in iss.36 However, the current is not likely to be limited by the adsorption because Br2 adsorption on Pt is fast enough.37–39
It is widely accepted that the dissociation of Br2n+1− to Br2 and Br− is fast enough not to restrict the Br2 reduction current.33,40 In the experiments, the voltammograms of Br2 reduction vary sensitively with changes in the surface structures of the electrodes. This can hardly occur when a homogeneous chemical reaction is the rds.
Application of the MHC model to electron transfer kinetics at Pt and carbon electrodes
The evidence consistently shows that iss in MEPBr2n+1 is not controlled by mass transport, adsorption, or a chemical reaction. On the other hand, the Br2 reduction CVs on the Pt and carbon UME are fitted well to the MHC model (Fig. 3b and c), suggesting that the current is governed by the ET kinetics.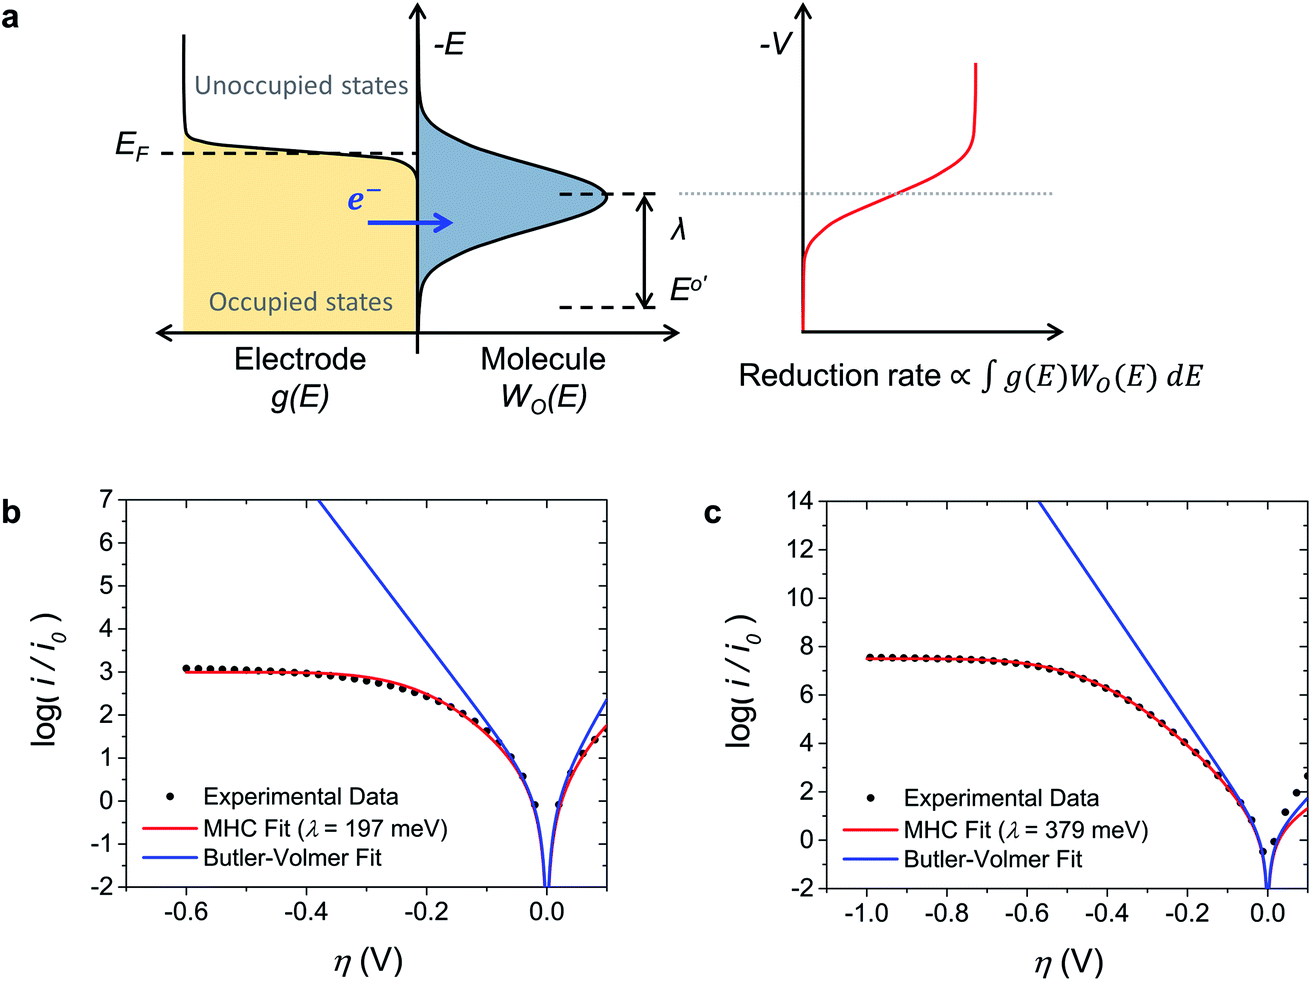 | ||
| Fig. 3 Fitting the voltammograms to the Marcus–Hush–Chidsey model. (a) Electronic level diagram of the electrode–electrolyte interface in the MHC model. The relationship between the heterogeneous electron transfer rate and electronic states at an electrode–electrolyte interface in the case of reduction is shown. The y-axis is the energy, E. EF, E0′ and V are the Fermi level, formal potential, and electrode potential, respectively. The bell curve represents WO(E) of LUMOs of redox-active species. KMHCred is proportional to the overlapped area of the number of occupied states in the electrode (yellow) and unoccupied states in the redox-active species (blue). KMHCred reaches half of the maximum when −ΔG0 for electron transfer is equal to λ. (b and c) Normalized Tafel plots for Br2 reduction in the MEPBr2n+1 with pH 3 phosphate buffer at the (b) Pt UME and (c) carbon UME. The experimental data (black dots) are compared to the fitting results of the MHC model (red lines) and the Butler–Volmer model (blue lines). | ||
The MHC model is an ET kinetics model that incorporates energy distributions of electrons in electrodes and electrolytes into the Marcus theory of heterogeneous ET.17,41Fig. 3a illustrates the principle of the MHC model. The distribution of occupied electronic states in the electrode, g(E), follows the Fermi–Dirac equation, and the energy levels of electrons in the redox-active species of electrolytes vary with the degree of stabilization by solvation. The electron energy distribution of these species can be represented by a probability density function W(E), which is a function of λ. In the case of reduction, an ET can occur from an occupied state in the electrode to the LUMO that has the corresponding energy. Thus, the rate constant of an electrochemical reduction is proportional to the integral of the product of the number of occupied states in the electrode and W(E) of LUMOs of redox-active species along the electron energy level:41,42
 | (6) |
Fig. 3b and c show the Tafel plots for Br2 reduction in MEPBr2n+1 at the Pt UME and carbon UME (black dots) and the fits of these plots to the Butler–Volmer model (blue line) and MHC model (red line). The current-overpotential equation of the MHC kinetics derived from eqn (6) was utilized to fit the experimental data to the MHC model. The details on the derivation of the current-overpotential equation are described in the ESI.† The experimental data agree well with the MHC model, revealing λ = 197 and 379 meV for the Pt UME and carbon UME, respectively. The Butler–Volmer model can explain the experimental data only for small values of η. A carbon UME has remarkably higher λ than that of a Pt UME. Correspondingly, not only iss/i0 but also η reaching iss are larger at carbon than at Pt.
Table S2† lists the λ values of Pt UMEs in buffers of different pHs on which λ was not dependent noticeably. In the microscopic ET theory, λ includes reorganization not only of solvents (outer-sphere reorganization energy, λo) but also of redox species (inner-sphere reorganization energy, λi). Since Br2 reduction involves bromide adsorption on the electrode, λ may be associated with λi through changes in the bond length between bromide and the electrode during ET. The binding strength of Pt to bromide should be influenced by the solution pH,43 and the MEPBr2n+1 droplet has a significant water content because even hydrophobic ILs are known to contain water when surrounded by an aqueous solution.12 But the experimental λ of Pt was not sensitive to pH. This shows that variation in Pt–Br binding strength with pH change affects reorganization energy within a limited range. Hence, the contribution of λi to λ is deemed to be negligible in this system.
Considering that Br2 reduction is an inner-sphere reaction occurring in the IHP, λo should reflect the structure of the IHP. It is widely accepted that ε of the solvating medium is the most crucial factor for λo not only in dilute electrolytes,3,6,7,44,45 but also in RT-IL.46–48 Several theoretical studies have proposed that λo is inversely proportional to ε in RT-ILs.46–48 In ionic liquids, the redox species are mainly surrounded by ions rather than solvents.49,50 Hence, polarizabilities of ions should be important for ε. Table S3† compares reorganization energies of MEPBr2n+1 and 1-butyl-1-methylpyrrolidinium polybromide (MBPBr2n+1). As predicted, the reorganization energy is smaller in MBPBr2n+1 which has higher cation polarizability.51 It is worth noting that interpretation of the reorganization energy of the IHP as a part of the EDL structure needs further study. Current reorganization energy models of RT-ILs are derived from the Debye–Hückel theory,46–48 which is based on the polarization of diluted electrolytes.52,53 But very strong Coulomb interactions among ions make the dielectric contribution of ILs complex. For example, hysteresis of the potential-dependent EDL structure of ILs has been reported,54–56 which may be associated with the ultraslow capacitive process of ILs.57,58 Changes of the effective dielectric constant of the IHP medium may alter the potential gradient between the nominal plane of the electrode and IHP.59
Effect of electrode surface charges on the reorganization energy
To examine the intrinsic electrode properties affecting λ, bare Pt was compared to surface-modified Pt. TiO2 is a suitable material for surface modification because it acts as a passive layer that minimizes the effects on the electrochemical reaction; moreover, it is chemically inert at the present experimental pH and potential. TiO2 was electrodeposited on the Pt UME using a previously reported method.60 The TiO2 coverage (θTiO2) of the TiO2-modified Pt electrode (TiO2@Pt) was calculated by comparing the Hupd values before and after electrodeposition (Fig. 4a).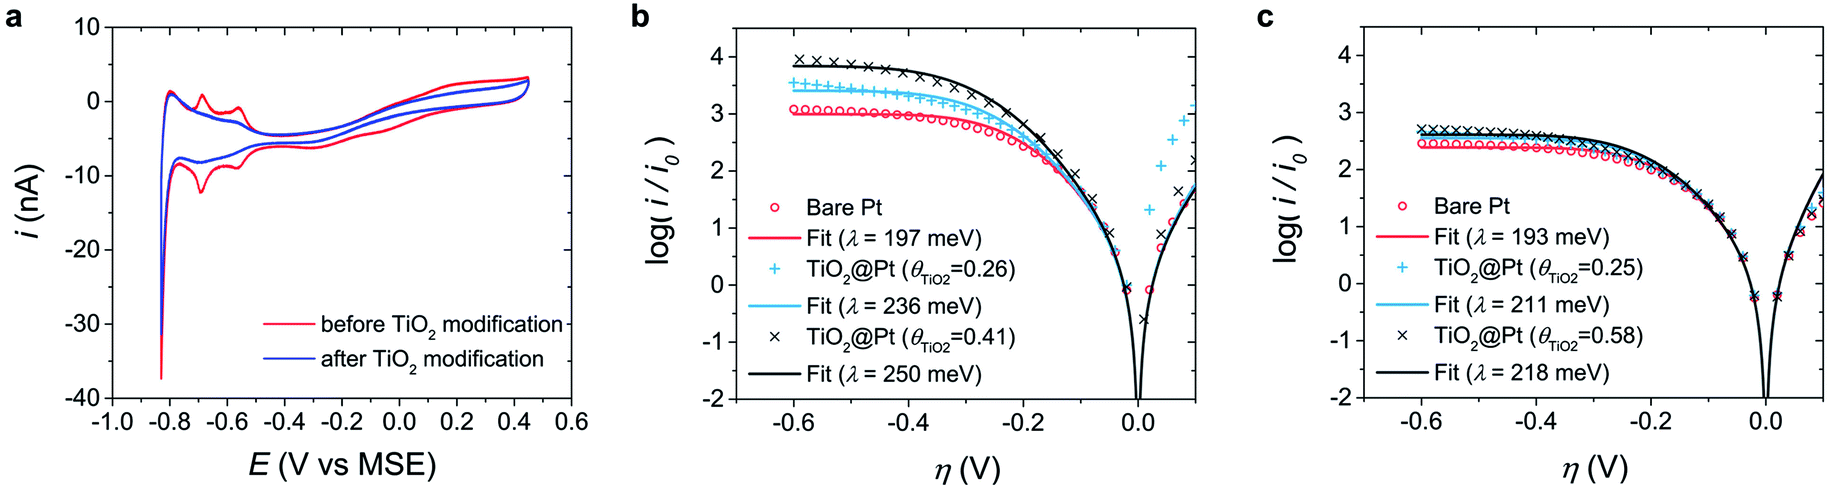 | ||
| Fig. 4 Tafel analyses of TiO2@Pt electrodes in MEPBr2n+1. (a) Hupd voltammogram at bare Pt and TiO2@Pt UMEs (θTiO2 = 0.25) in 1 M aqueous potassium phosphate buffer (pH 3) recorded at a scan rate of 250 mV s−1. The reference electrode was a mercury-mercurous sulfate electrode (MSE). (b and c) Normalized Tafel plots of TiO2@Pt with various θTiO2 values in MEPBr2n+1 at (b) pH 3 and (c) pH 4. The experimental data (markers) are compared to the fitting results of the MHC model (lines). | ||
Fig. 4b and c show the normalized Tafel plots of bare Pt and TiO2@Pt UMEs in the MEPBr2n+1 droplet synthesized at pH 3 and pH 4, respectively. The λ of TiO2@Pt increases with θTiO2 at pH 3, while no remarkable changes were observed at pH 4. The pH dependency of TiO2@Pt should be ascribed to the surface charge of TiO2 because the isoelectric point of TiO2 is pH 4–5;61,62 thus, the net surface charge of TiO2 is positive at pH 3 and almost zero at pH 4. Accordingly, the surface charge of Pt does not change significantly with pH because halides suppress the formation of Pt oxide. EIS analysis shown in the ESI (Fig. S3†) supports the pH dependent PZC of Pt and TiO2@Pt UMEs in MEPBr2n+1. Introducing charges on the electrode surface will alter the ionic composition of the IHP in the IL. The EDL of an IL is very compact because of its extremely high ionic strength; most of the charges at the electrode surface are compensated in the IHP. When the electrode surface is positively charged, Br− anions, which have a higher charge density than other anions in MEPBr2n+1, are likely to occupy the IHP to compensate for the surface charges. When the electrode is less positively charged, the MEP cations compensate for these charges proportionately. The polarizabilities of quaternary ammonium cations (10–20) are higher than that of Br− (5.8).63 Accordingly, the IHP medium of TiO2@Pt should be less polarizable at pH 3. Such a trend should manifest more at higher θTiO2. The λ value of TiO2@Pt at pH 4 is independent of θTiO2, and almost zero charge of TiO2 accounts for this. It is difficult to evaluate the λ value of TiO2@Pt at pH 2 or less because TiO2 is not stable at such low pH. In addition, the synthesis of the polybromide IL from an aqueous solution of MEPBr above pH 5 is accompanied by bromate formation, which can significantly change the composition of MEPBr2n+1. The experimental results from TiO2@Pt corroborate how electrode surface charge influences λ, which can explain the high λ of carbon compared to that of Pt. Being consistent with the work function and nonspecific adsorption of Br−, the PZC of carbon is more negative than that of Pt.64 Hence Br− is more probable in the IHP so that the medium in it should be less polarizable. It suggests that the net dielectric constant of the electrolytes around the carbon would be lower.
To date, majority of research has addressed electrocatalytic activity mostly in terms of the adsorption on the electrode materials based on the Sabatier principle.65–67 However, the community is increasingly realizing that it is insufficient to understand the electrocatalysis relying on the adsorption descriptor only.1 In line with a few recent approaches, our report here supports that the properties of electrode materials give rise to characteristic change in the reaction environment of the liquid phase in the vicinity of the electrode surface, significantly influencing the electrocatalytic current.
Conclusions
RT-ILs have emerged as promising electrolytes for electrocatalytic reactions.8,9 Water-in-salt electrolytes, which are attracting significant interest owing to their potential applications in batteries68 and electrocatalysis,69 have EDL structures similar to those of RT-ILs.70 In this study, the reorganization energy of Br2 reduction was evaluated in a RT-IL, MEPBr2n+1, which has an incredibly high diffusion coefficient for Br− and Br2. A distinct kinetically controlled steady-state current was observed at a high overpotential, and the Br2 reduction voltammogram could be successfully fitted to the MHC model. The reorganization energy as obtained for Br2 reduction is sensitive to the surface charges of the electrode. This can be explained by the polarizability of the IHP, which dramatically varies with the surface charges. As demonstrated in this work, polybromide RT-ILs can serve as a model system not only for RT-ILs but also for water-in-salt electrolytes, in order to understand the electrocatalytic activities related to the EDL structure. Employing the MEPBr2n+1 RT-IL, one could investigate how a variety of electrode surfaces, including electrode materials and surface modifications other than TiO2, affect the microscopic environment within the IHP so as to understand the given heterogeneous electron transfer kinetics. We believe that the findings of this work will provide new insights into the design of electrocatalysts.In future research, a wide range of cations with different polarizabilities will be employed in the polybromide IL to collect more pieces of evidence for the dependence of λ on the polarizabilities of the solution. In addition, computational studies on the polybromide–electrode interface could help with evaluating quantitative contribution of λo and λi, respectively.
Data availability
The data that supports the findings of this study are included in this article and ESI.† Further information is available from the corresponding author upon reasonable request.Author contributions
M. Kim and S. Park were responsible for the conceptualization, performing the experiments, data analysis, writing the original draft and review, and editing. These authors contributed equally. T. D. Chung was responsible for the funding acquisition, writing and editing, and supervision of the work.Conflicts of interest
There are no conflicts to declare.Acknowledgements
This research was supported by a National Research Foundation of Korea (NRF) grant funded by the Korean government (MSIT) (No. 2017R1E1A1A01074236 and 2021R1A5A1030054).References
- I. Ledezma-Yanez, W. D. Z. Wallace, P. Sebastián-Pascual, V. Climent, J. M. Feliu and M. T. M. Koper, Nat. Energy, 2017, 2, 17031 CrossRef CAS.
- F. J. Sarabia, P. Sebastián-Pascual, M. T. M. Koper, V. Climent and J. M. Feliu, ACS Appl. Mater. Interfaces, 2019, 11, 613–623 CrossRef CAS PubMed.
- B. Huang, K. H. Myint, Y. Wang, Y. Zhang, R. R. Rao, J. Sun, S. Muy, Y. Katayama, J. Corchado Garcia, D. Fraggedakis, J. C. Grossman, M. Z. Bazant, K. Xu, A. P. Willard and Y. Shao-Horn, J. Phys. Chem. C, 2021, 125, 4397–4411 CrossRef CAS.
- D. C. Grahame, Chem. Rev., 1947, 41, 441–501 CrossRef CAS PubMed.
- N. F. Mott and R. J. Watts-Tobin, Electrochim. Acta, 1961, 4, 79–107 CrossRef CAS.
- R. E. Bangle, J. Schneider, E. J. Piechota, L. Troian-Gautier and G. J. Meyer, J. Am. Chem. Soc., 2020, 142, 674–679 CrossRef CAS PubMed.
- R. E. Bangle, J. Schneider, D. T. Conroy, B. M. Aramburu-Trošelj and G. J. Meyer, J. Am. Chem. Soc., 2020, 142, 14940–14946 CrossRef CAS PubMed.
- J. Snyder, T. Fujita, M. W. Chen and J. Erlebacher, Nat. Mater., 2010, 9, 904–907 CrossRef CAS PubMed.
- M. Asadi, K. Kim, C. Liu, A. V. Addepalli, P. Abbasi, P. Yasaei, P. Phillips, A. Behranginia, J. M. Cerrato, R. Haasch, P. Zapol, B. Kumar, R. F. Klie, J. Abiade, L. A. Curtiss and A. Salehi-Khojin, Science, 2016, 353, 467–470 CrossRef CAS PubMed.
- G. T. Kim, S. S. Jeong, M. Z. Xue, A. Balducci, M. Winter, S. Passerini, F. Alessandrini and G. B. Appetecchi, J. Power Sources, 2012, 199, 239–246 CrossRef CAS.
- A. Balducci, R. Dugas, P. L. Taberna, P. Simon, D. Plée, M. Mastragostino and S. Passerini, J. Power Sources, 2007, 165, 922–927 CrossRef CAS.
- G. R. Zhang and B. J. M. Etzold, J. Energy Chem., 2016, 25, 199–207 CrossRef.
- M. M. Islam, M. T. Alam, T. Okajima and T. Ohsaka, J. Phys. Chem. C, 2009, 113, 3386–3389 CrossRef CAS.
- C. Y. Peñalber and S. Baldelli, J. Phys. Chem. Lett., 2012, 3, 844–847 CrossRef PubMed.
- M. Li, S. Liu, L. Xie, J. Yan, C. Lagrost, S. Wang, G. Feng, P. Hapiot and B. Mao, ChemElectroChem, 2021, 8, 983–990 CrossRef CAS.
- M. R. Thorson, K. I. Siil and P. J. A. Kenis, J. Electrochem. Soc., 2013, 160, F69–F74 CrossRef CAS.
- C. E. D. Chidsey, Science, 1991, 251, 919–922 CrossRef CAS PubMed.
- M. C. Henstridge, E. Laborda, N. V. Rees and R. G. Compton, Electrochim. Acta, 2012, 84, 12–20 CrossRef CAS.
- P. Bai and M. Z. Bazant, Nat. Commun., 2014, 5, 3585 CrossRef PubMed.
- D. T. Boyle, X. Kong, A. Pei, P. E. Rudnicki, F. Shi, W. Huang, Z. Bao, J. Qin and Y. Cui, ACS Energy Lett., 2020, 5, 701–709 CrossRef CAS.
- D. S. Silvester and R. G. Compton, Z. Phys. Chem., 2006, 220, 1247–1274 CrossRef CAS.
- P. Hapiot and C. Lagrost, Chem. Rev., 2008, 108, 2238–2264 CrossRef CAS PubMed.
- S. Park, D. H. Han, J. G. Lee and T. D. Chung, ACS Appl. Energy Mater., 2020, 3, 5285–5292 CrossRef CAS.
- D. H. Han, S. Park, E. J. Kim and T. D. Chung, Electrochim. Acta, 2017, 252, 164–170 CrossRef CAS.
- S. Park, H. Kim, J. Chae and J. Chang, J. Phys. Chem. C, 2016, 120, 3922–3928 CrossRef CAS.
- M. E. Easton, A. J. Ward, B. Chan, L. Radom, A. F. Masters and T. Maschmeyer, Phys. Chem. Chem. Phys., 2016, 18, 7251–7260 RSC.
- H. Haller, M. Ellwanger, A. Higelin and S. Riedel, Z. Anorg. Allg. Chem., 2012, 638, 553–558 CrossRef CAS.
- K. Sonnenberg, L. Mann, F. A. Redeker, B. Schmidt and S. Riedel, Angew. Chem., Int. Ed., 2020, 59, 5464–5493 CrossRef CAS PubMed.
- I. Ruff and V. J. Friedrich, J. Phys. Chem., 1972, 76, 2957–2958 CrossRef CAS.
- I. Rubinstein, M. Bixon and E. Gileadi, J. Phys. Chem., 1980, 84, 715–721 CrossRef CAS.
- I. Rubinstein and E. Gileadi, J. Electrochem. Soc., 1979, 126, 1368–1369 CrossRef CAS.
- R. G. Compton and C. E. Banks, Understanding voltammetry, World Scientific (Europe), 2007 Search PubMed.
- T. Iwasita and M. C. Giordano, Electrochim. Acta, 1969, 14, 1045–1059 CrossRef CAS.
- G. Faita, G. Fiori and T. Mussini, Electrochim. Acta, 1968, 13, 1765–1772 CrossRef CAS.
- R. E. White and S. E. Lorimer, J. Electrochem. Soc., 1983, 130, 1096–1103 CrossRef CAS.
- A. R. Kucernak and C. Zalitis, J. Phys. Chem. C, 2016, 120, 10721–10745 CrossRef CAS.
- N. Li and J. Lipkowski, J. Electroanal. Chem., 2000, 491, 95–102 CrossRef CAS.
- A. T. Hubbard and F. C. Anson, Anal. Chem., 1966, 38, 1887–1893 CrossRef CAS.
- N. Garcia-Araez, V. Climent, E. Herrero, J. Feliu and J. Lipkowski, J. Electroanal. Chem., 2006, 591, 149–158 CrossRef CAS.
- G. D. Allen, M. C. Buzzeo, C. Villagrán, C. Hardacre and R. G. Compton, J. Electroanal. Chem., 2005, 575, 311–320 CrossRef CAS.
- Y. Zeng, R. B. Smith, P. Bai and M. Z. Bazant, J. Electroanal. Chem., 2014, 735, 77–83 CrossRef CAS.
- S. Amemiya, N. Nioradze, P. Santhosh and M. J. Deible, Anal. Chem., 2011, 83, 5928–5935 CrossRef CAS PubMed.
- G. A. B. Mello, V. Briega-Martos, V. Climent and J. M. Feliu, J. Phys. Chem. C, 2018, 122, 18562–18569 CrossRef CAS.
- B. Huang, R. R. Rao, S. You, K. Hpone Myint, Y. Song, Y. Wang, W. Ding, L. Giordano, Y. Zhang, T. Wang, S. Muy, Y. Katayama, J. C. Grossman, A. P. Willard, K. Xu, Y. Jiang and Y. Shao-Horn, JACS Au, 2021, 1, 1674–1687 CrossRef CAS PubMed.
- B. M. Aramburu-Trošelj, R. E. Bangle and G. J. Meyer, J. Chem. Phys., 2020, 153, 134702 CrossRef PubMed.
- A. Patah, J. Bächle and G. Grampp, J. Electrochem. Soc., 2019, 166, H635–H639 CrossRef CAS.
- T. Xiao and X. Song, J. Chem. Phys., 2013, 138, 114105 CrossRef PubMed.
- T. Xiao and X. Song, J. Chem. Phys., 2014, 141, 134104 CrossRef PubMed.
- J. W. Yan, Z. Q. Tian and B. W. Mao, Curr. Opin. Electrochem., 2017, 4, 105–111 CrossRef CAS.
- Y. Zhong, J. Yan, M. Li, L. Chen and B. Mao, ChemElectroChem, 2016, 3, 2221–2226 CrossRef CAS.
- E. I. Izgorodina, M. Forsyth and D. R. MacFarlane, Phys. Chem. Chem. Phys., 2009, 11, 2452–2458 RSC.
- A. M. Smith, A. A. Lee and S. Perkin, J. Phys. Chem. Lett., 2016, 7, 2157–2163 CrossRef CAS PubMed.
- G. K. Mishra and R. Kant, J. Power Sources, 2020, 473, 228467 CrossRef CAS.
- M. Drüschler, B. Huber, S. Passerini and B. Roling, J. Phys. Chem. C, 2010, 114, 3614–3617 CrossRef.
- M. Drüschler, B. Huber and B. Roling, J. Phys. Chem. C, 2011, 115, 6802–6808 CrossRef.
- K. Motobayashi, K. Minami, N. Nishi, T. Sakka and M. Osawa, J. Phys. Chem. Lett., 2013, 4, 3110–3114 CrossRef CAS.
- M. Drüschler, N. Borisenko, J. Wallauer, C. Winter, B. Huber, F. Endres and B. Roling, Phys. Chem. Chem. Phys., 2012, 14, 5090–5099 RSC.
- N. Nishi, Y. Hirano, T. Motokawa and T. Kakiuchi, Phys. Chem. Chem. Phys., 2013, 15, 11615–11619 RSC.
- R. Kant, J. Kaur and G. K. Mishra, J. Phys. Chem. C, 2020, 124, 2273–2288 CrossRef CAS.
- D. Eisenberg, H. S. Ahn and A. J. Bard, J. Am. Chem. Soc., 2014, 136, 14011–14014 CrossRef CAS PubMed.
- J. P. Fitts, M. L. MacHesky, D. J. Wesolowski, X. Shang, J. D. Kubicki, G. W. Flynn, T. F. Heinz and K. B. Eisenthal, Chem. Phys. Lett., 2005, 411, 399–403 CrossRef CAS.
- J. W. Bullard and M. J. Cima, Langmuir, 2006, 22, 10264–10271 CrossRef CAS PubMed.
- E. Heid, M. Heindl, P. Dienstl and C. Schröder, J. Chem. Phys., 2018, 149, 044302 CrossRef PubMed.
- V. Likholobov and P. Simonov, in Catalysis and Electrocatalysis at Nanoparticle Surfaces, CRC Press, 2003 Search PubMed.
- J. Zheng, W. Sheng, Z. Zhuang, B. Xu and Y. Yan, Sci. Adv., 2016, 2, e1501602 CrossRef PubMed.
- S. A. Giles, J. C. Wilson, J. Nash, B. Xu, D. G. Vlachos and Y. Yan, J. Catal., 2018, 367, 328–331 CrossRef CAS.
- D. Strmcnik, M. Uchimura, C. Wang, R. Subbaraman, N. Danilovic, D. Van Der Vliet, A. P. Paulikas, V. R. Stamenkovic and N. M. Markovic, Nat. Chem., 2013, 5, 300–306 CrossRef CAS PubMed.
- L. Suo, O. Borodin, T. Gao, M. Olguin, J. Ho, X. Fan, C. Luo, C. Wang and K. Xu, Science, 2015, 350, 938–943 CrossRef CAS PubMed.
- Q. Dong, X. Zhang, D. He, C. Lang and D. Wang, ACS Cent. Sci., 2019, 5, 1461–1467 CrossRef CAS PubMed.
- M. McEldrew, Z. A. H. Goodwin, A. A. Kornyshev and M. Z. Bazant, J. Phys. Chem. Lett., 2018, 9, 5840–5846 CrossRef CAS PubMed.
- X. Chen, M. A. Rickard, J. W. Hull, C. Zheng, A. Leugers and P. Simoncic, Inorg. Chem., 2010, 49, 8684–8689 CrossRef CAS PubMed.
Footnotes |
| † Electronic supplementary information (ESI) available: Details on methods, Tables S1–S3 and Fig. S1–S3. See https://doi.org/10.1039/d2sc01410f |
| ‡ These authors contributed equally to this work. |
| This journal is © The Royal Society of Chemistry 2022 |