 Open Access Article
The interfacial and assembly properties of in situ producing silica nanoparticle at oil–water interface
Zhongliang Hu ad,
Hongxing Zhangc and
Dongsheng Wen*ab
aSchool of Chemical and Process Engineering, University of Leeds, Leeds, LS2 9JT, UK. E-mail: d.wen@leeds.ac.uk; d.wen@buaa.edu.cn
bSchool of Aeronautic Science and Engineering, Beihang University, Beijing, 100191, China
cBeijing Key Laboratory of Space Thermal Control Technology, China Academy of Space Technology, Beijing, 100094, China
dShandong Laboratory of Yantai Advanced Materials and Green Manufacturing, Yantai, 264006, China
First published on 29th November 2022
Abstract
In multiphase materials, structured fluid–fluid interfaces can provide mechanical resistance against destabilization, applicable for conformance control, Pickering emulsion, liquid 3D printing and molding, etc. Currently all research prepare the particle-ladened fluid–fluid interfaces by dispersing ex situ acquired particles to the immiscible interface, which limits their application in the harsh environment, such as oil reservoir which can impair particle stability and transport ability. Here, we investigated the interfacial and assembly properties of the interface where SiO2 nanoparticles (NPs) were in situ produced. The experimental results show that ammonia as catalyst could accelerate the processes of silica NPs formation as well as the interfacial tension (IFT) evolution. High temperature could not accelerate the reaction processes to achieve the lowest equilibrium IFT, but it induced the sine-wave IFT evolution curves regardless of the presence of ammonia. The equilibrium IFTs corresponded to the saturation states of interfaces trapping with SiO2 NPs, while the sine-wave fluctuating patterns of IFT were attributed to the alternating transition between interfacial jammed and unjammed states changing along with the reaction process. Silica NPs diffusing into aqueous phase with high salinity also showed good stability, due to the abundant surface decoration with in situ anchored organic species.
1 Introduction
Assembly of colloidal particles at immiscible fluid interfaces is a promising technique to reduce the interfacial tension and fabricate structural liquid–liquid interface. The technique has found widespread uses, including drug encapsulation and delivery,1 enhanced oil recovery (EOR),2,3 all liquid 3D printing and molding,4–6 and Bijels which are applicable in catalysis, energy systems, tissue engineering and microfluidics.7,8 A typical example is the so-called Pickering emulsion which has been widely used in drug encapsulation and enhanced oil recovery.9,10 Pickering emulsions are more stable than classic surfactant-stabilized emulsion because of the interfacial energy reduced by nanoparticles irreversibly bound to the interface.1 In addition, paramagnetic NPs attached at the immiscible liquid interface have been used as novel sensor or image-enhancing agents to improve formation evaluation and EOR dynamic diagnosis.11Currently, there are two main ways to prepare the interface stabilized by particles or assemble NPs at the immiscible interface. The initial way investigated to do this was simply by dispersing the colloidal particles at the oil–water interface. The surface chemistry of colloidal particles, mainly the wettability, have to be tuned carefully to ensure the formation of a monolayer particle at the interface. Additionally, the interface stability is highly affected by nanoparticle's wettability, because the energy needed for a particle detaching from the interface is influenced by particle's wettability, as calculated by Gibbs equation. A previous study showed that good affiliation of nanoparticle to the interface requires the particle exhibiting a contact angle close to 90°.8 Relatively small derivation away from this angle could cause remarkable reduction in detaching energy, leading to the particle behaving as destabiliser rather than stabiliser.6 Yu et al. found that silica NPs coated by poly(vinylpyrrolidone) (PVP) have good foamability and long-term foam stability, regardless of the fact that these two components individually exhibited very little potential to partition at the air–water interface.12 Actually, this approach is currently a dominant solution to generate stable immiscible interface or structure for various application, such as CO2 foam for EOR,13–15 air/liquid foam for mobility control in silica sand pack,16,17 and oil-in-water emulsion.18
An alternative strategy is to disperse functionalised nanoparticles in one fluid, and end-functionalized oligomeric or polymeric ligands in the second immiscible fluid, where the latter functionalization is complementary to the functionality on the NPs. The NPs and ligands will interact at the interface, in situ forming functionalized nanoparticles that act as surfactants to reduce the IFT and stabilize the interface.19–21 Compared with the way of using colloidal particles, this way is far simple because there is no special chemistry necessary. Chai et al. used silica NPs functionalized with –COOH groups and the monoamine terminated Polydimethylsiloxane (PDMS-NH2) as the ligands, to fabricate structured interface.1 They found that increasing ionic strength could facilitate a denser assembly and packing of NPs at the interface, because the electrostatic interactions between NPs which hindered the adsorption of NPs to interface was reduced by a higher ionic strength. Toor et al. showed that stable water-in-oil droplets could be generated in a T-junction glass microfluidic device for various combinations of polymer ligands and nanoparticles bearing complementary functionalities.21 Huang et al. used polyoxometalates (POMs) dispersed in water and PDMS-NH2 dissolved in toluene to form the POM surfactants that significantly lowered the interfacial tension and stabilized the liquids via interfacial elasticity.22
As reviewed above, the pre-synthesized colloid particle and a wide range of chemical stabilizer such as surfactants and polymers often coexist to provide desirable properties. However, these pre-synthesized NPs usually have limited application in harsh environment. For instance, the oil/gas reservoirs are usually with high salinity high temperature and pressure, and large tortuous porous 3D structure in which NPs would have a high retention due to eliminated electrostatic stability and adsorbable surface. Thus, injecting and delivering nanoparticle in such kind of environment is highly challenging. To disperse NPs at the oil–water interface, they have to flow through a long distance in the reservoir, ideally like a tracer with 100% breakthrough ability. However, there are few particles reported which have such capability to be transported in the hydrocarbon reservoirs with little retention.23 Hu et al. reported that the carbon quantum dots (CQDs) produced from D-(+)-xylose had a tracer-like breakthrough ability in glass packed column and eventually achieve 100% breakthrough in the sandstone reservoir, but these carbon dots still had a high retention rate in carbonate rock.24
To avoid the problem of nanoparticle stability and retention in the harsh environment, we propose an innovative way to in situ synthesize and functionalize nanoparticle at immiscible interfaces, and in the meantime tune the interface tension and achieve nanoparticle's assembly at the interface. As the synthesis of silica nanoparticles via hydrolyzing tetraethyl orthosilicate is already well known,25,26 we are not investigating the particle synthesis reaction itself in this research. Instead, we are focusing on the interfacial and assembling properties when in situ producing SiO2 nanoparticles at the oil–water interface, specifically on how the interfacial tension changes under the influence of catalyst and various temperatures, and how the produced particles assemble at the oil–water interface. To answer these two main questions, we also investigated three auxiliary questions, including how the particles' surfaces are in situ functionalized, whether the particles can be in situ stabilized, and how quick the SiO2 NPs can be produced at oil–water interface. Those three questions are highly related to the interfacial assembly of nanoparticle at immiscible interface. The experiment findings hold a great potential to generate the stable immiscible interface or structure for various application, such as foam/emulsion for mobility control in oil reservoirs, image-enhancing agents for reservoir diagnosis, 3D printing, encapsulation and drug delivery.
2 Materials and characterization
2.1 Materials
KT24 mineral oil, which is a highly refined mineral oil consisting of saturated aliphatic and alicyclic hydrocarbons, was purchased from the Kerax Ltd. U.K. and used as the oil phase. Synthetic American Petroleum Institute (API) brine (nominally containing 8% NaCl and 2 wt% CaCl2, laboratory grade) was used as the aqueous phase throughout the experiments. Tetraethyl orthosilicate (Sigma Aldrich, U.K.), abbreviated as TEOS, was used as the precursor to synthesis silica nanoparticles.2.2 Nanoparticle synthesis at the oil–water interface
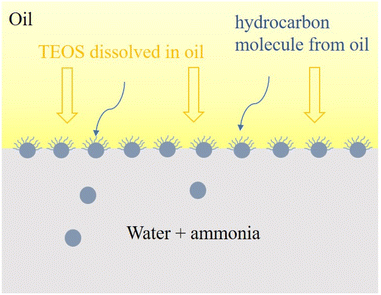
Silica nanoparticles (NPs) can be synthesized by simple hydrolysis of the single reactant TEOS. There are two batches of samples prepared for the macroscopic study of the process of NP synthesis at the oil–water interface. Various concentrations of TEOS (5, 10, 20, 30 and 50% by volume) were dissolved in oil phase, and 4 mL of this organic mixture was placed as oily supernatent above API brine to form the 1st batch of samples. In order to investigate the influence of ammonia on the reaction rate, API brine with 10 vol% NH4OH was also used as aqueous phase to prepare the 2nd batch of samples.The monomers, TEOS, was hydrolysed and condensed at the oil–water interface when it diffused to the interface from oil phase and contacted with brine, as shown in eqn (1) and Fig. 1. Ammonia was used as catalyst to facilitate the hydrolysis process and more importantly provide the particle with a negative, stabilizing functional ground on its surface.
 | (1) |
2.3 Determination of the reaction rate
The macroscale batch experiments were carried out to indirectly investigate the rate of nucleation and growth of nanoparticle at the oil–water interface. Since UV-vis spectroscopy is a common technique to determine the concentration and particle size,27 it was used here to determine the concentration of SiO2 NPs in API brine. The particle was only synthesized at the oil–water interface, and then they diffused or be extruded away from the interface as the interface was accumulatively occupied by the produced NPs. Finally, almost all NPs were dispersed in the lower aqueous phase while the transparence of upper organic phase remianed unchanged duing the whole reaction process. Therefore, the time-dependent concentration profile of NPs in aqueous phase was used to approximately represent the rate of NPs formation at the interface. Samples were taken from the aqueous phase using plastic pipette. Then the UV-vis absorbance spectra were obtained by UV-vis spectrometer (UV-1800, Shimadzu) operating with the wavelength ranging from 200 nm to 1100 nm.The reaction rate was also characterized by tracking the dynamic IFT change. It has been confirmed that with NPs assembling on the oil–water interface, the interfacial tension can be altered.6 By comparing the dynamic IFTs between the oil–water interfaces with and without reaction, the reaction rate can be also indirectly determined.
2.4 Nanoparticles characterization
A scanning electron microscope (SEM, FEI Quanta 650 FEG-ESEM) operating at 200 kV was used to characterize the morphology and element composition of the interfacial synthesized SiO2 nanoparticles. The size of the silica NPs in API brine was analysed by dynamic light scattering method using Zetasizer instrument (Zetasizer Nano ZS, Malvern Instruments Ltd), without being extracted from the aqueous phase.Fourier transform infrared (FTIR) analysis were conducted to study the surface chemical vibrational modes of the prepared silica NPs. The FTIR spectra was obtained using an infrared spectrometer (Nicolet™ iS™ 10, Thermo Scientific). Around 10 mg sample was placed in the FTIR scanning path and kept at room temperature. The spectra were recorded with a wavelength resolution of 4 cm−1 in the ranges of 400–4000 cm−1 using 32 scans, and a background spectrum was collected first in order to cancel out bands from water vapour, CO2 and other noise.
The material composition for the prepared silica spheres was determined using the TGA/DSC-2 instrument (Mettler Toledo). 20 ± 5 mg of sample was weighted in a 70 μL alumina crucible and placed on the TGA/DSC-2 sample holder. Experiment was conducted under a constant flow rate (50 mL min−1) of nitrogen purge gas and the sample was heated from 30 °C to 900 °C with a temperature increasement of 10 °C min−1.
Two types of silica nanoparticles are prepared for the FTIR tests. One was synthesized by mixing 1.2 mL TEOS with 10 mL API brine containing 10% NH4OH, without the influence of mineral oil. The another one was synthesized by adding 4 mL mineral oil dissolved with 30 wt% TEOS in 10 mL API brine containing 10% NH4OH, to investigate the effect of oil on the surface component of synthesized nanoparticle. The sample was then magnetically stirred for 4 hours at room temperature for the silica NPs synthesis. After reaction, the NPs were extracted from the lower aqueous phase and sequentially washed with ethanol and deionized water under centrifugation to remove remaining organic matters and salt on their surface. The washing process was repeated 3 times to ensure a thorough clean as much as possible. Finally, the obtained silica NPs were dried in a vacuum oven at 50 °C for 1 day to remove any moisture on their surfaces.
2.5 Stability of nanoparticles
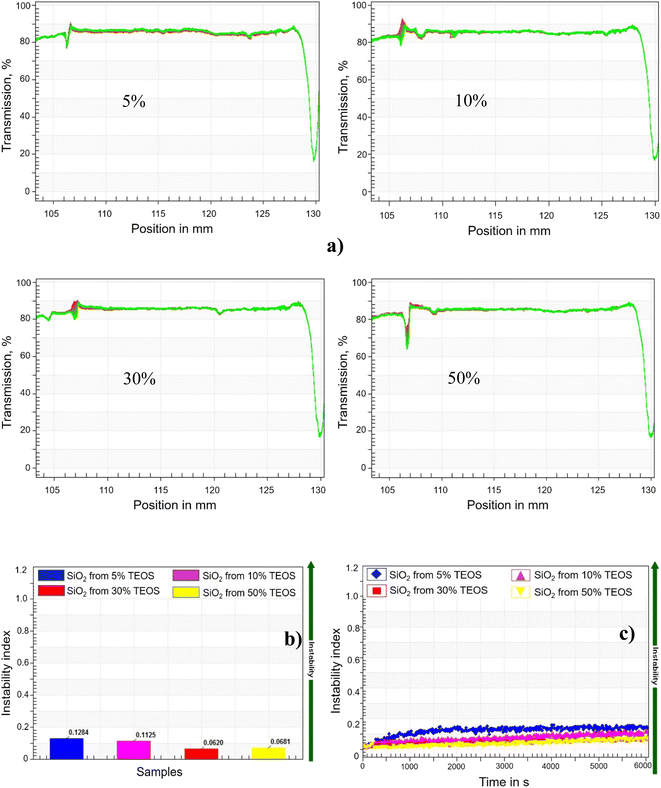
The stability of synthesized silica NPs against high salinity was characterized by recording the transmission of near-infrared (NIR) light passing through the samples, which were centrifuged with a LUMiSizer analytical photocentrifuge (LUMiSizer 6110, Lum GmbH) to introduce an additional accelaration of gravity. The 0.5 mL of suspension was filled in a polyamide cell with 2 mm of path length, and then centrifuged for 47 min at 280 rpm (light factor of 1, 25 °C, 865 nm NIR), which was equivalent to 32 days in the real time. The instability index and sedimentation velocity of NPs were calculated by the installed software (SEPView 9.0; LUM), through the function module of ‘stability analysis’ and ‘front tracking analysis’, respectively. The light transmission rates alongside the depth of cell filling with sample, were monitored by the NIR light passing through the cell at various deep position. The change of NPs concentration can be quantitatively characterized by the transmission rate of NIR light, and the instability indexes were calculated based on the evolution of transmission rate. Higher instability index means the NPs suspension is less stable. On the other hand, if sedimentation happened, the descent of phase-separation line (the front line) can also be tracked by the transmitting NIR light.2.6 Interfacial tension measurement
The interfacial tension (IFT) between the aqueous phase and mineral oil, the organic phase, was measured with a dynamic pendant drop tensiometer (KSV CAM 200). The mineral oil mixed with TEOS was injected by a hooked needle (U-shape) into a quartz cuvette filled with aqueous phase. The oil droplet was hung upwards on the needle tip. The volume of the droplet was not controlled, but the injection was stopped just before the oil droplet detaching from the needle tip. The values of the IFT were obtained by axisymmetric drop shape analysis. The drop image was recorded each second by a high-speed camera for one hour. All interfacial measurements were conducted at ambient pressure.3 Results and discussion
3.1 The properties of nanoparticles in situ produced at interface
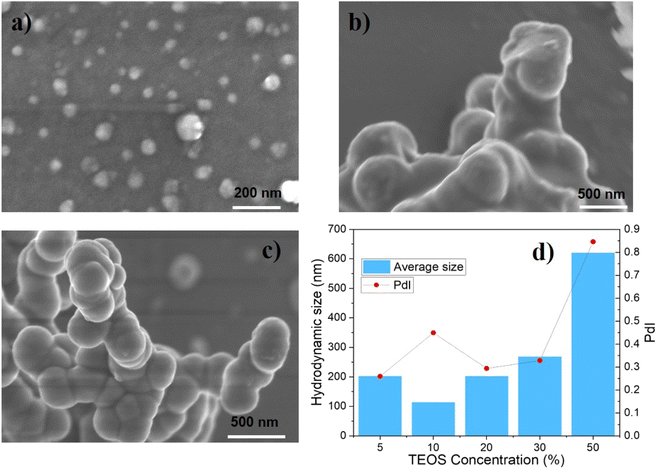
The particle size increased with the concentration of TEOS in mineral oil, as seen from the SEM images and DLS data in Fig. 2. Moreover, the degree of particles' sphericity and size polydispersity index seems better as the precursor concentration increased from 10% to 30%. This means that higher precursor concentration accelerated the rate of nucleation and growth, which tended to provide larger and more uniform nanoparticles.
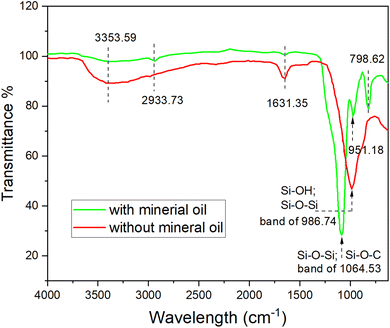 | ||
| Fig. 4 The ATR-FTIR spectra of SiO2 synthesized with the presence of mineral oil and without mineral oil. | ||
The broad absorption band at 986 cm−1 for red line can be assigned to superimposition of majority of Si–OH bonding and various SiO2 peaks.26 However, many of the silanol groups were converted to covalent bond of Si–O–C groups and Si–O–Si groups,26,28 which can be proven by the strong stretching at the broad band of 1064.53 cm−1 for green line and significant reduction of the 986 cm−1 adsorption band for red line in Fig. 4. With the presence of mineral oil, the hydrolysis and condensation of TEOS might not be complete, resulting in a partly cross-linked silica matrix that contains ethoxy groups in place of oxygen-bridged silicon atoms.30 Thus, the broad band of 1064.53 cm−1 for green line was a superimposition of those two kinds of Si–O bonds. The adsorption band at 2933.73 cm−1 can be used to identify the presence of unreacted TEOS in the silica particles, which was also confirmed by the NMR results in previous study.26 Therefore, we can deduce that when hydrolysed from TEOS with mineral oil, some organic species from the oil phase and unreacted TEOS were able to anchor on the silica NPs' surface due to physicochemical adsorption, as discussed in the following paragraphs.
It was recognized, as early as in 1961, that alkoxylation reaction occurred on silica surfaces and the surface could be hydrophobic.31 Then, Van Helden et al. also reported the presence of carbon in the composition of Stöber silica particles.32 The presence of carbon compounds in the particle shell layers with a few nanometres thickness was even observed quantitatively for the silica nanoparticles.25 Luo et al. found that the adsorption of alkoxy species on silica surface is difficult to be detected by IR spectroscopy due to low sensitivity. But they provided a direct evidence to confirm the adsorption of alkoxy species by measuring the contact angle on flat silica.33 In this research, some organic species, especially the unreacted TEOS molecules were possibly anchored on silica particles due to alkoxylation reaction.
As for the physical adsorption, several recent reports have concluded that the silica spheres prepared with Stöber method have nanopores (diameter ∼1 nm).34–36 These micropores can presumably trap components from the synthesis environment such as water, ethanol and ammonia. To confirm the loading capacity, direct measurement of microporosity and molecular accessibility in Stöber spheres was conducted by gas adsorption isotherms.34,36 Therefore, in this study the hydrocarbon molecules from mineral oil, such as aliphatic and alicyclic molecules abundantly existing at the oil–water interface, were also possibly being trapped in the silica matrix, due to the microporous structure and the alkylated hydrophobic surface.
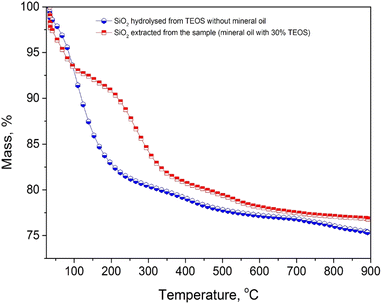
In contrast, with the presence of mineral oil, four steps of weight loss were present for the characteristic TGA curve. The first step within 50–120 °C was possibly due to the desorption of water molecules and the second one within 120–200 °C was associated with continuous release of water, ethanol and ammonia trapped inside nanopores or on the surface of silica nanoparticle. The third step between 200 °C and 320 °C could be identified as condensation of hydroxyl groups and combustion of interior ethanol or ethoxy groups.30 Above 320 °C, there was a gradual mass loss till 900 °C which could be attributed to decomposition of carbon compounds in the particle shell layers. The carbon shell was likely composed of the alkoxy species anchored via ethoxylation effect, the unreacted TEOS trapped in silica particles, and the trapped hydrocarbon molecule from mineral oil.25,31,32 From the mass loss it can be suggested that the silica NPs had been functionalised with around 10 wt% carbon components and –OH groups. The adsorbed organic species could have a direct impact on the enhanced stability in the high-ionic environment where the nanoparticles were in situ synthesised.
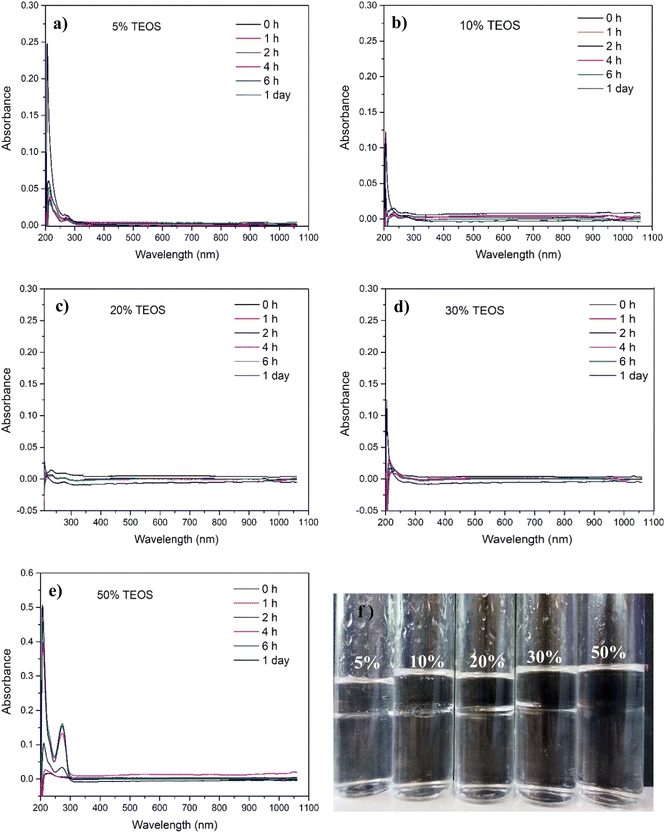
3.2 Reaction rate affected by catalyst
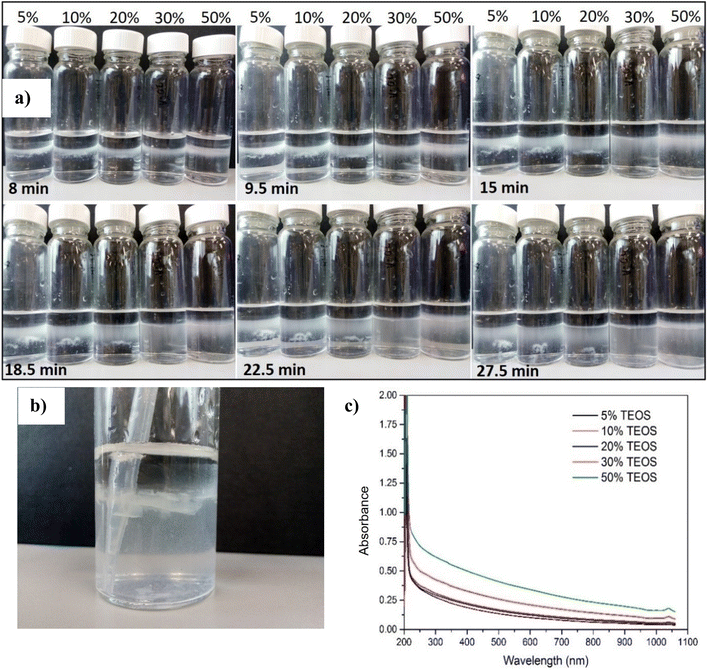
The nanoparticle formation speed was indirectly reflected by the UV-vis absorbance of silica nanoparticle in the aqueous phase. Fig. 6 shows the absorbance of aqueous phase (the denser liquid phase in Fig. 6f) changing against the light wavelength and time. At the beginning, the denser phase was only API brine without ammonia, and the lighter phase was mineral oil with TEOS at different concentrations 5, 10, 20, 30 and 50% volumetrically relative to the mineral oil. From the UV-vis absorbance spectra, it can be observed that there was almost no increase of the absorbance curve in one day for all TEOS concentrations except the 50% one, which means that the reaction rates were very slow for precursor concentrations lower than 50% and thus the produced NPs in the aqueous phase was very low. However, the absorbance between 250 and 300 nm, which corresponded to the absorption peak area of the fabricated silica NPs, was observed with obvious increase after one hour as the TEOS concentration increased to 50 vol%. This means that higher precursor concentration facilitated the reaction of producing SiO2 NPs.With the presence of NH4OH, characterization of the reaction rate could not be measured by UV-vis absorbance like Fig. 6a, because the nanoparticle formation was too quick. Therefore, the appearances of samples were presented here to show the dynamic concentration of nanoparticle diffused into aqueous phase. It can be clearly seen from Fig. 7 that with addition of NH4OH, much quicker reaction happened which was evidenced by the silica observed in aqueous phase in just 8 min and achieved rather high concentration in 27.5 min. The silica nanoparticles were synthesized at the oil–water interface just a few minutes after adding the mineral oil dissolved with TEOS. Then, particles produced at the oil/water interface diffused down into the aqueous phase, because the interface had reached the maximum loading capacity and the electrostatic interactions between NPs hindered further adsorption of NPs onto the interface.1 Particles tending to diffuse into brine phase rather than oil phase also indicated that the particles were water wetting overall, even though some hydrocarbon molecules anchored on their surface as analysed in Section 3.1. Consistent with the cases of absence of ammonia, the reaction rate was increased as increase of added TEOS concentration, which can be verified by the faster speed of silica diffusing into aqueous phase at higher TEOS concentration and the absorbance value raised with the increase of TEOS concentration in Fig. 7c.
The oil–water interface where the silica nanoparticle film forming, was crushed using a plastic pipette in Fig. 7b. A silica film was clearly seen after the interface was broken, which further confirmed that the nanoparticle could stay and assemble at the interface after nucleation and growth. Comparison between Fig. 6 and 7, it can be obviously concluded that with the catalytic effect of NH4OH, the reaction time needed was much shorter than those samples without NH4OH catalyst. As ammonia is cheap and has been widely used in industry and agriculture,37,38 it can be injected into reservoir as catalysis to facilitate the reaction of in situ producing nanoparticle for EOR application. The concentration of NH4OH also do not have to be high, 5% in this research was enough to trigger the reaction and generate a reasonable reaction rate.
3.3 Interfacial tension affected by in situ nanoparticles synthesis and assembly
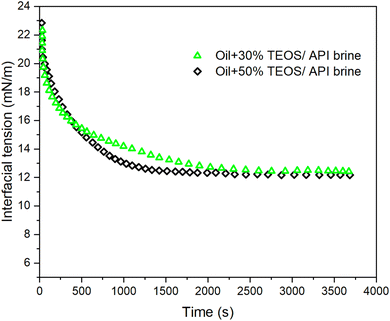
Moreover, the equilibrium IFTs for the cases with ammonia were lower than those without ammonia, for both TEOS concentrations at 30% and 50%. The influence of ammonia on the IFT change can be excluded, because the equilibrium IFT between oil and brine containing ammonia was as high as 38.49 mN m−1 when TEOS was not added in oil (Fig. 8). Therefore, we can conclude that the IFT decline was only due to the formation of NP at the oil–water interface, which could behave like surfactant to reduce IFT. The crushed silica film at immiscible interface in Fig. 7b confirmed that the silica NPs were synthesized and then stayed at the oil–water interface like surfactant. Meanwhile, the sequential images of oil droplet in Fig. 9c–e also confirmed that there were NPs formed on the surface of oil drop.
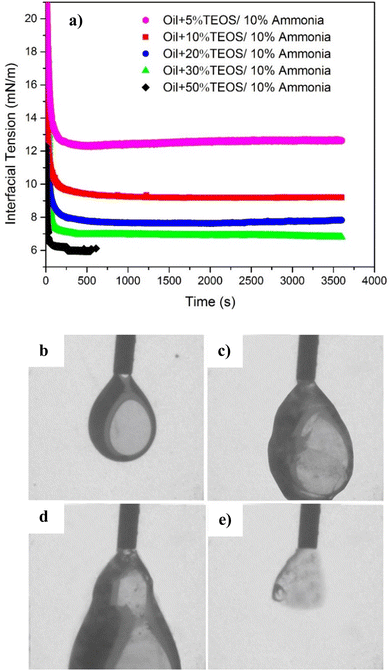
The dynamic interfacial tensions for different TEOS content (5, 10, 20, 30 and 50%) at the same NH4OH concentrations (10% by volume) are shown in Fig. 9a. The interfacial tension decreased much more rapidly (in 100 s) for all TEOS concentrations compared to the cases without being catalysed by NH4OH in Fig. 8, suggesting that the speed of interfacial adsorption of silica nanoparticle was not limited by the TEOS concentration. The reason is that nanoparticle was in situ nucleated and grew at the oil–water interface, skipping the time needed to diffuse onto the interface. However, the time was normally needed by surfactant or polymer to diffuse to the immiscible interface for IFT reduction,20,21 and also necessary for the ex situ prepared nanoparticle to diffuse to the interface.39,40
The equilibrium interfacial tension decreased with the increase of TEOS concentration when the ammonia concentration was remained constantly, as also shown in Fig. 9a. Mineral oil with higher concentration of TEOS had lower IFT, which was probably because higher concentration of TEOS could generate more silica NPs at the oil–water interface. At the beginning of hydrolysis reaction, the interface was covered by a single layer of silica NPs. If the particle production process still went on after the interface was fully occupied, multilayer NPs would induce the interface jamming effect. Cui et al. also found that the interfacial jamming of nanoparticles can reduce the IFT.19
The IFT for sample containing 50% TEOS was only available till 557 s, because the oil drop was elongated and did not remain at equilibrium state due to nanoparticle jamming at the deformed oil droplet. The curve fitting process could not continue and the error of shape fitting for IFT calculation based on Young–Laplace method was too high.
Furthermore, when injecting more oil into the oil droplet (Fig. 9b–e) after the equilibrium IFT had achieved, the oil drop was observed as plastic swollen and distorted deformation instead of falling down like water drop or oil drop without assembled NPs. It can be clearly seen that an elastic interface was formed due to nanoparticle jamming at the oil–water interface. However, if injecting extra oil into the oil droplet, the distorted oil drop finally fell down because the NPs-assembled elastic interface was burst from inner side, only leaving a shell fragment adhering on the needle tip (Fig. 9e). The residual shell clearly evidenced that a solid-like layer at the interface was formed, due to nanoparticle assembling and jamming at the oil–water interface.
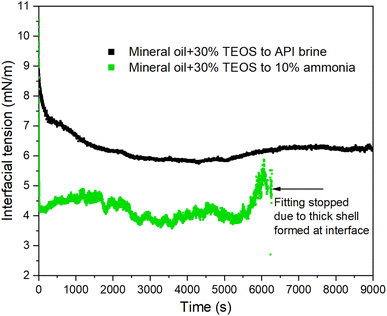
The IFT in Fig. 10 became equilibrium and reached the lowest/equilibrium level at around 2100 s for the case without catalytic effect from NH4OH (black scatter dots). The time scale here approximately matched with the time scale for the same oil–brine combination at room temperature in Fig. 8, where the IFT for that case took ∼2000 s to reach the equilibrium status. It means the temperature did not accelerate the speed of IFT reaching the equilibrium status. However, the reaction rate was accelerated remarkably with the presence of NH4OH which provided a catalytic effect on silica nanoparticle production. The IFT was reduced to the lowest value in just 60 s shown by the green scatter points in Fig. 10, coinciding with the results for the same oil–water case at room temperature in Fig. 9 but with a slightly quicker speed to reach equilibrium.
It is noteworthy that the IFT started to rise for the case with ammonia from around 5010 s, which was contradictory to the traditional trend that IFT decreases constantly to reach the equilibrium value. The reason to the observed phenomenon was that too many NPs were produced at the oil–water interface as the hydrolysis reaction going on, and as a result, multilayers of NPs jammed at the interface and generated an elastic interface as specifically analysed in Fig. 11. The same trend can also be found from the results for the case without ammonia in Fig. 10, in which the IFT started to decrease from 200 s and then increase from around 5400 s. Obviously it took much longer to observe the increase of IFT because of slower reaction rate without catalysis effect from ammonia.
3.4 Analysis of the particle assembly and IFT evolution process
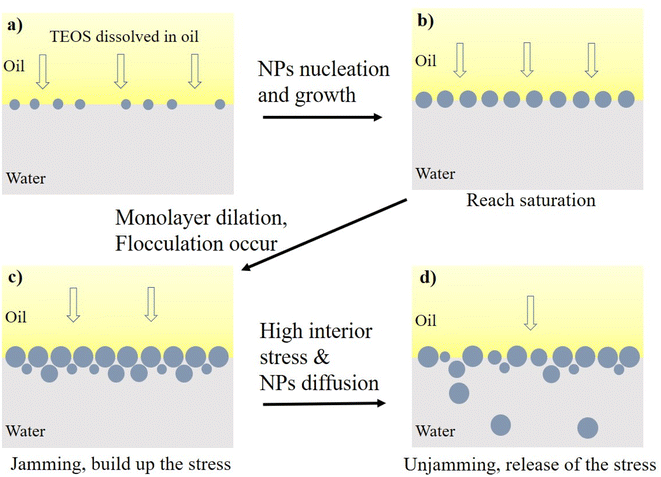
The silica NPs themselves had high adsorption energy at oil–water interface.42 Moreover, the organic molecules anchoring on the silica NPs significantly increased the binding energy of individual particle to the interface. Therefore, the trapped particles tended to grow at the oil–water interface. Upon increasing reaction time, more silica NPs were formed at the oil–water interface and those previously existing particles grew up, enabling densification of the assembly until the complete saturation (Fig. 11b). The IFT declined as the saturation degree increasing, and achieved the lowest value at full saturation.43 The saturation was evidenced by the lower plateau of receding curves in Fig. 8 and 9.
For the jamming process, the primary monolayer and the follow-on formed layers underwent dilation due to the growth of trapped silica NPs, inducing cumulative interior stress on the particle–laden interface. Then, the multilayer dense packing or surface flocculation caused the collapse of multilayer packing due to the onset of critical interior stress, which were evidenced by the sharp declines of IFT at ∼1600 s and ∼6100 s for the green line in Fig. 10. In addition, Kegel et al. had found that diffusive behaviour is apparent even though the systems bear significant memory of their local structure.45 In this research, the interface has transited into glass-like phase in the step 2 described above. However, NPs diffusion from glass-like interface ladened with multilayer NPs into bulk aqueous phase, was still possible especially under elevated temperature.
4 Conclusion
This paper presents a novel way to produce and spontaneously assemble NPs at the immiscible interface by the in situ reaction, rather than using pre-synthesized NPs. The reaction-induced self-assembly of produced NPs could reduce the oil–water IFT and also facilitated a good stability of nanoparticle in the aqueous phase with high salinity. The initial aim of this idea is to circumvent the challenge/difficulty of long-distance NPs delivery in the large-scale reservoirs, when using NPs for enhanced oil recovery and reservoir diagnosis. But it also holds a great potential to form structural liquid–liquid interface, for the applications such as Pickering emulsion, liquid 3D printing and molding, and bijels which are applicable in catalysis, energy systems and tissue engineering.Experimental study shows that the ammonia as catalyst could accelerate the processes of silica NPs formation, and quickly reduce the IFT to equilibrium/plateau level without experiencing gradual decline which is inevitable for traditional IFT evolution with no reaction. Compared to the reactions at ambient temperature, high temperature could not improve the reaction rate. However, the elevated temperature induced a sine-wave IFT evolution curves regardless of the presence of catalyst. The lowest equilibrium value of IFT corresponded to the saturation state of interface trapping with SiO2 NPs, while the sine-wave fluctuating pattern of IFT corresponded to the alternating transition between jammed and unjammed states. Saturation and jamming processes were driven by NPs nucleation, trapping and growth on the oil–water interface, while unjamming was induced by excessive interior stress and diffusion into bulk brine phase.
The nanoparticles produced and spontaneously functionalized at the interface also had good stability in the aqueous phase with high salinity. Apart from being functionalized by the organic species from the oil phase, the presence of surfactant in the aqueous phase, especially the surfactant/polymer end-capped with a complementary functionality, should be investigated in the future research. The influence of various important factors, including precursor concentration, surfactant and reaction time, on the reaction rate, NPs assemble and interfacial tension, should be fully investigated to better control the nanoparticle assemble at the interface.
Conflicts of interest
The authors declare no competing financial interest.Acknowledgements
Dongsheng Wen acknowledges the support from the European Research Council (ERC-2014-CoG, Project reference: 648375).References
- Y. Chai, A. Lukito, Y. Jiang, P. D. Ashby and T. P. Russell, Nano Lett., 2017, 17, 6453–6457 CrossRef CAS.
- R. N. Moghaddam, A. Bahramian, Z. Fakhroueian, A. Karimi and S. Arya, Energy Fuels, 2015, 29, 2111–2119 CrossRef.
- H. Zhang, T. S. Ramakrishnan, A. Nikolov and D. Wasan, J. Colloid Interface Sci., 2018, 511, 48–56 CrossRef CAS PubMed.
- X. Liu, S. Shi, Y. Li, J. Forth, D. Wang and T. P. Russell, Angew. Chem., 2017, 129, 12768–12772 CrossRef.
- S. Shi, X. Liu, Y. Li, X. Wu, D. Wang, J. Forth and T. P. Russell, Adv. Mater., 2018, 30, 1870057 CrossRef.
- S. Shi and T. P. Russell, Adv. Mater., 2018, 30, 1800714 CrossRef.
- E. M. Herzig, K. A. White, A. B. Schofield, W. C. Poon and P. S. Clegg, Nat. Mater., 2007, 6, 966–971 CrossRef CAS PubMed.
- P. S. Clegg, E. M. Herzig, A. B. Schofield, S. U. Egelhaaf, T. S. Horozov, B. P. Binks, M. E. Cates and W. C. Poon, Langmuir, 2007, 23, 5984–5994 CrossRef CAS PubMed.
- Z. Hu, E. Nourafkan, H. Gao and D. Wen, Fuel, 2017, 210, 272–281 CrossRef CAS.
- Z. Tai, Y. Huang, Q. Zhu, W. Wu, T. Yi, Z. Chen and Y. Lu, Drug Discovery Today, 2020, 25, 2038–2045 CrossRef CAS.
- T. Zhang, D. Espinosa, K. Y. Yoon, A. R. Rahmani, H. Yu, F. M. Caldelas, S. Ryoo, M. Roberts, M. Prodanovic, K. P. Johnston, T. E. Milner, S. L. Bryant and C. Huh, Presented in part at the Offshore Technology Conference, Houston, Texas, USA, 2011 Search PubMed.
- K. Yu, H. Zhang, C. Hodges, S. Biggs, Z. Xu, O. J. Cayre and D. Harbottle, Langmuir, 2017, 33, 6528–6539 CrossRef CAS PubMed.
- C. Zhang, Z. M. Li, Q. Sun, P. Wang, S. H. Wang and W. Liu, Soft Matter, 2016, 12, 946–956 RSC.
- P. Nguyen, H. Fadaei and D. Sinton, Energy Fuels, 2014, 28, 6221–6227 CrossRef CAS.
- A. J. Worthen, S. L. Bryant, C. Huh and K. P. Johnston, AIChE J., 2013, 59, 3490–3501 CrossRef CAS.
- J. Q. Wang, G. B. Xue, B. X. Tian, S. Y. Li, K. Chen, D. Wang, Y. W. Sun, H. Xu, J. T. Petkov and Z. M. Li, Energy Fuels, 2017, 31, 408–417 CrossRef CAS.
- W. P. Yang, T. F. Wang, Z. X. Fan, Q. Miao, Z. Y. Deng and Y. Y. Zhu, Energy Fuels, 2017, 31, 4721–4730 CrossRef CAS.
- T. Sharma, G. Suresh Kumar and J. S. Sangwai, Geosyst. Eng., 2014, 17, 195–205 CrossRef CAS.
- M. Cui, T. Emrick and T. P. Russell, Science, 2013, 342, 460–463 CrossRef CAS PubMed.
- A. Toor, B. A. Helms and T. P. Russell, Nano Lett., 2017, 17, 3119–3125 CrossRef CAS PubMed.
- A. Toor, S. Lamb, B. A. Helms and T. P. Russell, ACS Nano, 2018, 12, 2365–2372 CrossRef CAS PubMed.
- C. Huang, Y. Chai, Y. Jiang, J. Forth, P. D. Ashby, M. M. L. Arras, K. Hong, G. S. Smith, P. Yin and T. P. Russell, Nano Lett., 2018, 18, 2525–2529 CrossRef CAS PubMed.
- H. Yu, Y. He, P. Li, S. Li, T. Zhang, E. Rodriguez-Pin, S. Du, C. Wang, S. Cheng, C. W. Bielawski, S. L. Bryant and C. Huh, Sci. Rep., 2015, 5, 8702 CrossRef CAS PubMed.
- Z. Hu, H. Gao, S. Ramisetti, J. Zhao, E. Nourafkan, P. W. J. Glover and D. Wen, Sci. Total Environ., 2019, 669, 579–589 CrossRef CAS PubMed.
- C. A. R. Costa, C. A. P. Leite and F. Galembeck, J. Phys. Chem. B, 2003, 107, 4747–4755 CrossRef CAS.
- A. Beganskienė, M. Kurtinaitienė and A. K. R. Juškėnas, Mater. Sci., 2004, 10, 1320–1392 Search PubMed.
- W. W. Yu, L. Qu, W. Guo and X. Peng, Chem. Mat., 2003, 15, 2854–2860 CrossRef CAS.
- R. S. Dubey, Y. B. R. D. Rajesh and M. A. More, Mater. Today, 2015, 2, 3575–3579 CAS.
- M. Mohammadi, M. K. Khorrami and H. Ghasemzadeh, Spectrochim. Acta, Part A, 2019, 220, 117049 CrossRef CAS PubMed.
- F. Kunc, V. Balhara, Y. Sun, M. Daroszewska, Z. J. Jakubek, M. Hill, A. Brinkmann and L. J. Johnston, Analyst, 2019, 144, 5589–5599 RSC.
- C. C. Ballard, E. C. Broge, R. K. Iler, D. S. St. John and J. R. McWhorter, J. Phys. Chem., 1961, 65, 20–25 CrossRef CAS.
- A. K. Van Helden, J. W. Jansen and A. Vrij, J. Colloid Interface Sci., 1981, 81, 354–368 CrossRef CAS.
- T. Luo, W. Zeng, R. Zhang, C. Zhou, X. Yang and Z. Ren, ACS Appl. Electron. Mater., 2021, 3, 1691–1698 CrossRef CAS.
- S. Li, Q. Wan, Z. Qin, Y. Fu and Y. Gu, Langmuir, 2015, 31, 824–832 CrossRef CAS PubMed.
- P. A. Bazuła, P. M. Arnal, C. Galeano, B. Zibrowius, W. Schmidt and F. Schüth, Microporous Mesoporous Mater., 2014, 200, 317–325 CrossRef.
- J. Farrando-Pérez, C. López, J. Silvestre-Albero and F. Gallego-Gómez, J. Phys. Chem. C, 2018, 122, 22008–22017 CrossRef.
- M. Insausti, R. Timmis, R. Kinnersley and M. C. Rufino, Sci. Total Environ., 2020, 706, 135124 CrossRef CAS PubMed.
- J. Huang, N. R. Kankanamge, C. Chow, D. T. Welsh, T. Li and P. R. Teasdale, J. Environ. Sci., 2018, 63, 174–197 CrossRef CAS PubMed.
- A. Toor, T. Feng and T. P. Russell, Eur. Phys. J. E: Soft Matter Biol. Phys., 2016, 39, 57 CrossRef PubMed.
- R. Li, Y. Chai, Y. Jiang, P. D. Ashby, A. Toor and T. P. Russell, ACS Appl. Mater. Interfaces, 2017, 9, 34389–34395 CrossRef CAS PubMed.
- J. Vialetto, N. Nussbaum, J. Bergfreund, P. Fischer and L. Isa, J. Colloid Interface Sci., 2022, 608, 2584–2592 CrossRef CAS PubMed.
- E. Guzman, F. Martinez-Pedrero, C. Calero, A. Maestro, F. Ortega and R. G. Rubio, Adv. Colloid Interface Sci., 2022, 302, 102620 CrossRef CAS PubMed.
- P. Y. Kim, Z. Fink, Q. Zhang, E. M. Dufresne, S. Narayanan and T. P. Russell, ACS Nano, 2022, 16, 8967–8973 CrossRef CAS PubMed.
- S. Reynaert, P. Moldenaers and J. Vermant, Phys. Chem. Chem. Phys., 2007, 9, 6463–6475 RSC.
- W. K. Kegel and A. van Blaaderen, Science, 2000, 287, 290–293 CrossRef CAS PubMed.
| This journal is © The Royal Society of Chemistry 2022 |

